
First, I want to extend a warm welcome to our newest Weather 20/20 subscribers, and thank all of you for being part of our growing community.
Our mission is simple: help you make better decisions before the weather happens. Throughout the year, you’ll receive regular Weather Intelligence Reports that go beyond the daily forecast. We’ll analyze developing weather patterns, highlight potential risks and opportunities, and explain the atmospheric trends shaping the weeks and months ahead. Whether your decisions involve agriculture, transportation, energy, business, or simply planning ahead, our goal is to provide weather intelligence you won’t find anywhere else.
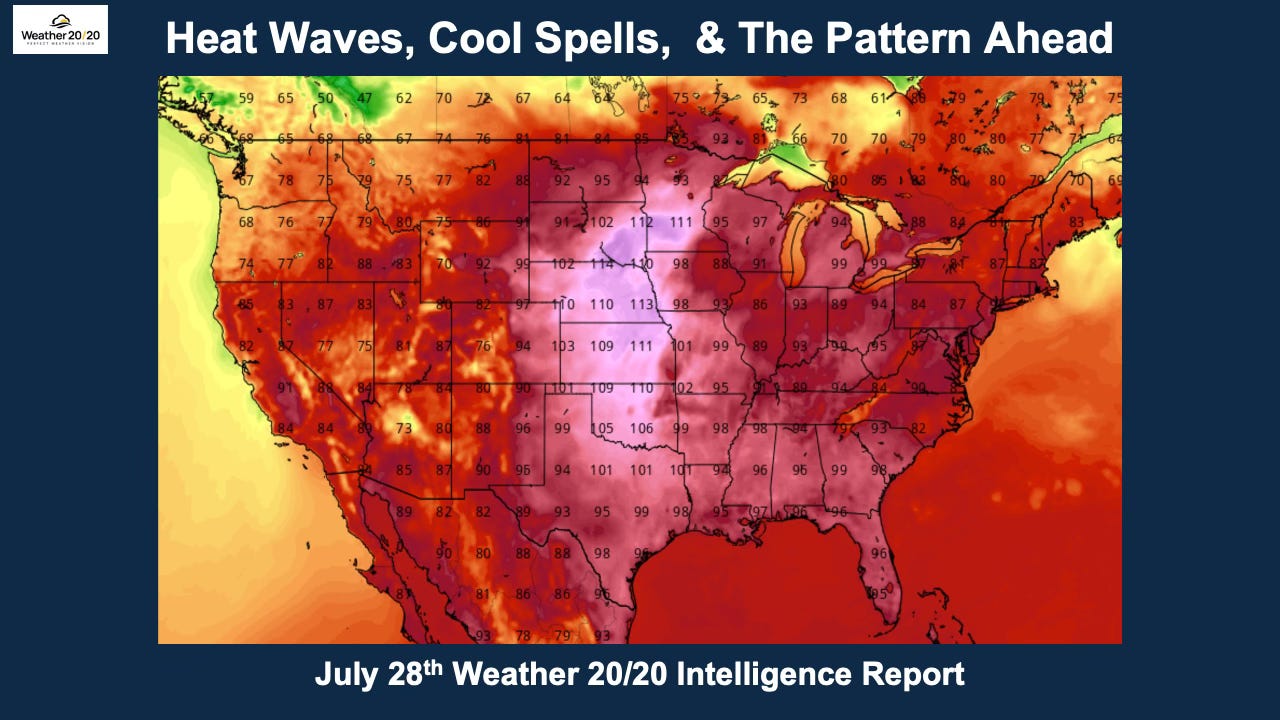
Another major heat wave is poised to develop during the next two weeks. The current heat wave is shifting west right on schedule, bringing dangerous heat to parts of California and the Desert Southwest. As that ridge weakens and moves, the atmosphere will begin reorganizing, setting the stage for another significant surge of heat to develop in roughly a week.
Summer is far from over. While the calendar will soon turn to August and we’ll eventually begin watching for the first hints of fall, the atmosphere still has another chapter of intense summer weather to write before that seasonal transition begins.
Before we compare May 13th and July 26th, I’d like to step back and look at the bigger picture.
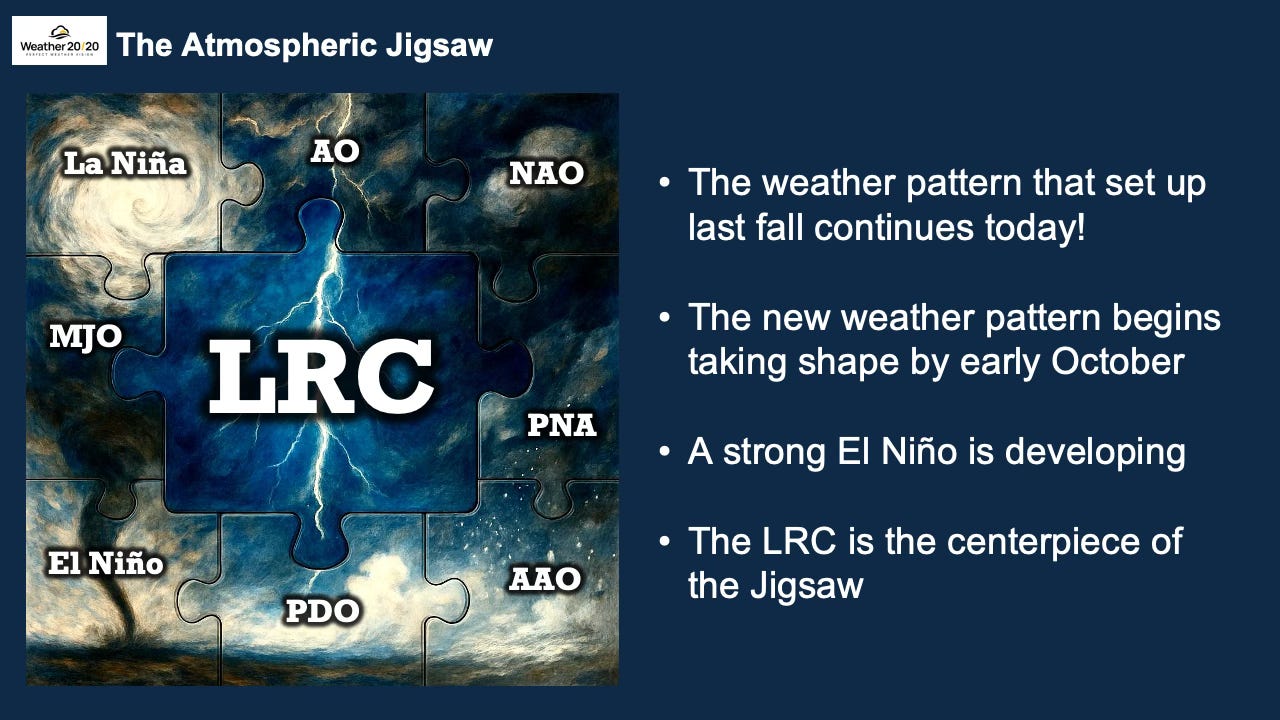
The atmosphere is like a giant jigsaw puzzle. Every piece matters—La Niña, El Niño, the MJO, AO, NAO, PNA, PDO, AAO—each influences the weather in its own way. But none of these pieces operates independently. They interact continuously to shape the evolving weather pattern.
The Lezak Recurring Cycle (LRC) is the centerpiece of that puzzle. It provides the framework that helps us understand how all of these atmospheric influences evolve together over time.
The weather pattern that became established last fall is still guiding today’s weather. That’s why we’ve been able to anticipate many of this summer’s major weather events months in advance. At the same time, we’re already watching the next atmospheric pattern begin taking shape. By early October, a new pattern will emerge and guide the weather into next spring.
And there is another important piece of the puzzle. A strengthening El Niño is developing across the equatorial Pacific. As we move toward autumn, it will become an increasingly important influence on the next recurring weather pattern. We will begin the El Niño discussion in a few weeks.
Before we compare the atmospheric patterns from 74 days ago and today, let’s go back even farther.
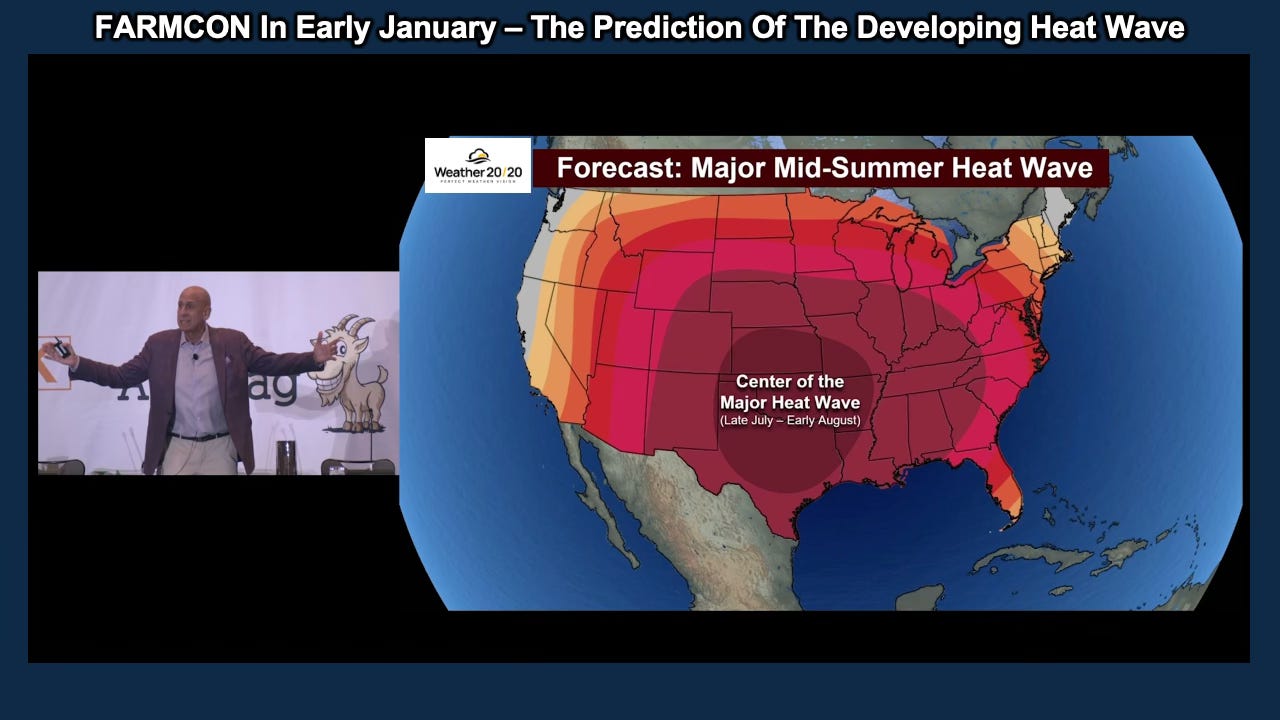
On the first day of winter, December 21st, we released our seasonal outlook showing a major mid-summer heat wavedeveloping during late July into early August. At that time, we weren’t relying on long-range computer models. The forecast was based on our analysis of this year’s evolving atmospheric pattern.
A couple of weeks later, I had the opportunity to speak at the FarmCon Conference, where I shared that same forecast with growers from across the country. I remember telling the audience:
“Take a picture of this. Save it. When it happens you'll say, Holy moly...he got it right!"
Today, we’re approaching that period, and the atmosphere is evolving remarkably close to what we anticipated months ago.
Now let’s compare the large-scale atmospheric pattern from 74 days ago with today’s pattern and see why this year’s weather continues to stay on schedule.
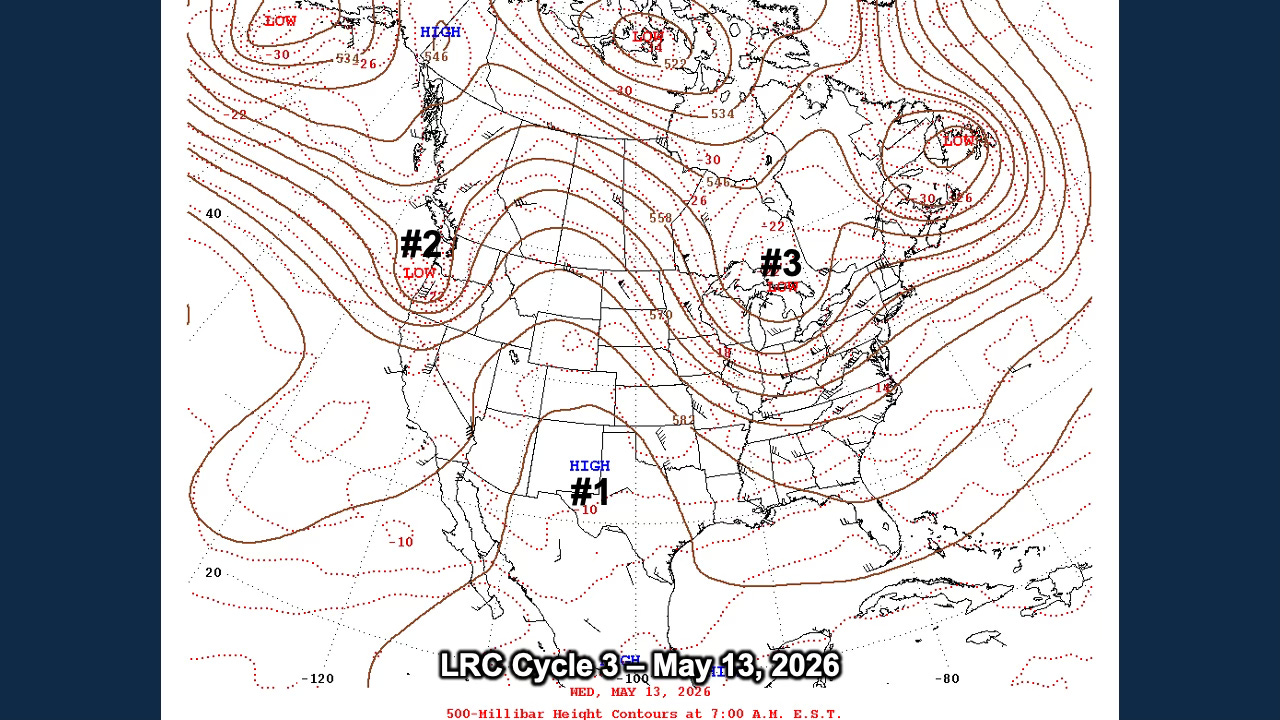
Now let’s compare the upper-level weather pattern from May 13th and July 26th, separated by 74 days.
Remember, we are not expecting these maps to be identical. The atmosphere is constantly evolving. What we’re looking for is whether the overall atmospheric state has returned in a recognizable way.
Notice the three dominant features.
#1 – The broad anticyclone remains anchored across the southern Rockies and southern Plains. While its exact position and strength have changed, the upper-level ridge continues to be the dominant feature and is now producing another significant heat wave.
#2 – A closed upper-level low is positioned along the Pacific Northwest coast in both patterns. The details differ, but the placement and role of this feature are remarkably similar.
#3 – Another strong upper-level low is located over central and eastern Canada. Again, the exact structure has evolved, but the larger-scale configuration has returned in a familiar way.
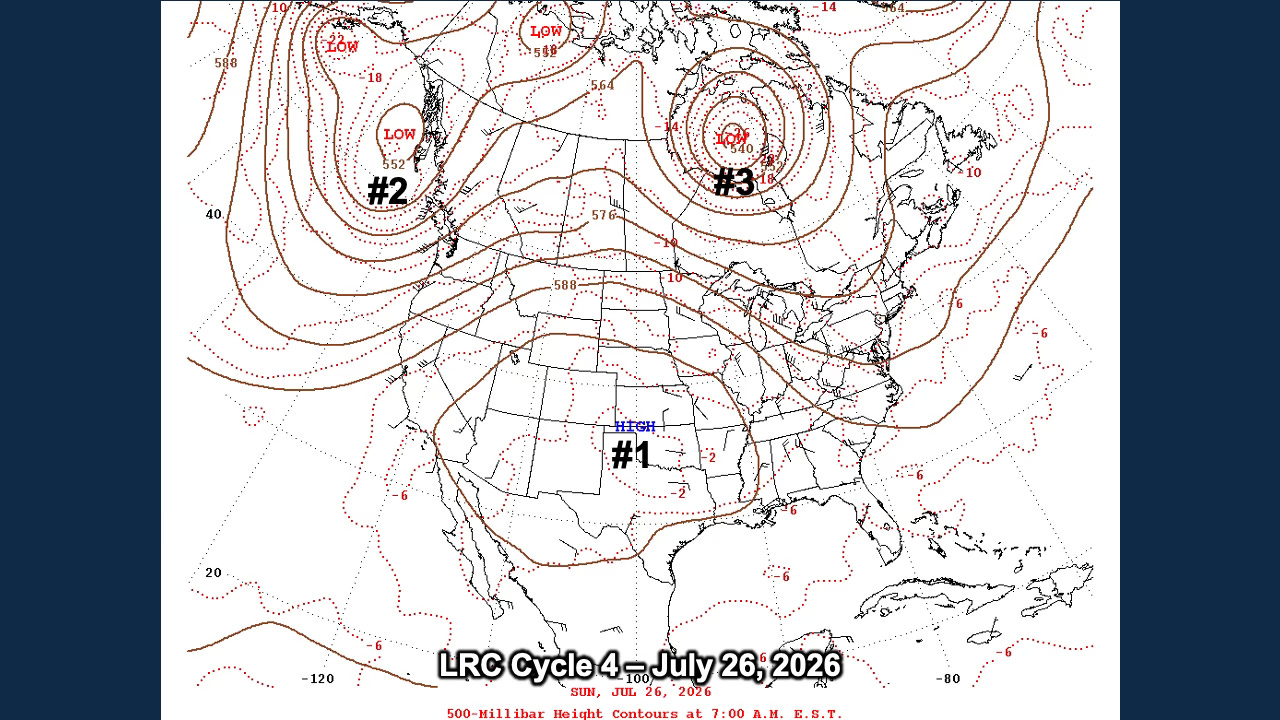
When you step back and look at the atmosphere as a whole, the similarities are striking. It is this recurring evolution of the large-scale pattern—not identical storms or identical weather—that gives us confidence in anticipating major shifts weeks and even months in advance, this one 7-months in advance.
And that’s exactly what led us to highlight this late July and early August heat wave long before conventional long-range guidance began showing it. If you look back at December, you will find Kansas City had three waves of warmth which are leading to two to three major heat waves as we move in to August, the strongest of which is likely coming later next week.
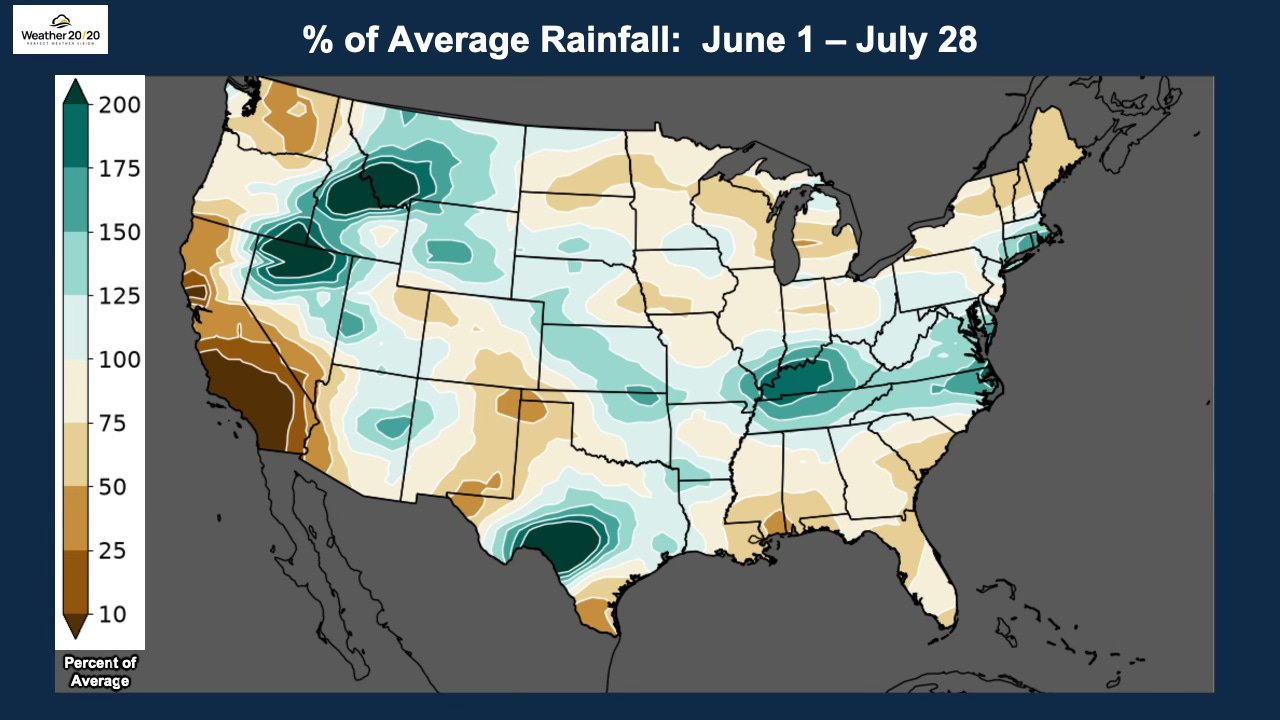
Now let’s look at how the atmosphere has translated into real weather since the beginning of meteorological summer.
The top map shows percent of average rainfall from June 1 through July 28. Rainfall has been highly uneven, just as we often see during the heart of summer. Some regions have received well over 150% to 200% of normal rainfall, while others—particularly parts of California and portions of the Southwest—have remained much drier than average.
One of the biggest stories has been the heavy rainfall across portions of the central United States, including parts of the Corn Belt, where some locations have recently measured six inches of rain in a single event. These timely rains have been beneficial for many crops, although they have also produced localized flooding.
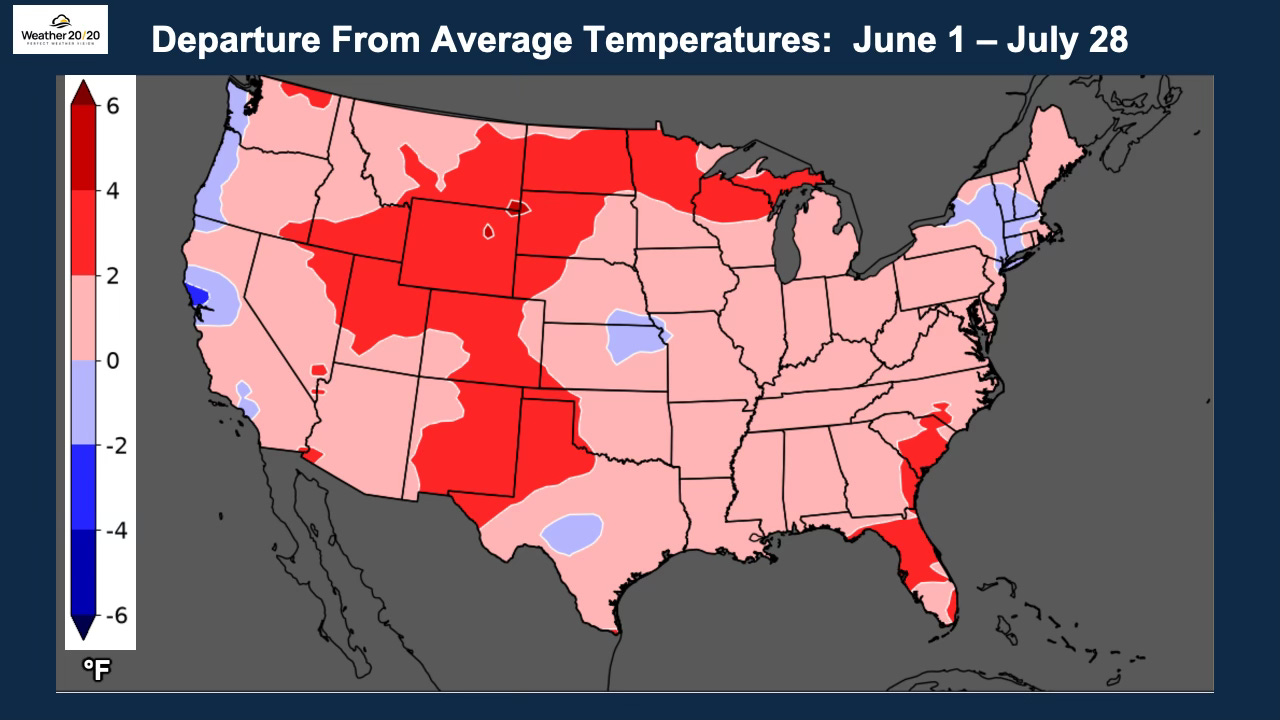
This map below shows temperature departures from average over the same period.
Most of the United States has experienced above-average temperatures, with the greatest warmth centered across the Rockies, High Plains, and portions of the northern Plains. Interestingly, despite several impressive heat waves, much of the eastern United States has been only modestly warmer than average because of repeated thunderstorm complexes, cloud cover, and periodic intrusions of cooler air.
As we move into early August, another significant heat wave is developing. We’ll be watching to see how these maps evolve over the next couple of weeks as this next phase of the recurring atmospheric pattern unfolds.
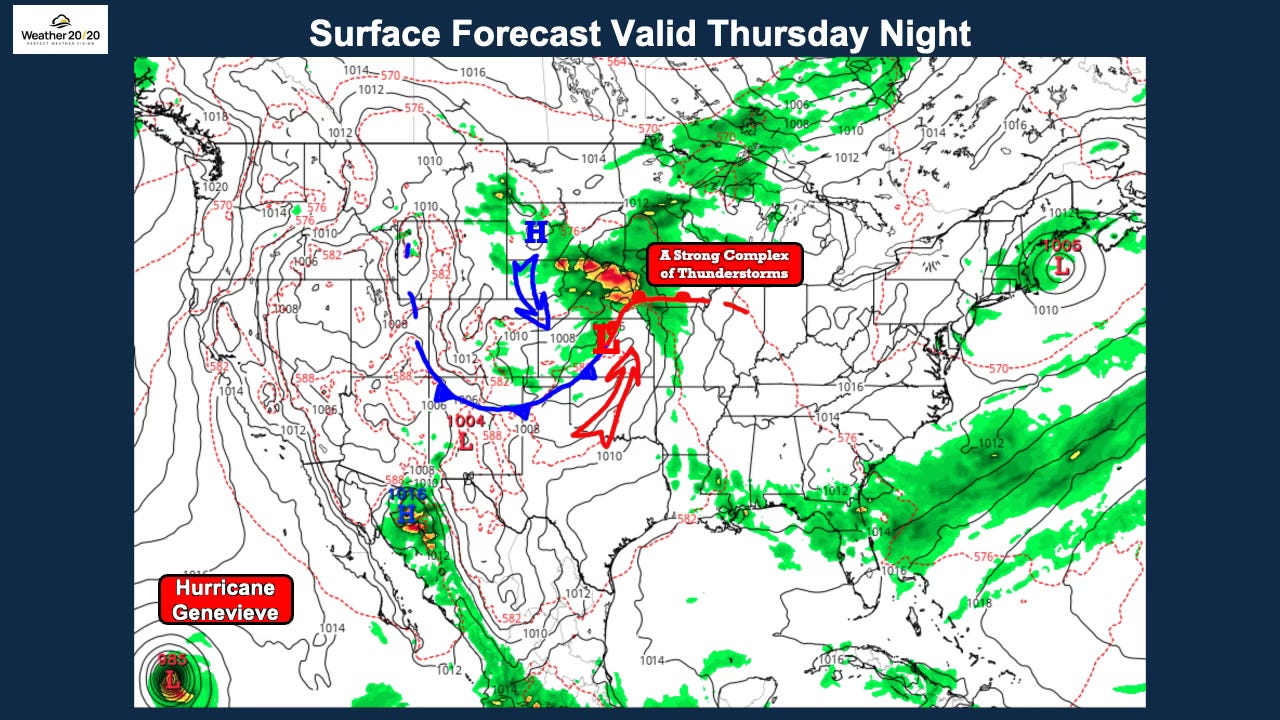
Looking ahead to later this week, the atmosphere will become much more active across the central United States.
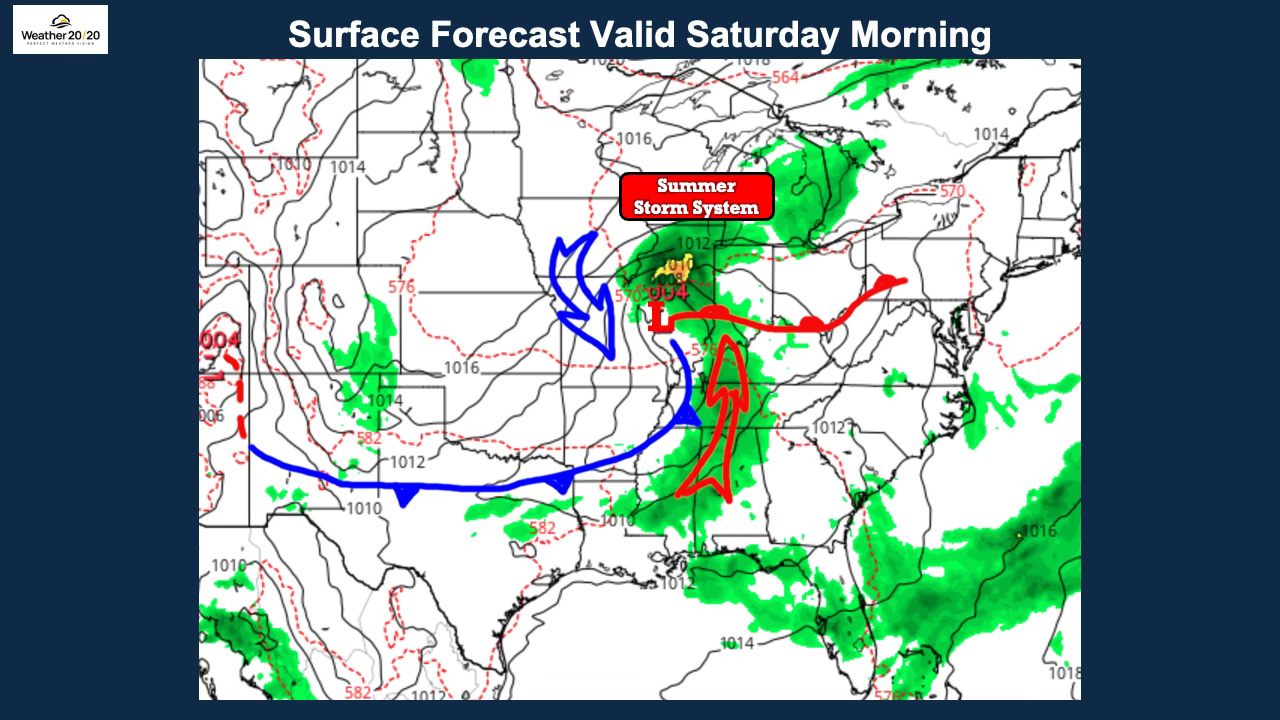
A summer storm system is forecast to organize Thursday night as a summer cyclone develops over the central Plains. As warm, humid air is available and collides with slightly cooler air dropping south, a strong complex of thunderstorms is expected to form and track toward the Kansas City area Thursday night into Friday.
By Saturday morning, the summer storm system will be lifting northeast into the Upper Midwest. The strongest thunderstorms will have shifted east of the Plains, while a trailing cold front extends southwest into the southern Rockies. Behind the storms, rain-cooled air will provide a brief break from the heat across parts of the central Plains, but that relief will be temporary. As the storm system departs, the upper-level anticyclone will begin strengthening once again, setting the stage for another significant surge of summer heat during the week ahead.
Comments
Nothing yet. Say the first thing.
Sign in to join the conversation.