
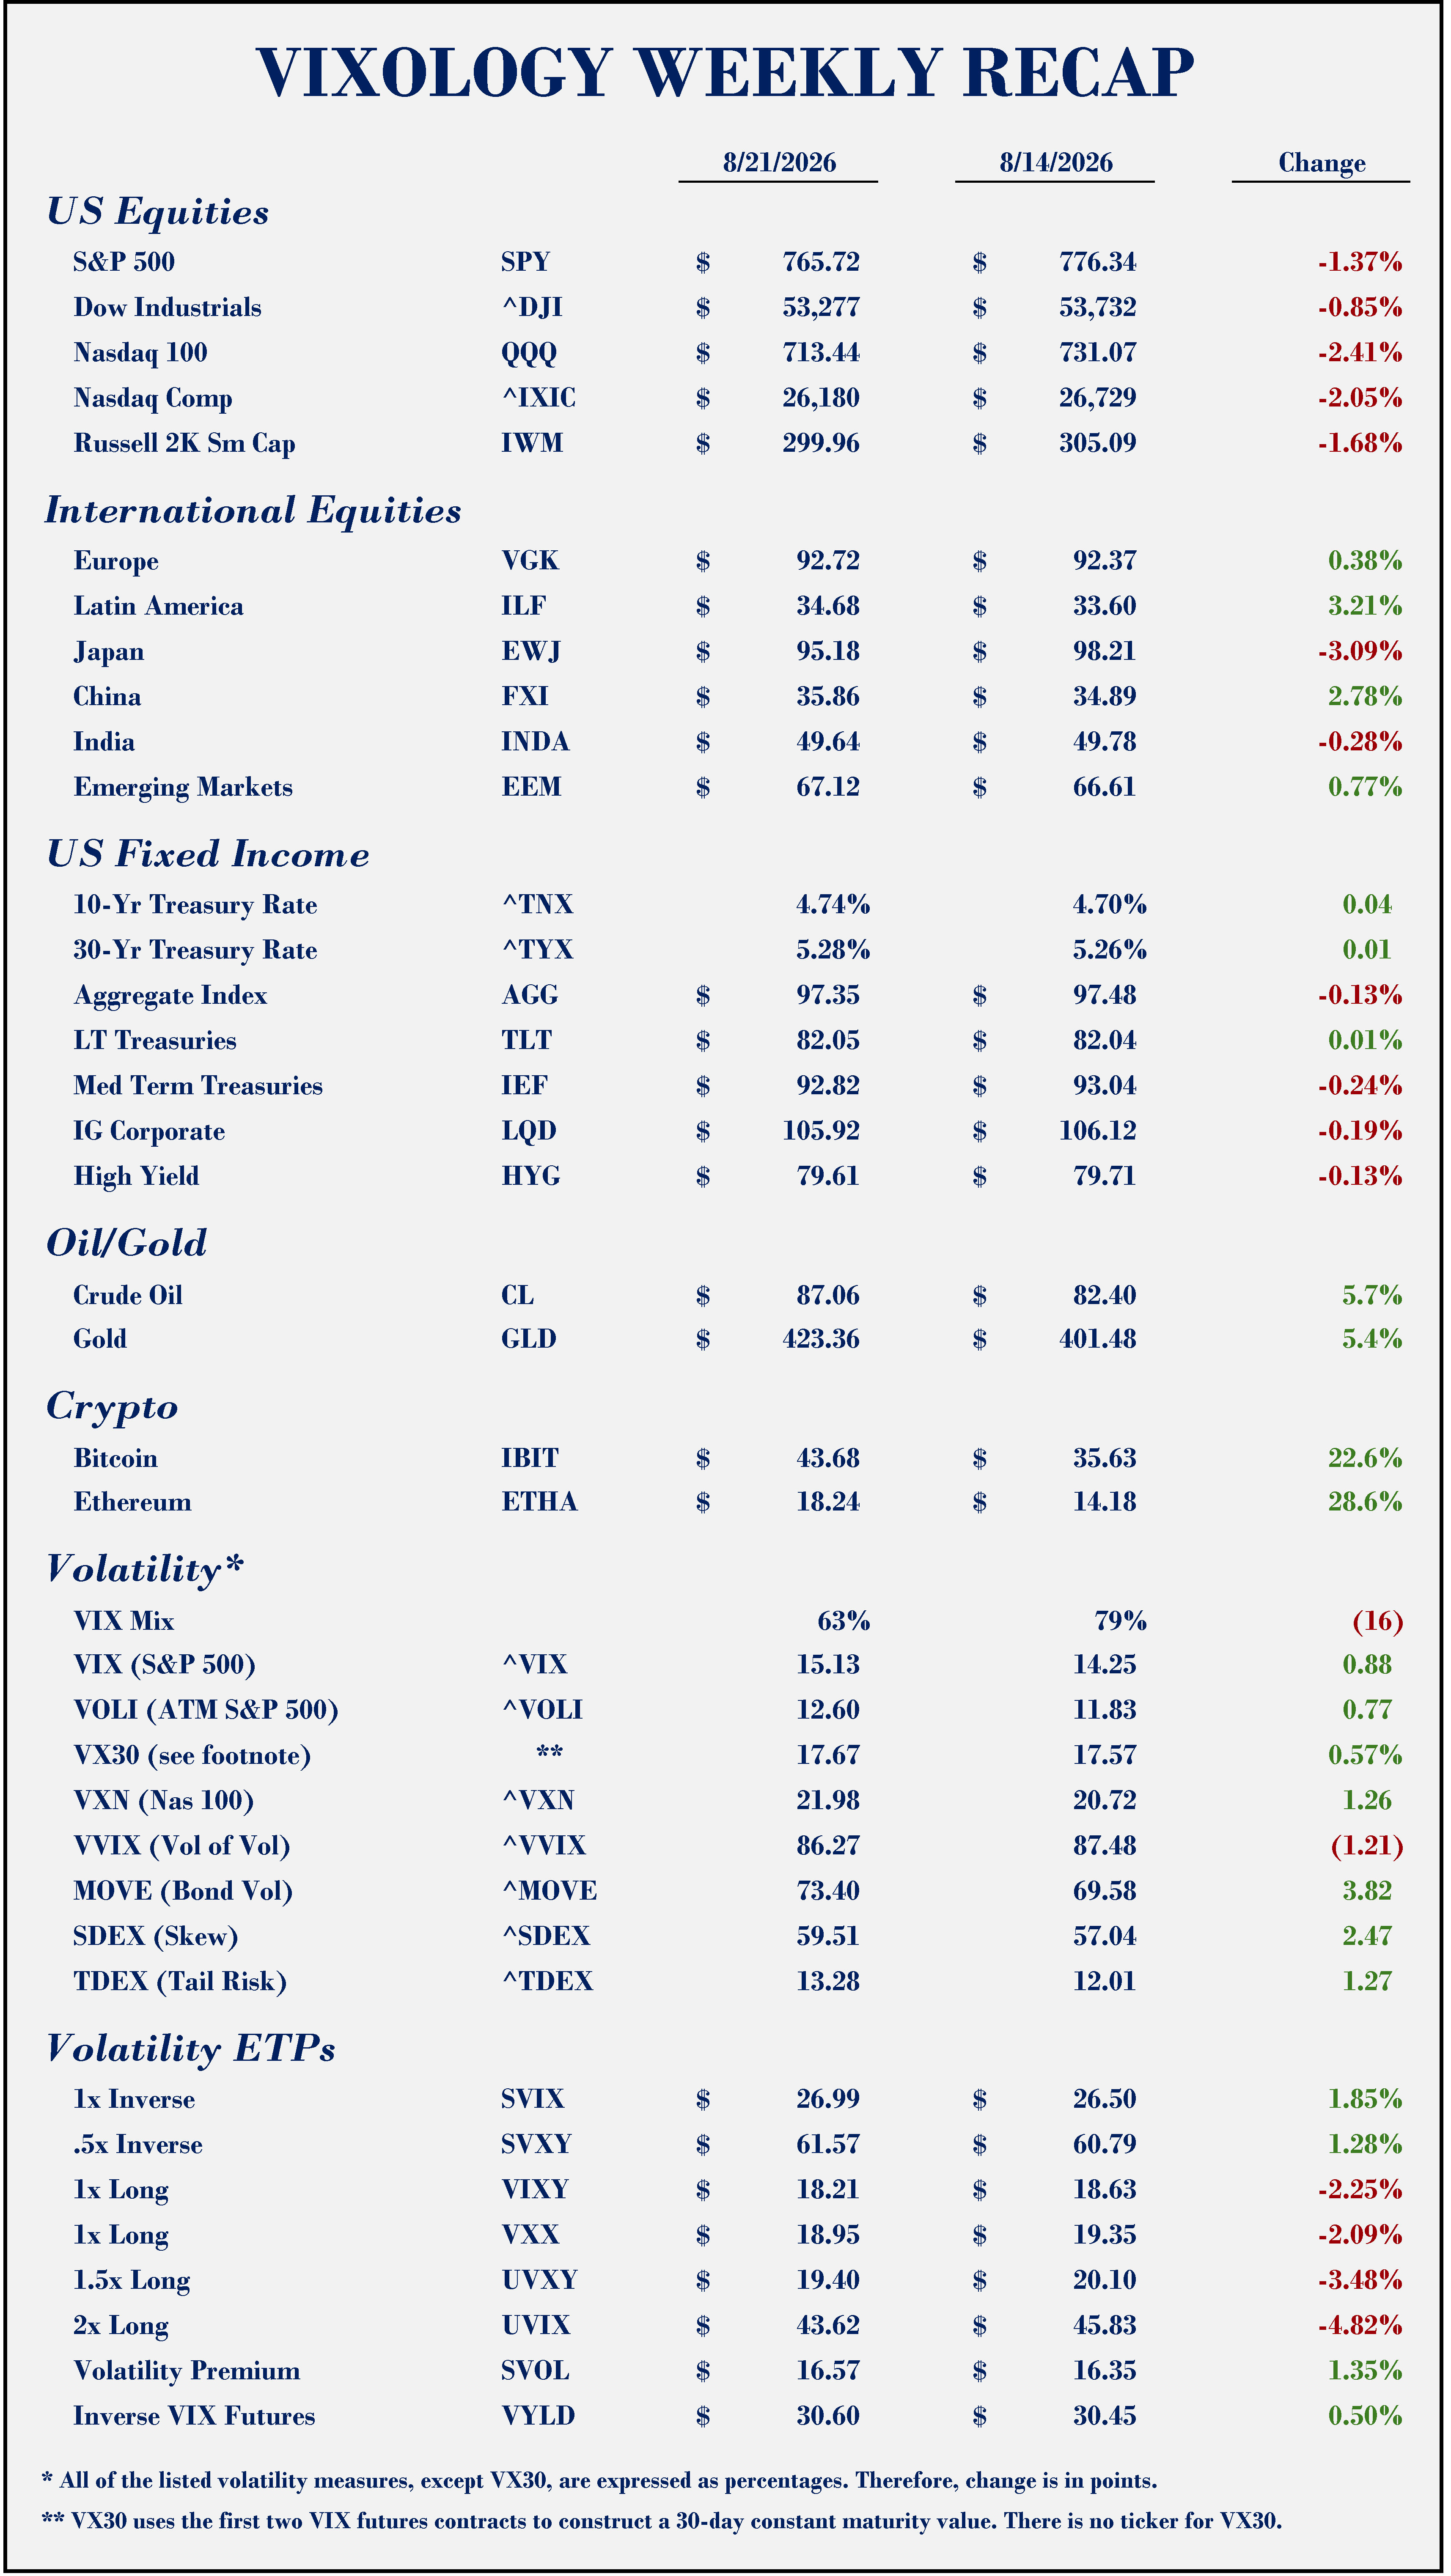
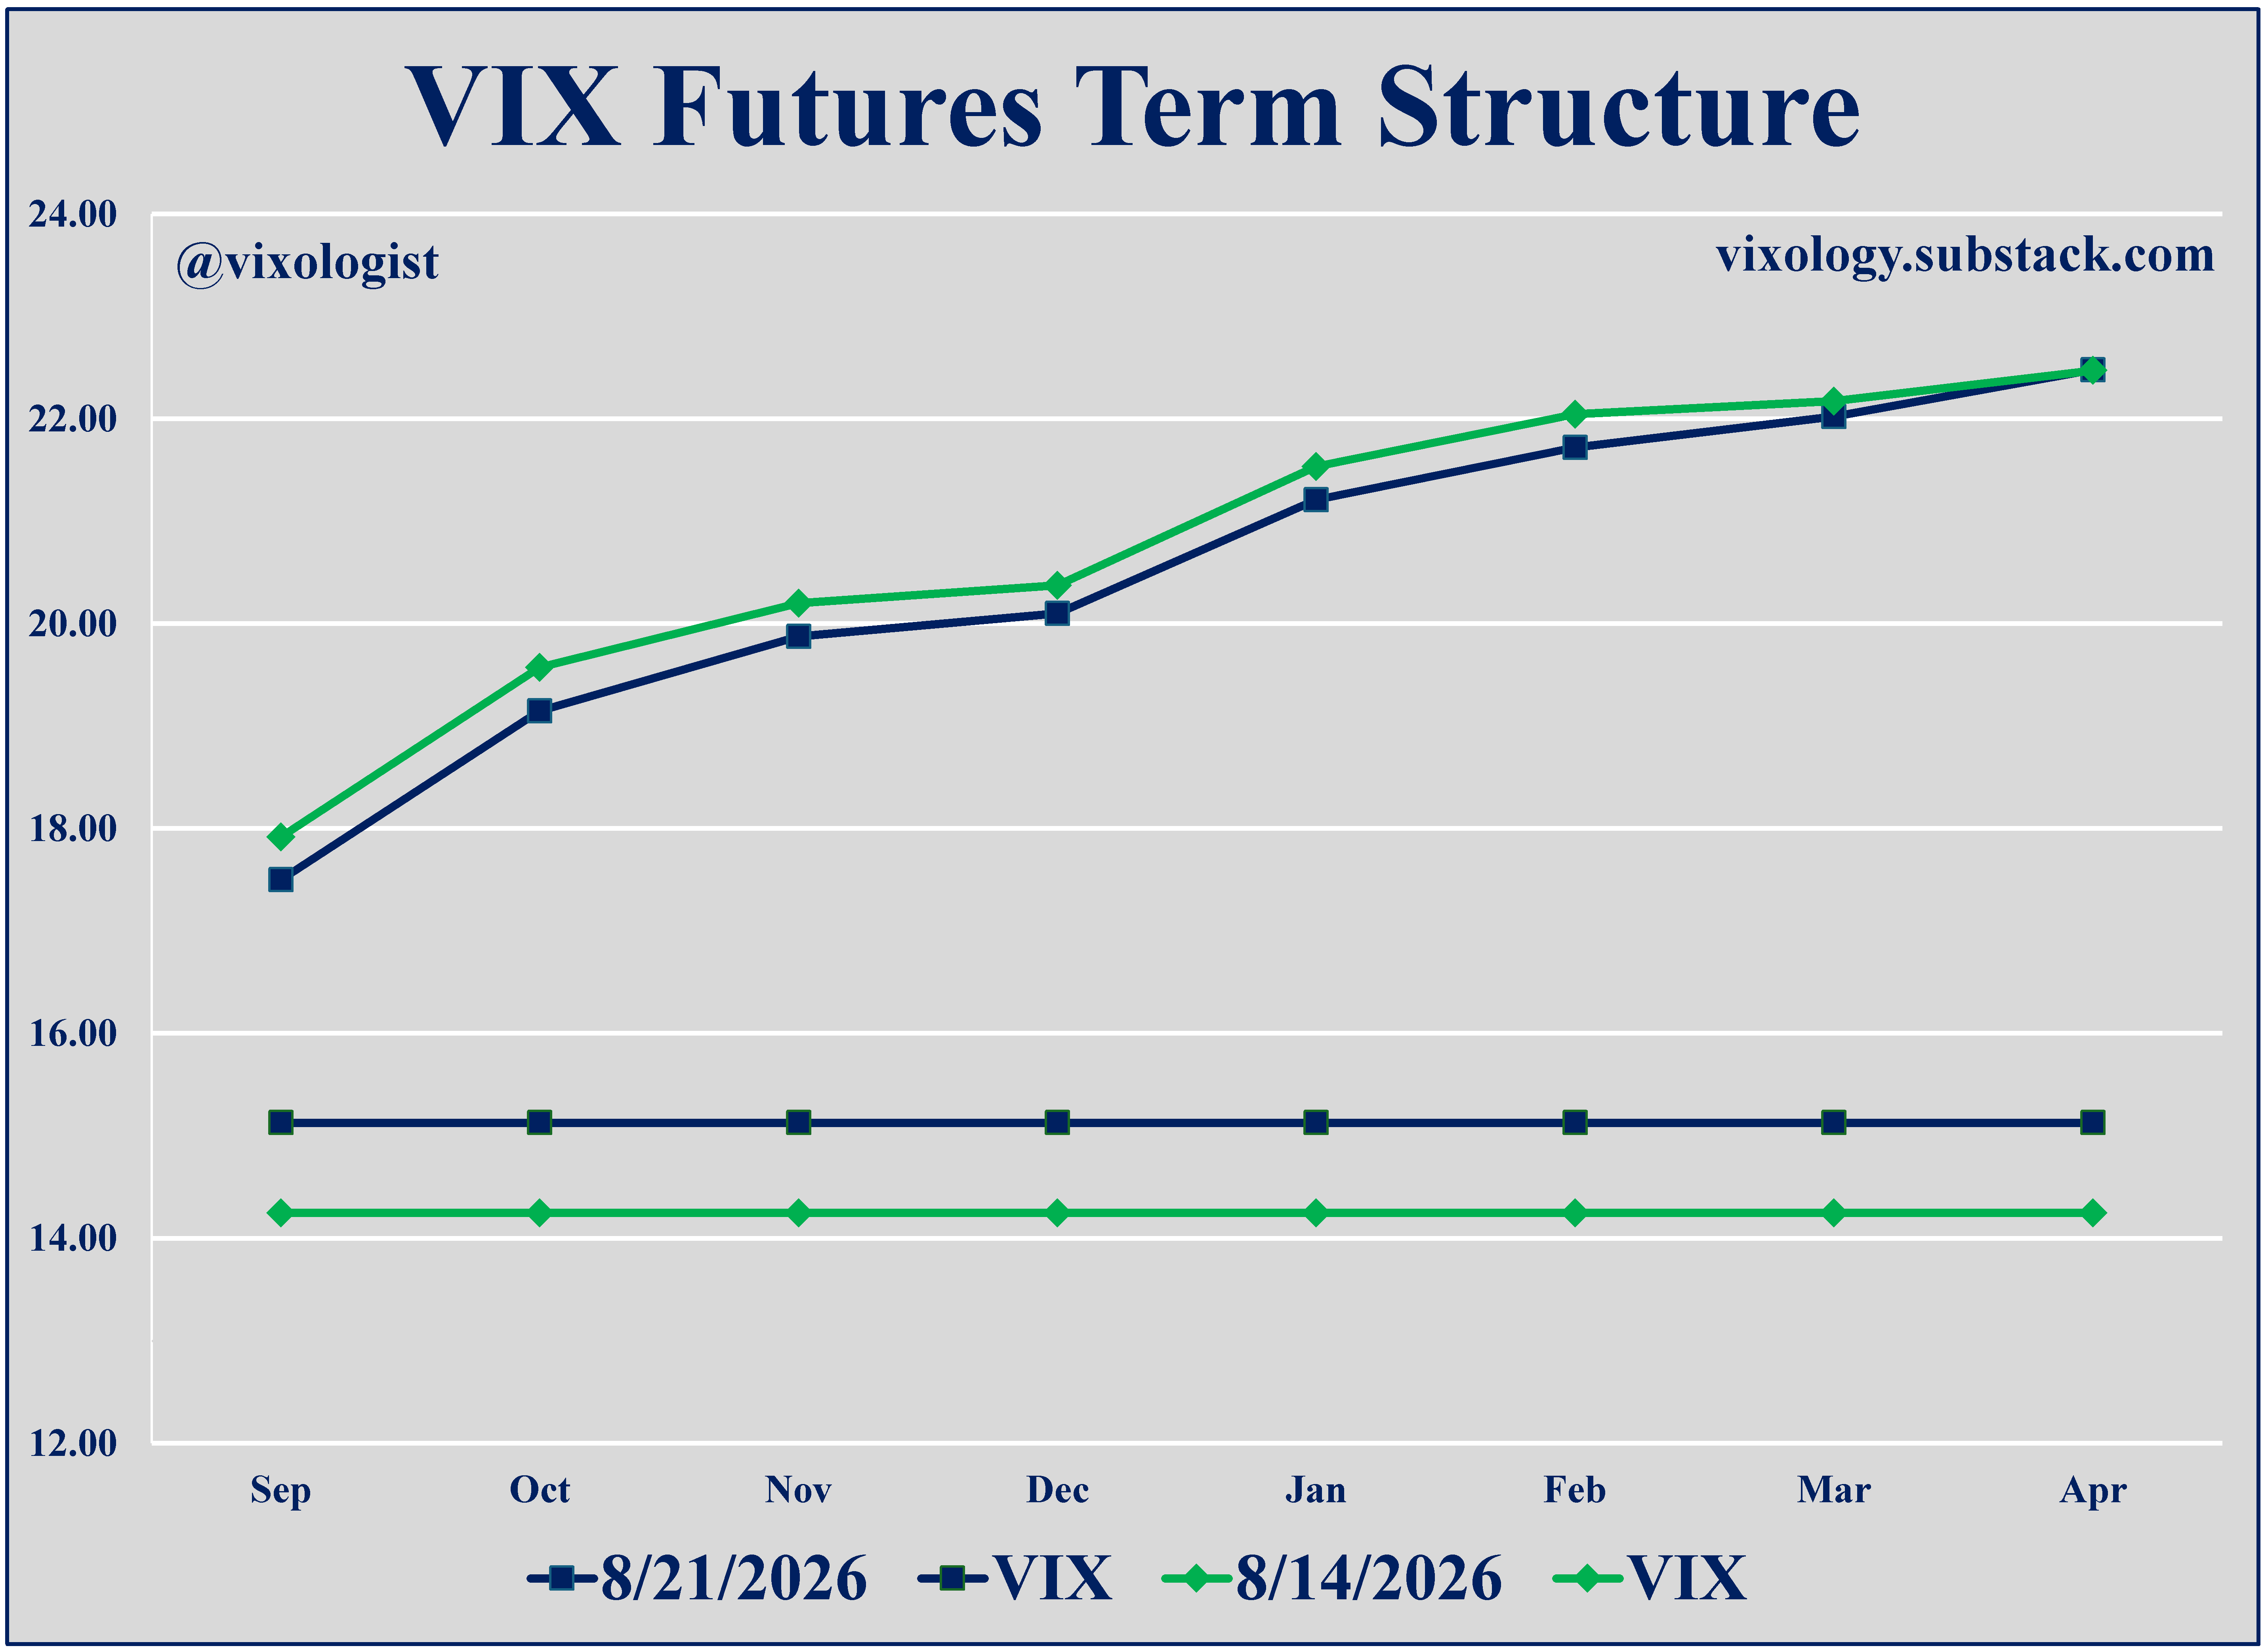
Remember our discussion of anomalous behavior related to the co-movement of the S&P 500 (SPX) and the CBOE Volatility Index better known as the VIX? And the part about how the VIX futures also tend to go the opposite direction - SPX up/futures down and vice versa? At first glance, it would appear that last week went according to the “rules.” SPX was down more than 1% for the week while both VIX and VX30 were somewhat higher. Even so, the ETFs representing a short interest in the VIX futures (SVIX and SVXY along with SVOL and VYLD) were all higher Friday to Friday. Let’s not spill too much ink on this. You can’t make sense of it from the chart below because the August futures contract expired in the middle of the week and was part of the VX30 calculation on Friday the 14th. We also had a week punctuated by two days (Tuesday and Thursday) where equity indices looked fragile only to see Wednesday and Friday give it a bit of the old “Never mind!”
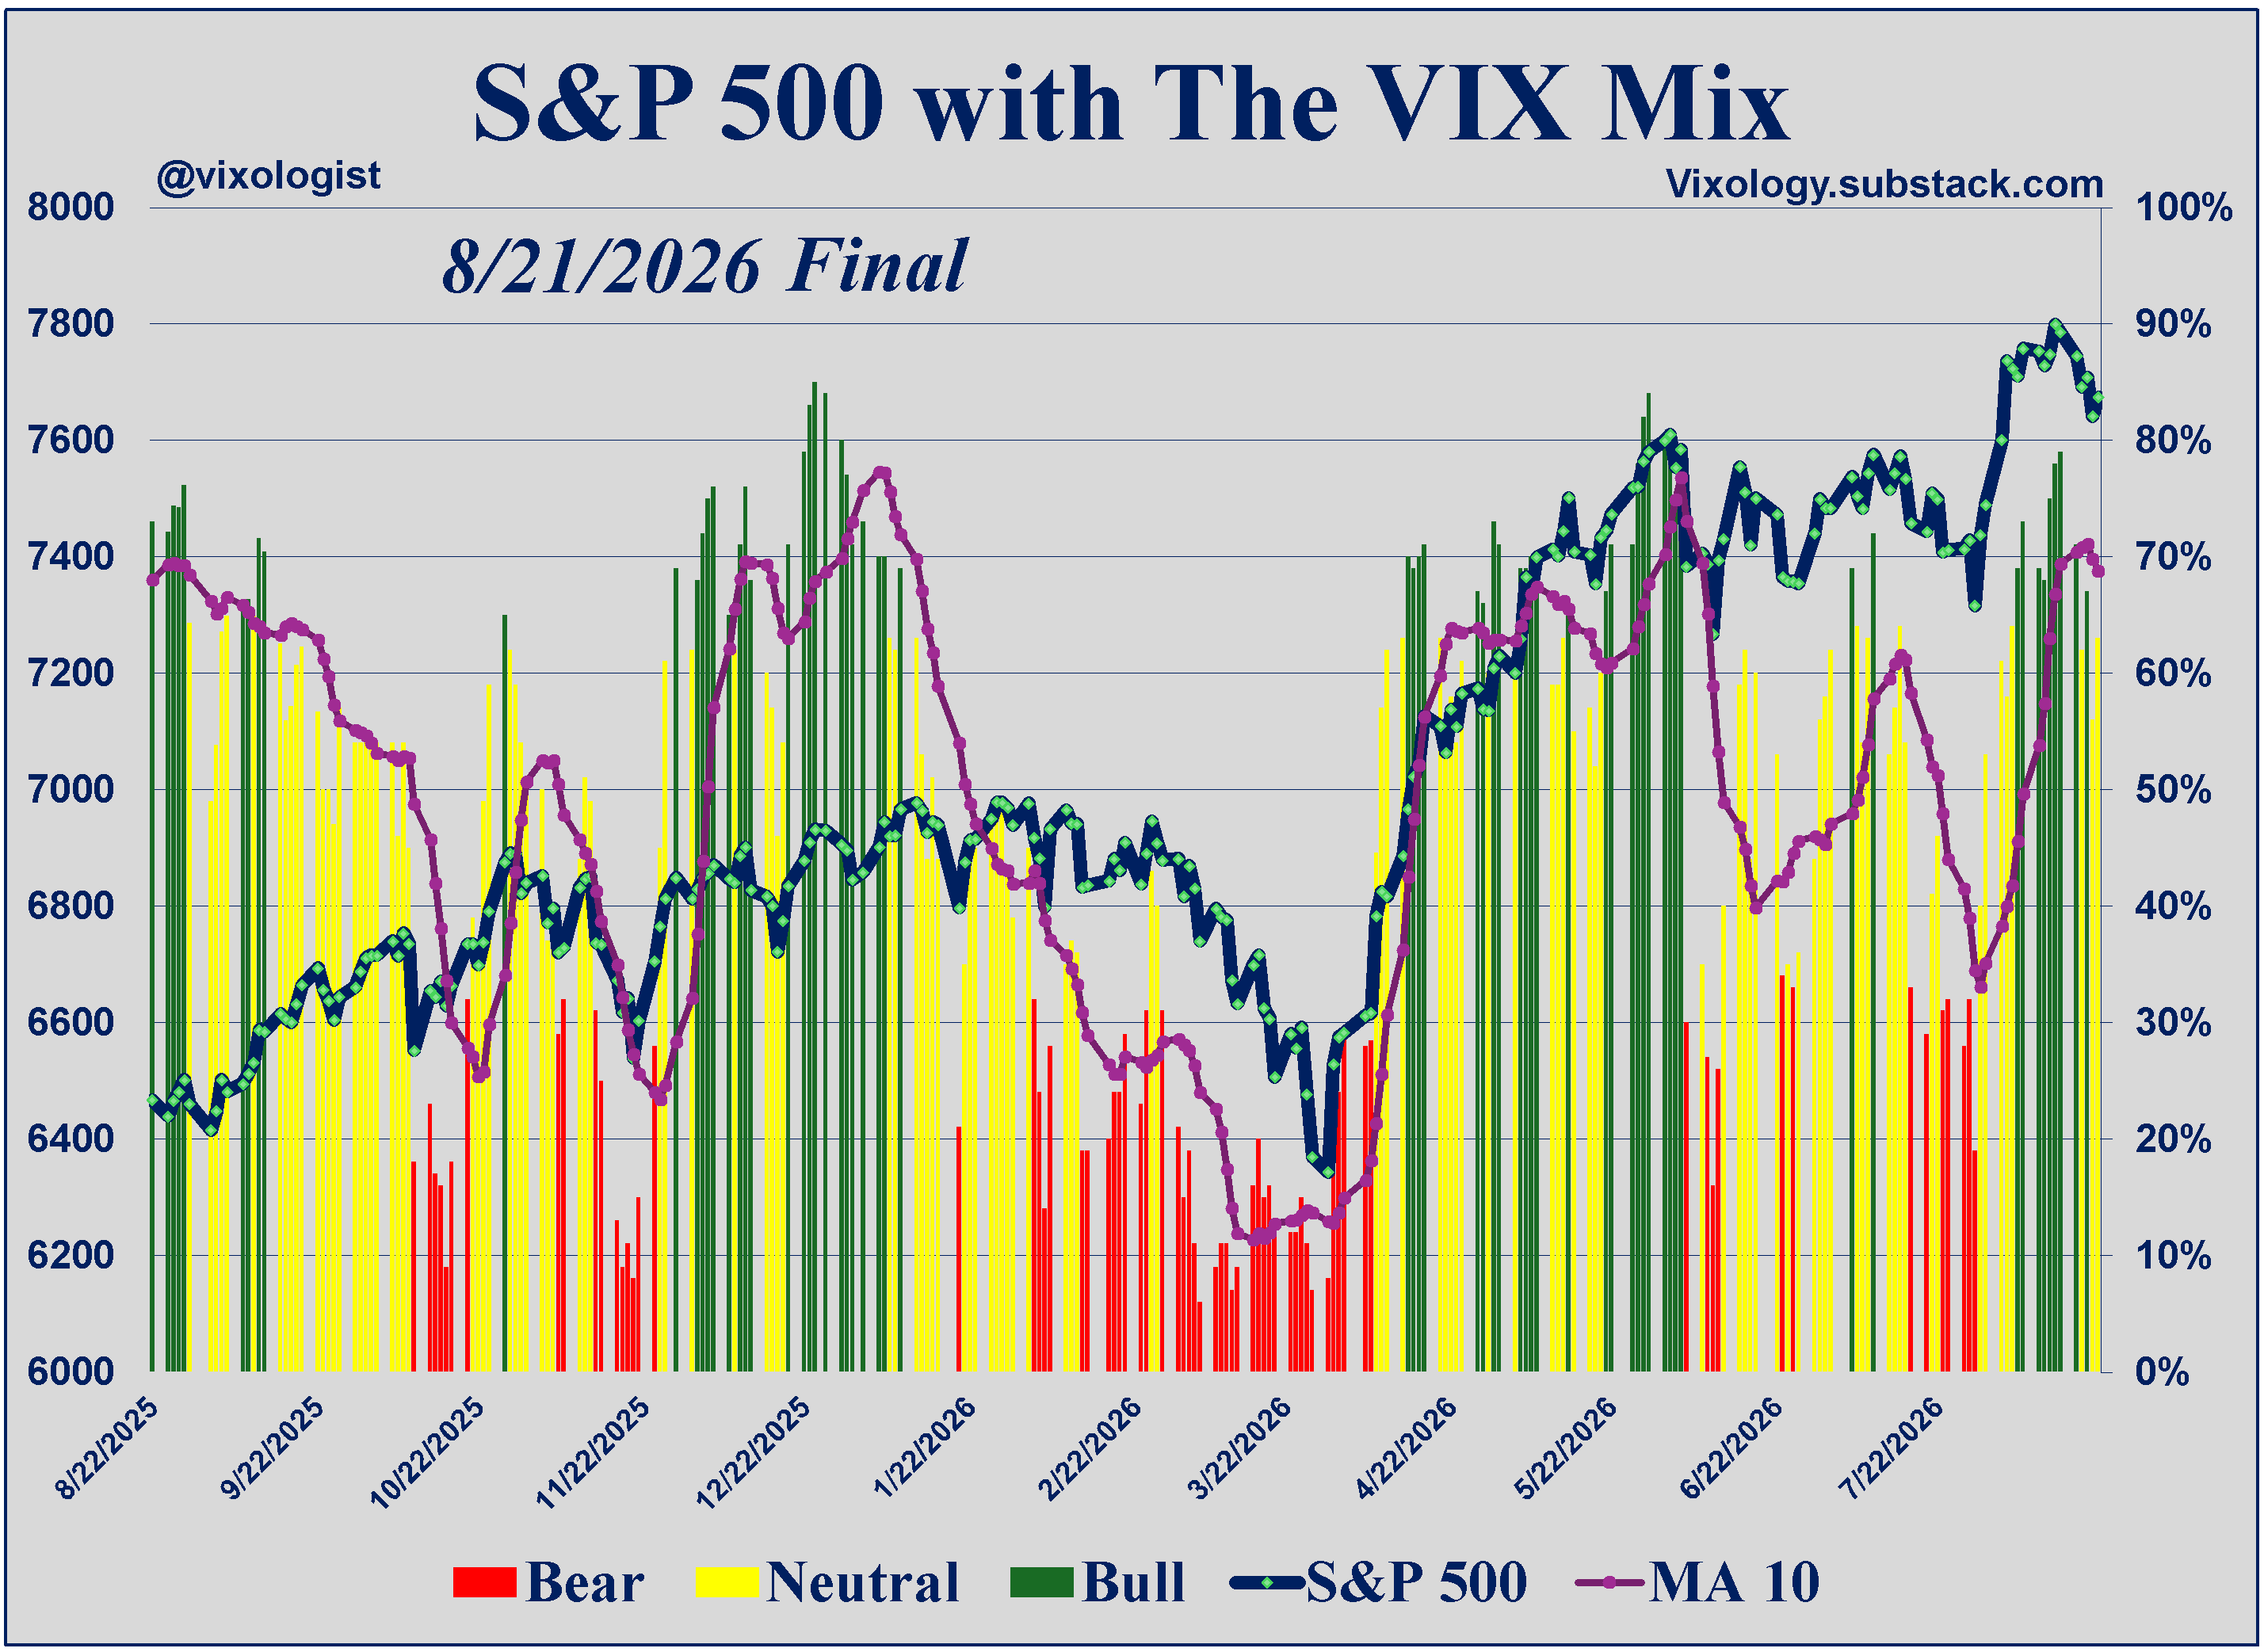
The daily ups and downs were also reflected in the VIX Mix. We closed last Monday with the eighth bullish reading in a row. Tuesday went to neutral but Wednesday rallied back to bullish. The week ended with two neutral counts.
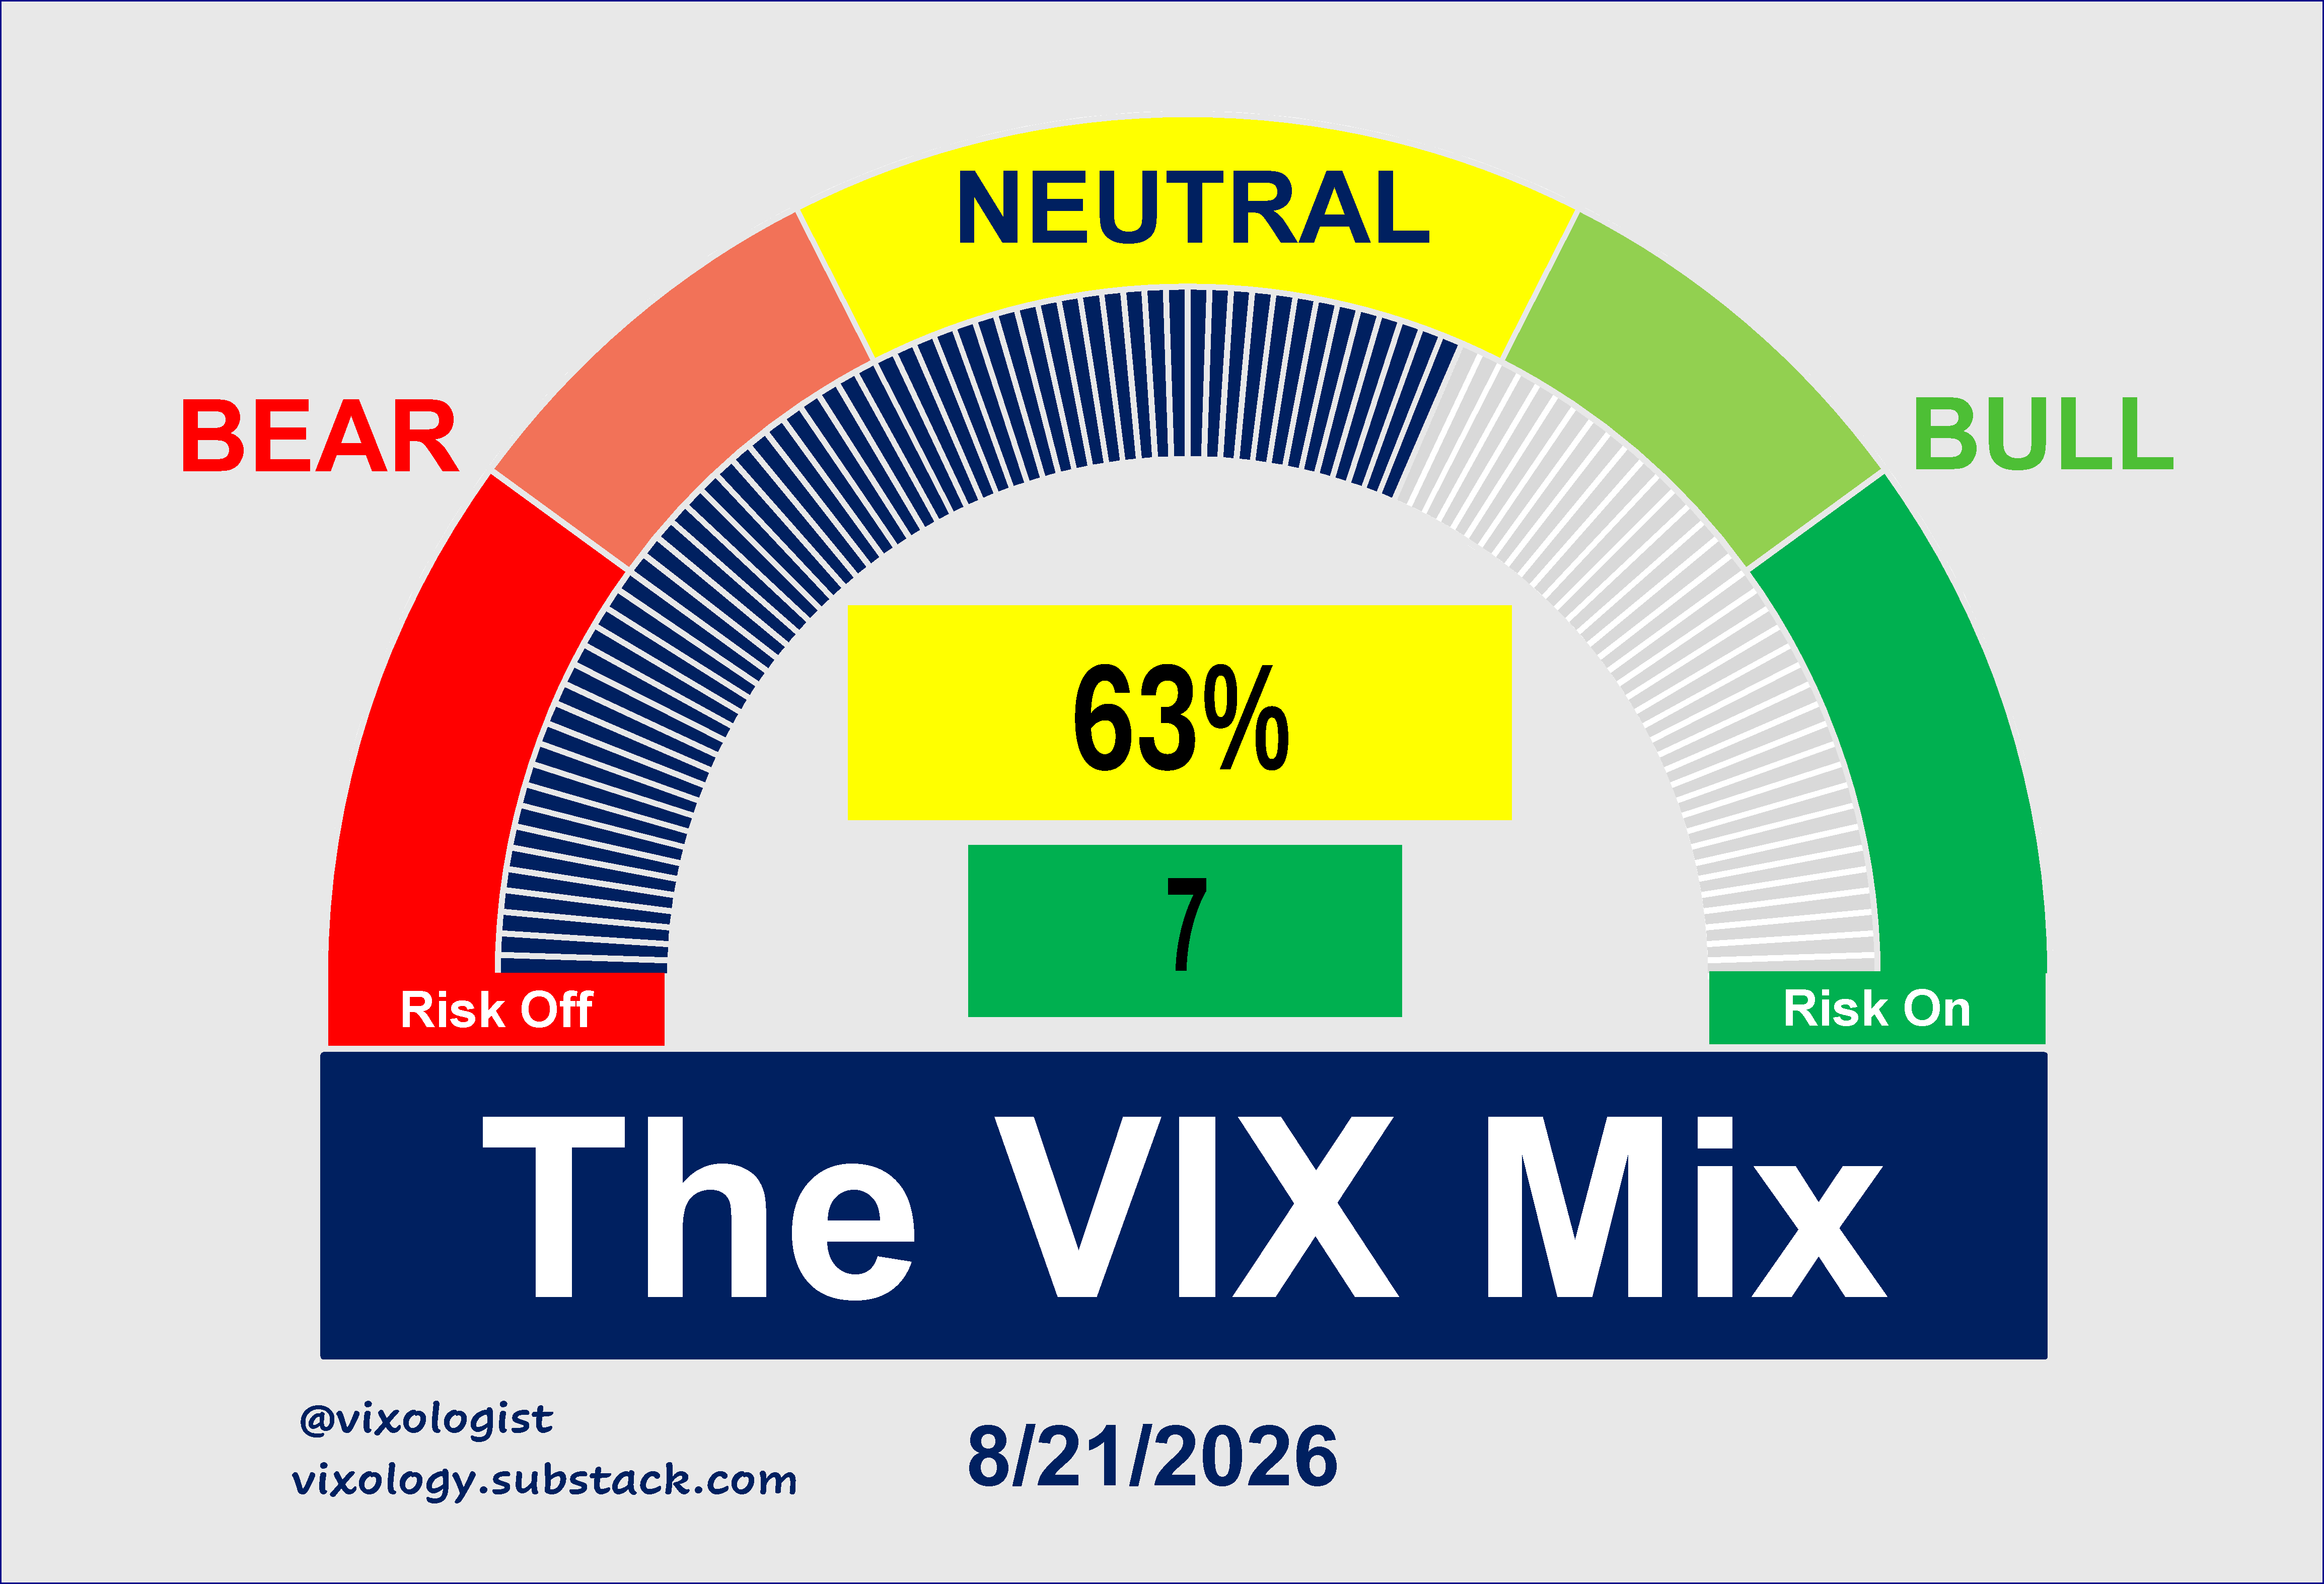
Friday landed at 63%, a pickup over Thursday but not enough to get back in the green. There was an improvement in the bull/bear mix from 6 and 3 on Thursday to 10 and 3 on Friday. Three components finished the week >80% while none were below 20%.
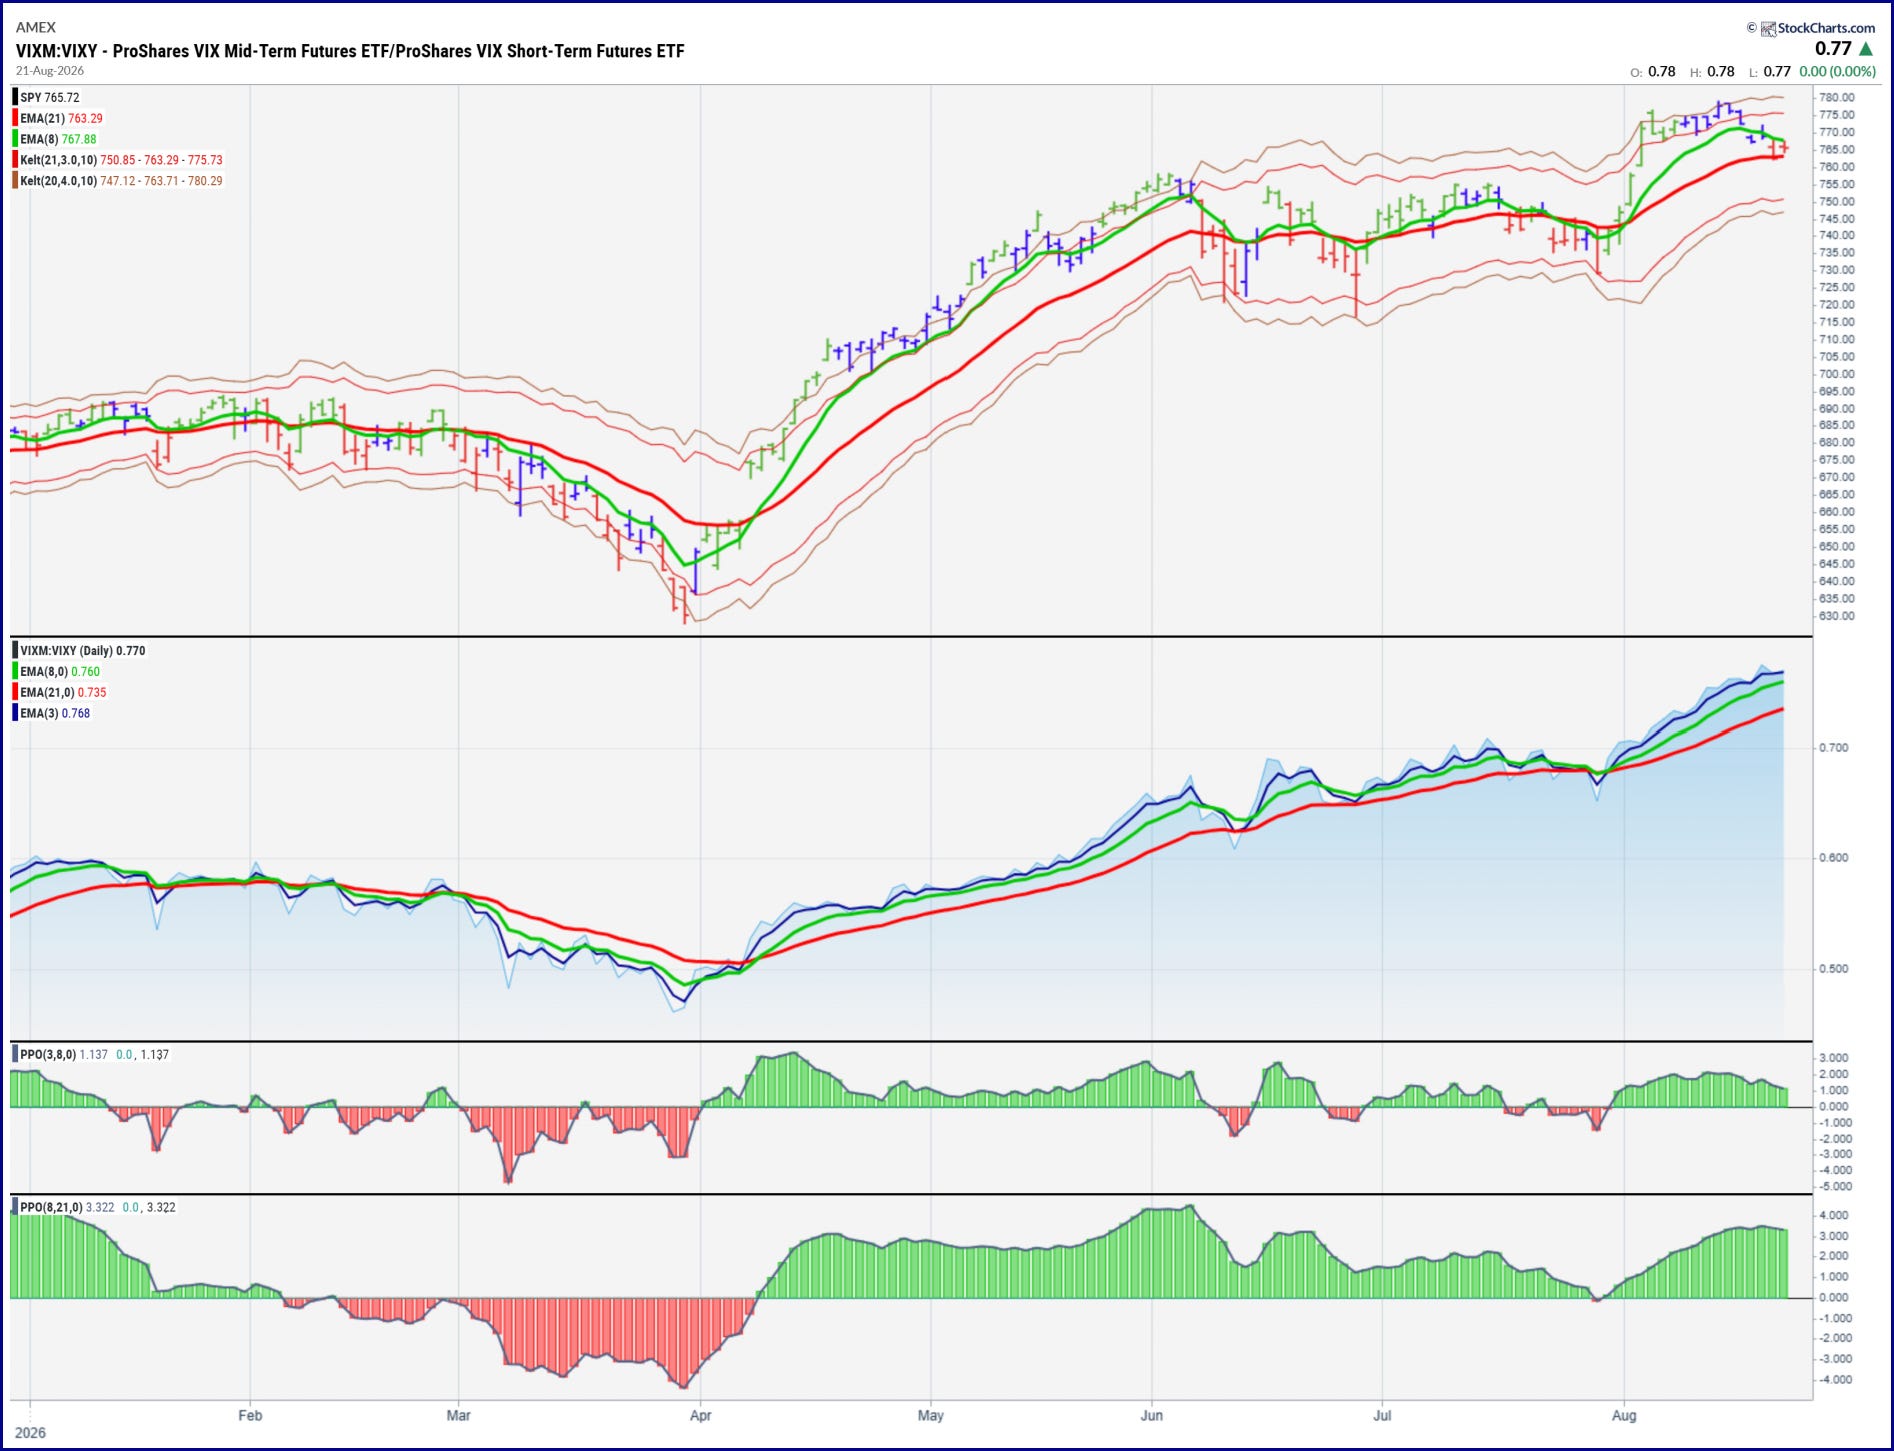
Our favorite barometer of the overall state of vol (VIXM:VIXY) ended the week in a risk-on configuration albeit with initial signs of deterioration that align with a down week for SPX.
As we prep for the last two weeks before Labor Day signals all hands back on the desk, I feel compelled to revisit the topic of the high yield credit market. Just a reminder that this should be thought of as a weather report rather than any kind of trading signal. With that caveat/disclaimer, behavior in the publicly-traded high yield market is decidedly risk-off while the trend for SPX continues to favor the bulls. While the history of this analysis only goes back to 2005, divergences such as the one seen at the right edge of the chart have reasonably foretold trouble for equity markets more than a few times. Pay attention or not.
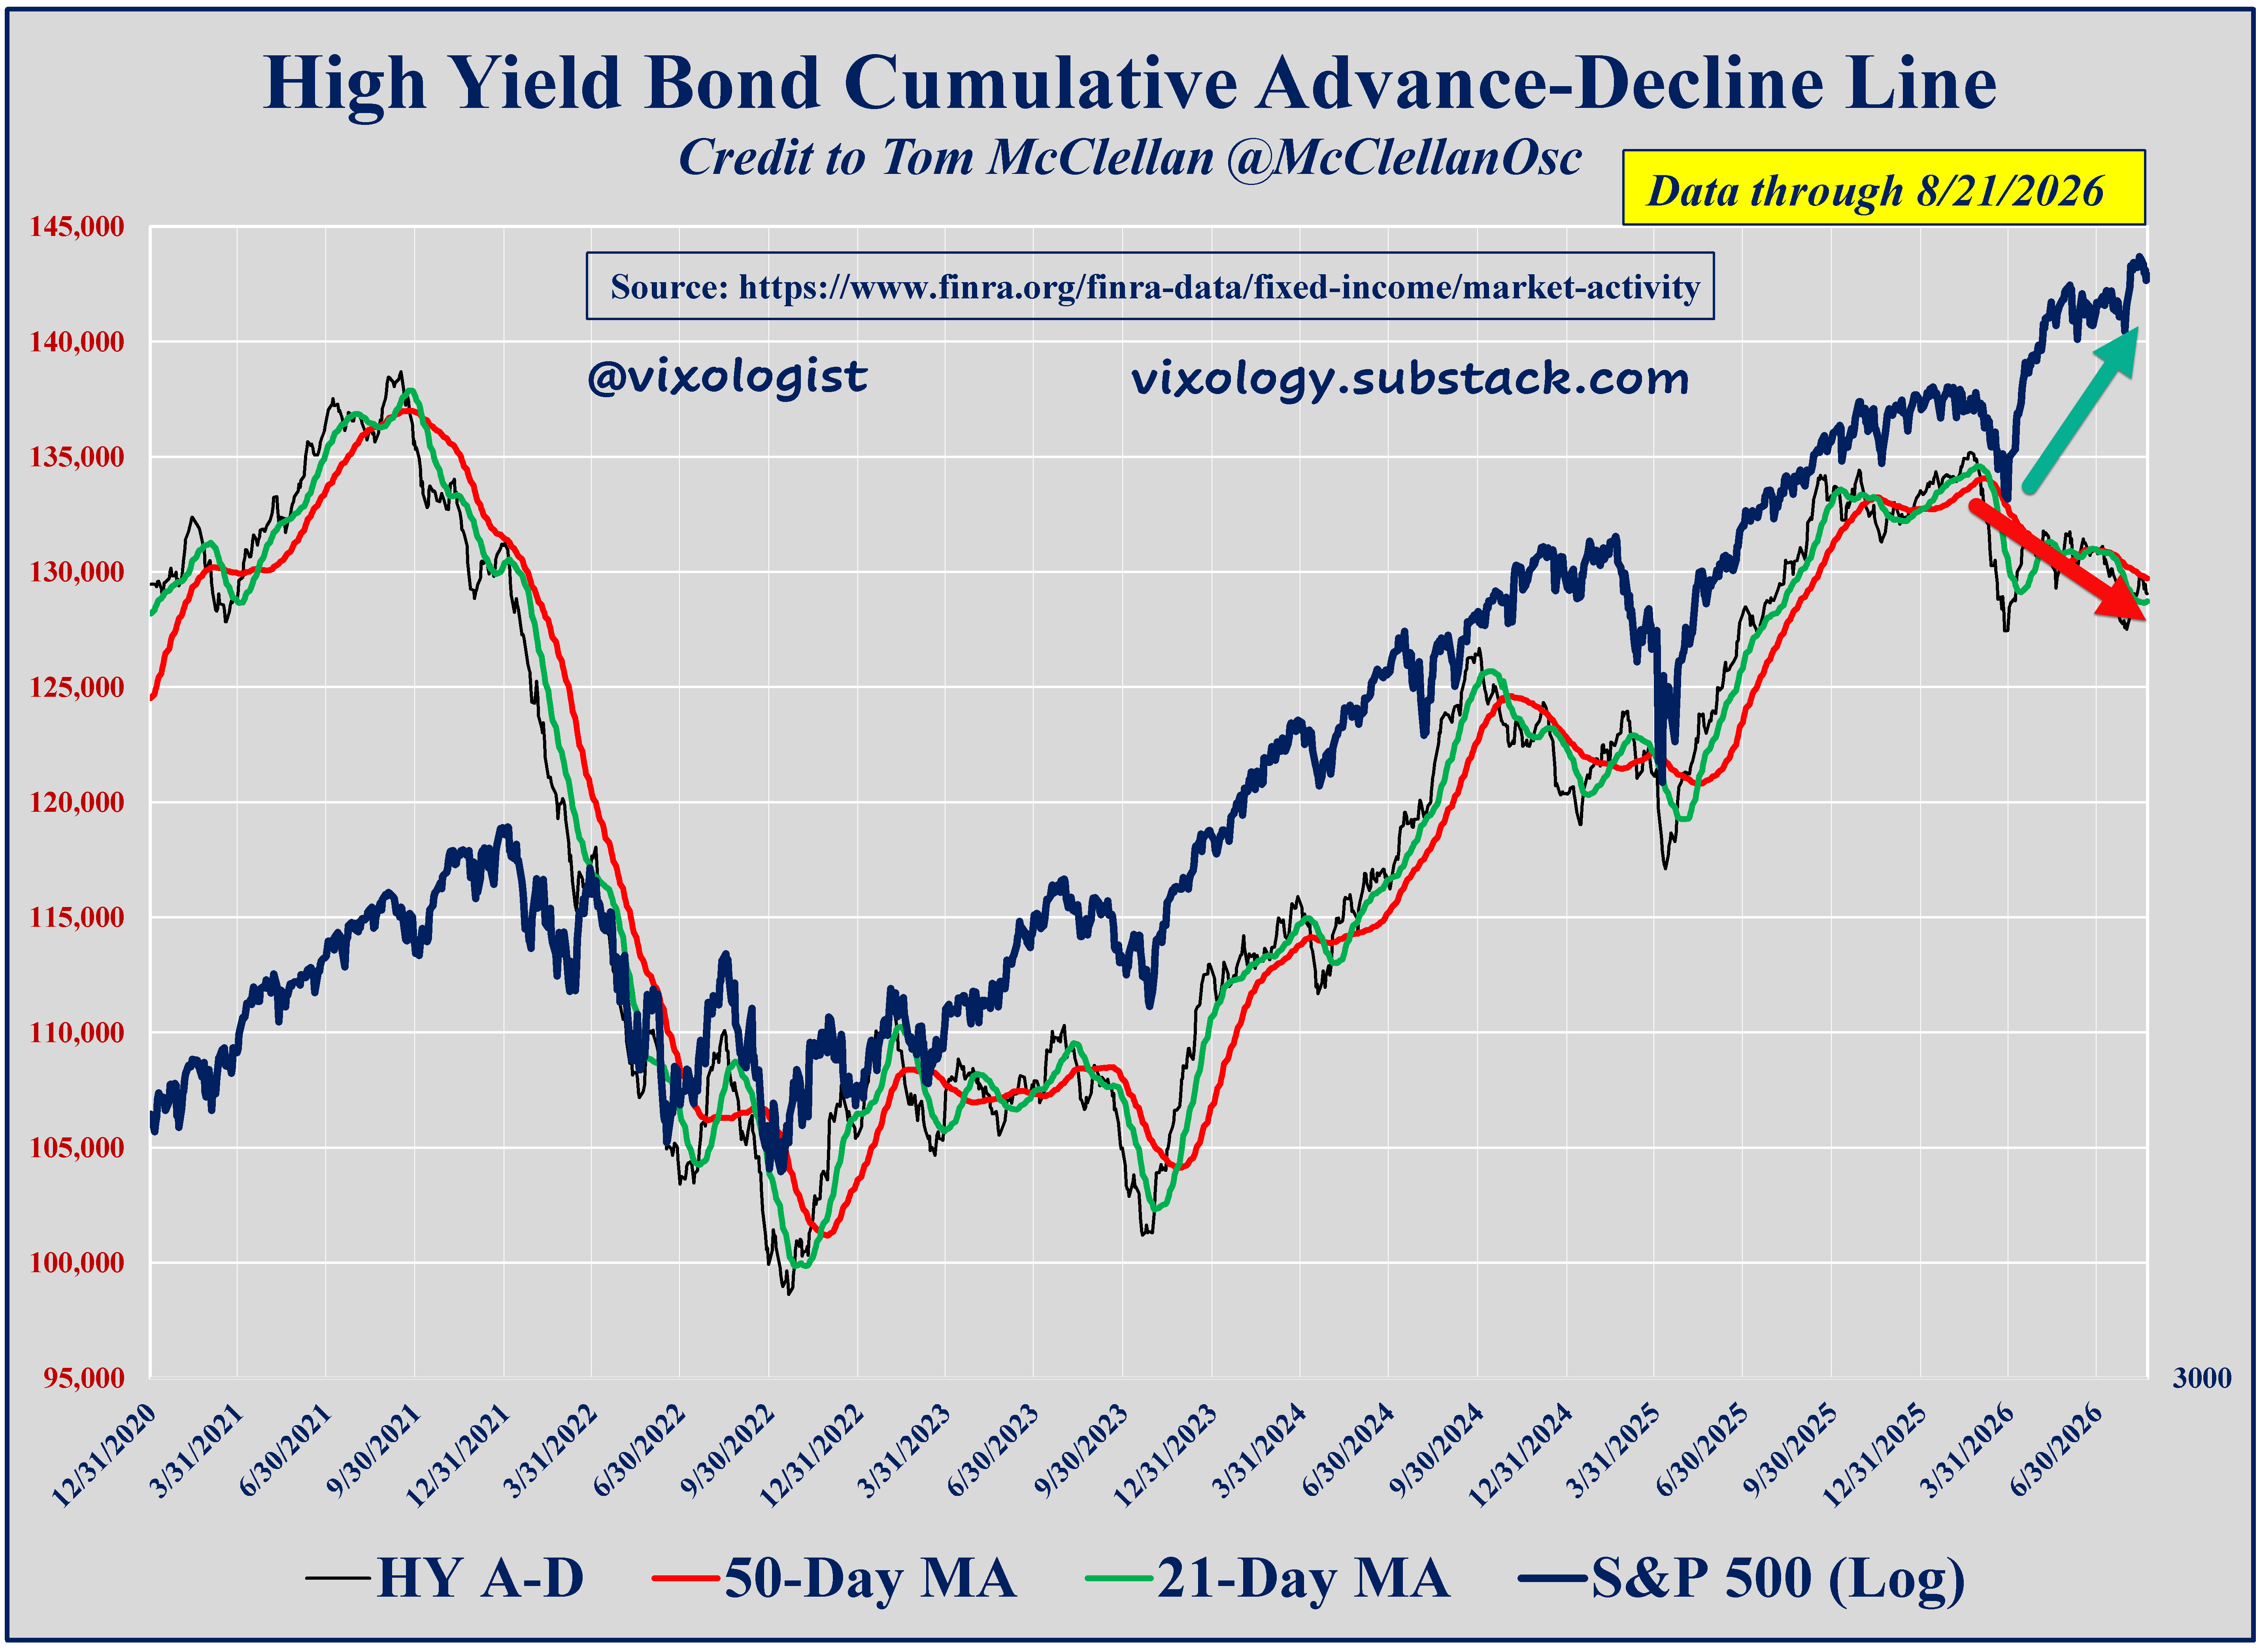
Just a heads-up that I will be heading to the hills of North Carolina the end of next week. Let’s see what happens with the markets and I’ll do my best to report what appears to be most important. Not much trouble is likely if VIX futures maintain contango and a decent premium to spot VIX. But I suggest paying extra attention to credit markets as they may be the source of a tipping point for equities.
All content presented here is for informational and educational purposes only. Distribution of any content to any persons other than the recipient is unauthorized. Furthermore, any alteration of content presented here is prohibited. By accepting delivery of this presentation, the reader agrees to the foregoing. Certain information presented herein has been obtained from third-party sources considered to be reliable, but there is no guarantee of completeness or accuracy and it should not be relied upon as such. There is no obligation to update or correct any information presented. Readers should not treat any statement, opinion or viewpoint expressed herein as a solicitation or recommendation to buy or sell any security or follow any investment strategy. This material does not consider the investment objectives, financial situation, or needs of any particular reader. Readers should seek advice from a qualified financial or investment advisor prior to making any investment decision.
No posts
Comments
Nothing yet. Say the first thing.
Sign in to join the conversation.