
f you’ve watched Apple TV’s Foundation, you’ve seen it. Hari Seldon stands before a floating cloud of golden particles — equations, probabilities, the mathematical fate of civilization rendered as living light. The Prime Radiant. The most beautiful data visualization ever put on screen.
I wanted to build it for real.
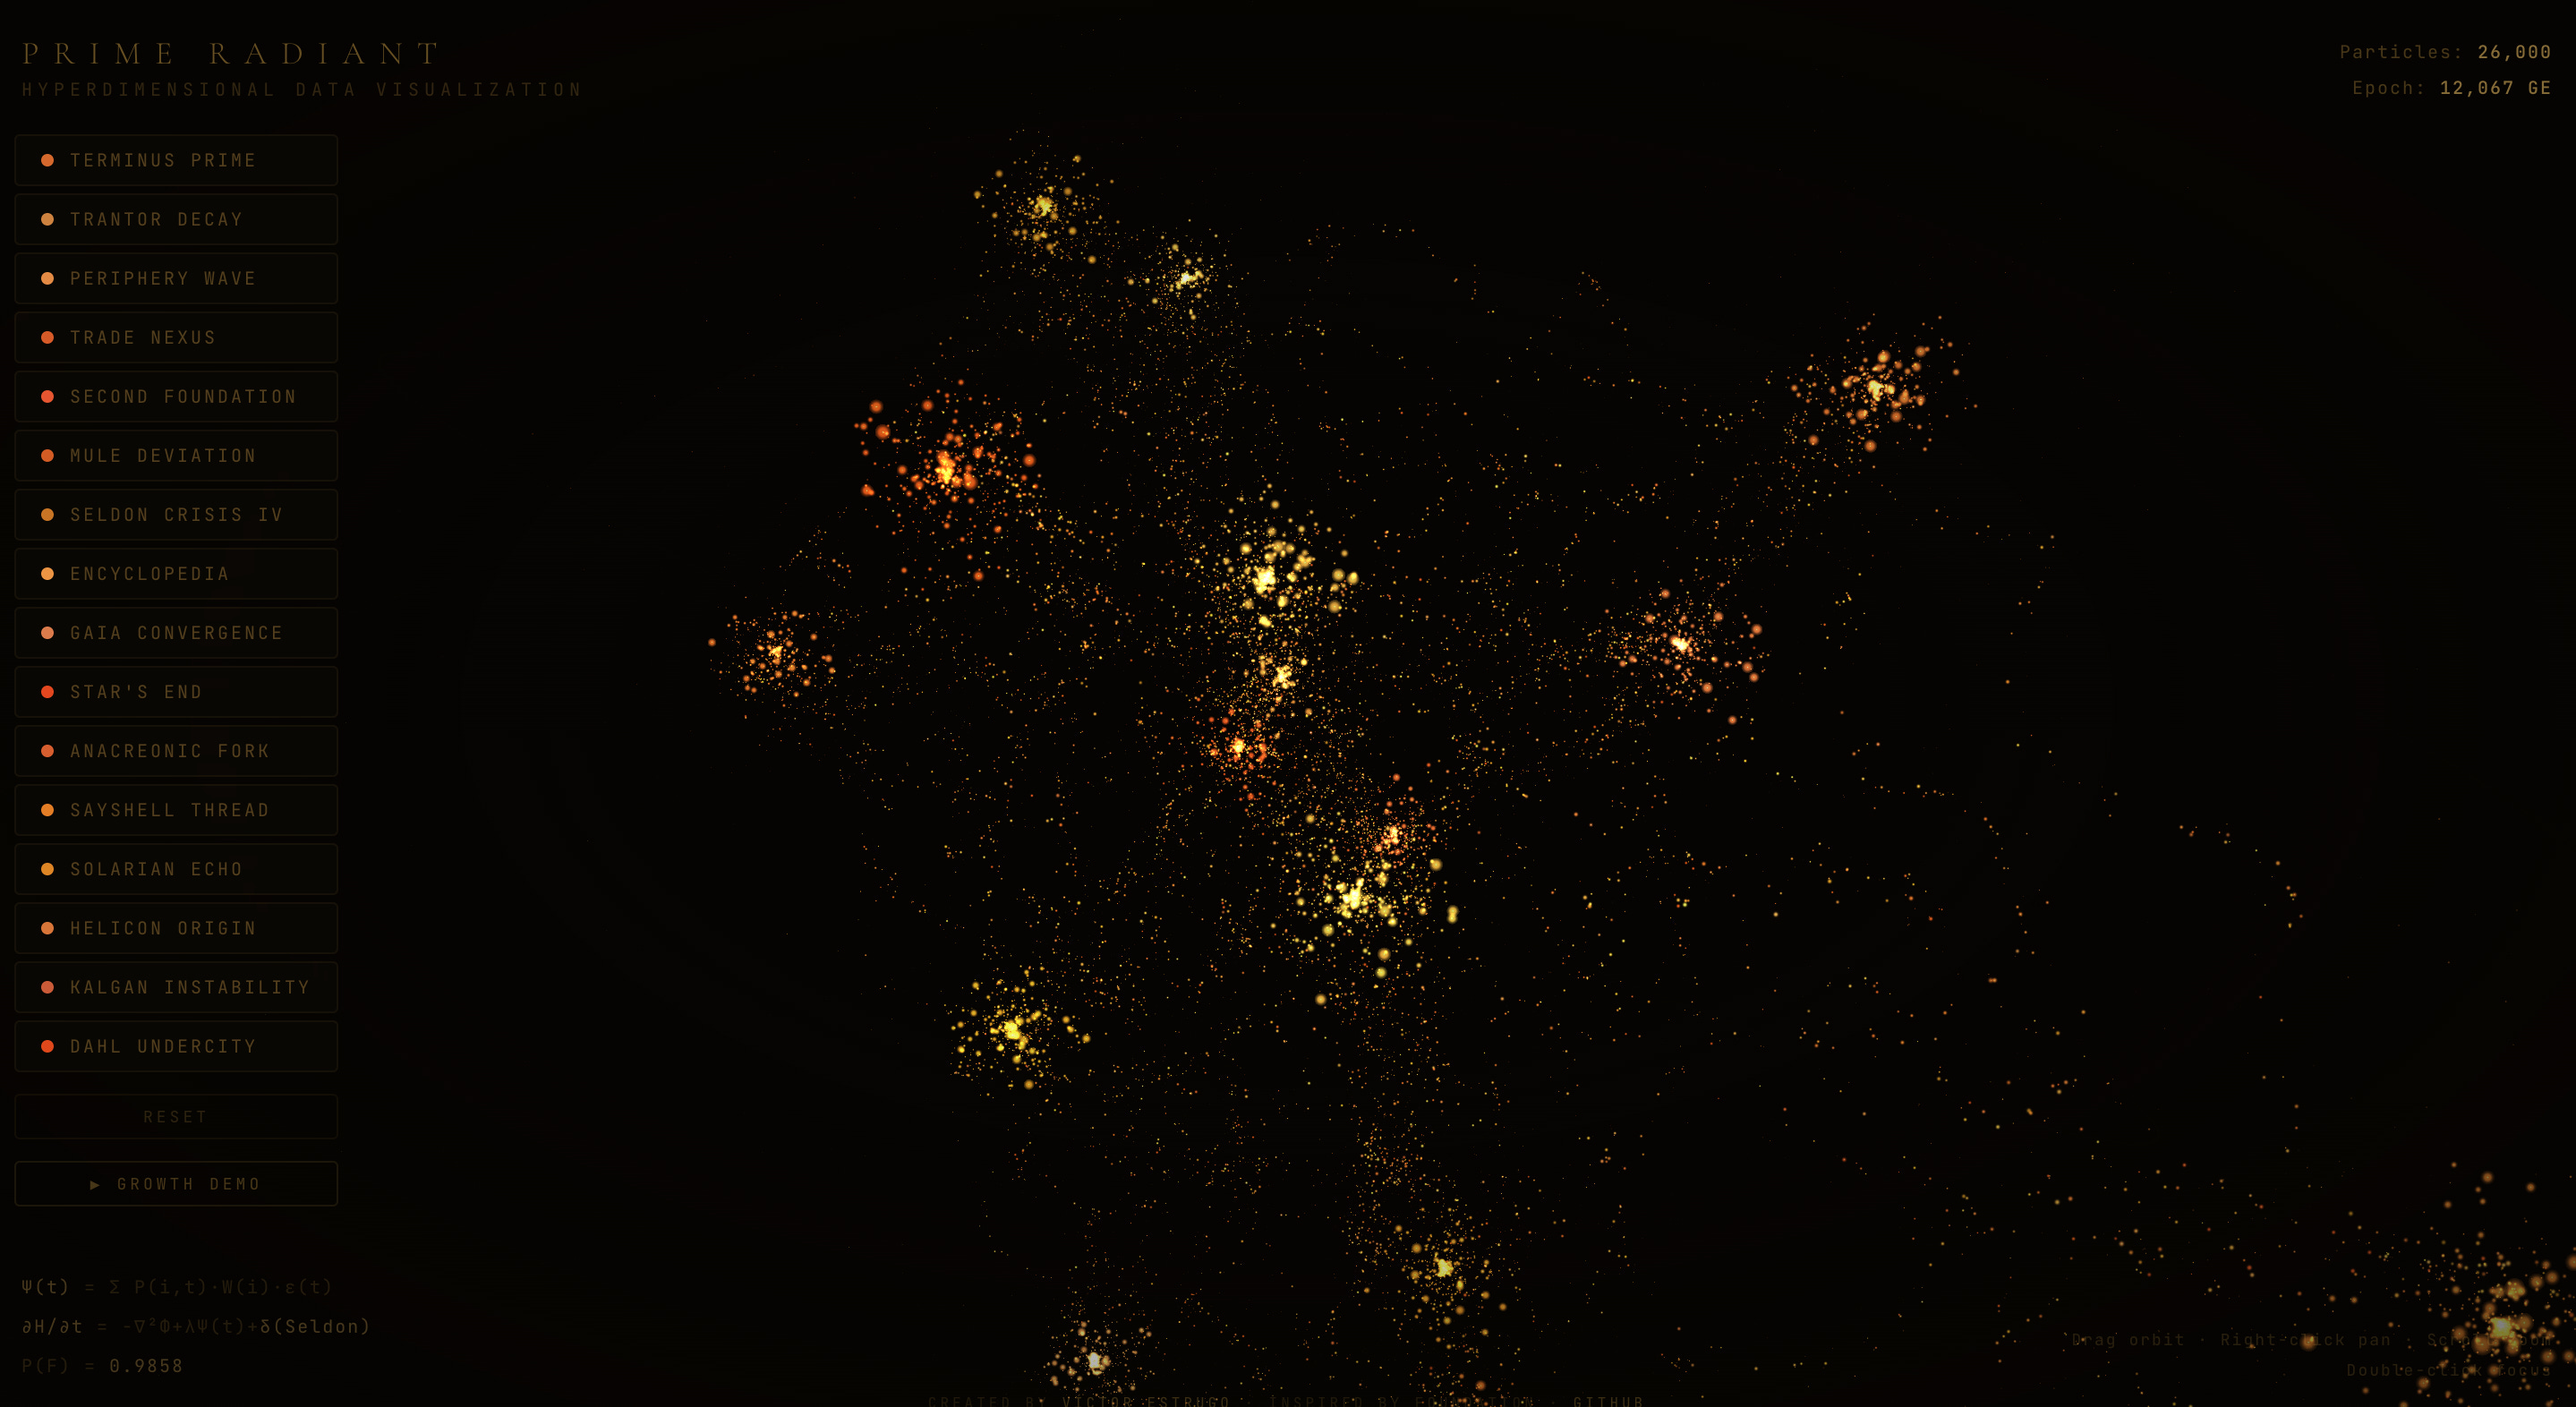
Not as a concept. Not as a mockup. As a working engine that runs in a browser, renders 32,000 particles in real time, and can be connected to any data source. Something you could point at Wikipedia’s live edit stream, or a geopolitical event database, or your company’s infrastructure topology, and watch the data breathe.
So I did. And now it’s open source.
Before writing a single line of code, I defined the constraints that would make this feel like the real thing:
No lines. Ever. The Prime Radiant in the show never has solid lines connecting things. Everything is particles — millions of them. Connections between nodes are visible only because streams of particles flow along them, like rivers of light between galaxies.
Everything moves. Nothing is static. Every particle has its own velocity, its own rhythm. The structure breathes. Particles swarm around their nodes with organic motion, like murmurations of starlings. Travelers flow along helical paths between clusters, occasionally jumping from one branch to another.
It has to feel hyperdimensional. A flat graph with nodes and edges is boring. The Prime Radiant transcends three dimensions. So the 16 data nodes sit on interlocking tori — two torus shapes rotated 90° from each other, plus a helix spiraling through the center. From any angle, you see depth, crossings, and structure that couldn’t exist in a flat plane. Like a tesseract projected into our space.
It opens like a ceremony. You don’t just “load” the Prime Radiant. You touch a sigil. Energy rings pulse outward. Then 32,000 particles materialize from a central point, expanding into the full structure over several seconds. The UI fades in after the data. Because the data comes first.
I’m not a graphics programmer. I don’t write GLSL shaders for a living. I’m someone who has spent two decades leading digital product teams and who deeply understands what I want something to look and feel like — but couldn’t have written a particle physics engine from scratch on my own.
I built this with Claude (Anthropic’s Opus 4.6) in a single session. A few hours from first concept to a working engine with 32,000 particles, custom shaders, and organic flocking behavior.
The process was iterative. I described the vision. Claude produced code. I ran it, saw what worked and what didn’t, sent screenshots back, and said things like “the particles are too big, they look like blobs, not stardust” or “the branches need to be multidimensional, they’re growing flat.” Over roughly 20 iterations we went from a basic node graph to the hyperdimensional living organism you see now.
This is what building software looks like now. The human brings the vision, the taste, the relentless iteration. The AI brings the technical execution at a speed that would have been impossible otherwise. Neither one of us could have done this alone.
The engine runs on Three.js with custom GLSL shaders. Every particle is a point sprite with adaptive glow — large particles have soft halos, small ones are sharp pinpoints. Additive blending makes dense clusters glow brighter without any explicit light sources.
The 32,000 particles break down like this:
5,500 core particles form dense, bright swarms at each of the 16 nodes
2,500 halo particles create a soft outer glow around each node
10,000 travelers constantly flow along helical connections between nodes
3,000 branch-static particles provide a dim backbone glow along each path
5,000 ambient dust particles fill the background atmosphere
6,000 reserve particles are available for growth demonstrations
Every connection between nodes is a helix — a spiral path that curves through 3D space with 1.5 to 3 full rotations. Not a straight line. Not a bezier curve. A helix. Because when you’re projecting from higher dimensions, straight paths don’t exist.
The flocking behavior uses individual per-particle parameters: home-strength (how tightly a particle orbits its node), swarm speed, and velocity damping. Core particles have high home-strength and stay compact. Halo particles have low home-strength and float freely. Travelers have zero home-strength — they follow helical paths and bounce or jump between branches at endpoints.
This is a visualization engine, not just a demo. The structure is data-agnostic. Here’s what I’ve been exploring:
Real-time data streams. I connected it to Wikipedia’s live edit stream (via SSE). Each edit spawns a particle that travels along the helical paths. You can watch global knowledge being created in real time, with clusters for different languages growing at different rates. English dominates. Japanese pulses in bursts. The “Other” cluster — Wikidata, Commons — never stops.
OSINT and geopolitics. GDELT publishes global events every 15 minutes. Plug that into the engine and each node becomes a region or conflict type. Travelers flow between them as events cascade. An escalation in one region visually ripples through connected clusters.
Network topology. Infrastructure, social graphs, supply chains — anything with nodes and relationships maps naturally to this structure. The helical connections make it possible to see paths that would be invisible in a flat graph.
Knowledge graphs. Research papers, patent citations, linked documents. Each cluster is a field. Travelers are cross-references. You can literally see interdisciplinary breakthroughs happening — they’re the bridges between clusters that light up.
Art. Just open it and look at it. It’s beautiful. People have told me they could stare at it for hours.
Because the best tools are the ones people can break apart and rebuild. The entire engine is a single HTML file. No build step. No dependencies to install. Download it, open it in a browser, and you have the Prime Radiant running on your machine.
Want to change the cluster names? Edit an array. Want different colors? Change the color generation function. Want to connect it to your own data feed? Add an EventSource and call the spawn function. The code is commented and structured for exactly this kind of experimentation.
MIT License. Do whatever you want with it.
→ Live demo — Touch the sigil. Drag to orbit. Scroll to zoom. Double-click a cluster to focus.
→ GitHub — Fork it. Break it. Build something new.
If you build something with it, I’d love to see it. Send me a message or tag me.
“The Prime Radiant can be manipulated mentally. It adjusts all the equations... in response to the changing conditions.” — Isaac Asimov, Foundation and Empire
The conditions are changing. The data is alive. Now you can see it.
Sin posts
Comments
Nothing yet. Say the first thing.
Sign in to join the conversation.