
Access New Property Insurance Data Tool
In April, I published two papers describing how property insurance is too expensive, and More Perfect Union just posted a great video explaining it. Today, we’re also releasing a new data tool that lets you see exactly how much insurers may be overcharging in your state, drawing on 25 years of insurance regulator data across every state and five major insurance lines.
Everything from auto and homeowners’ insurance to workers comp and liability insurance has become more expensive than necessary. Property insurance is one of the few markets where the government has veto-power over the prices and yet state insurance regulators have allowed the costs to creep up to $1.1 trillion per year. That’s twice what people pay for all utilities combined, so this is a major part of the overall affordability crisis. And it’s not just consumers who pay – businesses across the country are being price gouged too. Insurance is one of the biggest costs for restaurants and small businesses, and a major cost for developers building affordable housing.
The reason prices are so high is simple. Insurers are charging more than they need to cover losses from actual claims, generating extra revenue to pay for wasteful spending on dividends, stock buybacks, excessive advertising budgets and high agent commissions, private jets, and other expenses.
I recently wrote a post on how we can use private jets as the canary in the coal mine – if property insurers are wasting a quarter billion dollars every year just so their execs can fly comfy, what else are they wasting money on?
In addition, ask yourself, why is it that you’ve rarely seen a single health insurance ad, but every other ad you see has the Geicko Gecko, the Limu Emu, Jake from State Farm, Flo from Progressive, Mayhem from Allstate, or J.K. Simmons trying to sell you property insurance?
And in 2025 alone, Progressive spent $15 billion on stock buybacks and dividends. That’s 18% of the premiums Progressive collected that year.
But these are just anecdotes. Today I’m releasing THE DATA. The National Association of Insurance Commissioners (NAIC) releases “loss ratio” data every year, state-by-state, insurance-type-by-insurance-type, and even company-by-company.
Access New Property Insurance Data Tool
A loss ratio can tell you how efficient an insurer is. For example, a 75% loss ratio means for every $1 in premiums collected, the company pays $0.75 in claims. That’s pretty efficient. Health insurance loss ratios are 80-90%, in part because it is legally required under the Affordable Care Act. A 65% loss ratio on the other hand, means for every $1 in premiums, the company only pays out $0.65 in claims, meaning it is spending an extra $0.10 on something else. Those extra dimes per dollar add up to A LOT when we’re talking about 1.1 trillion dollars.
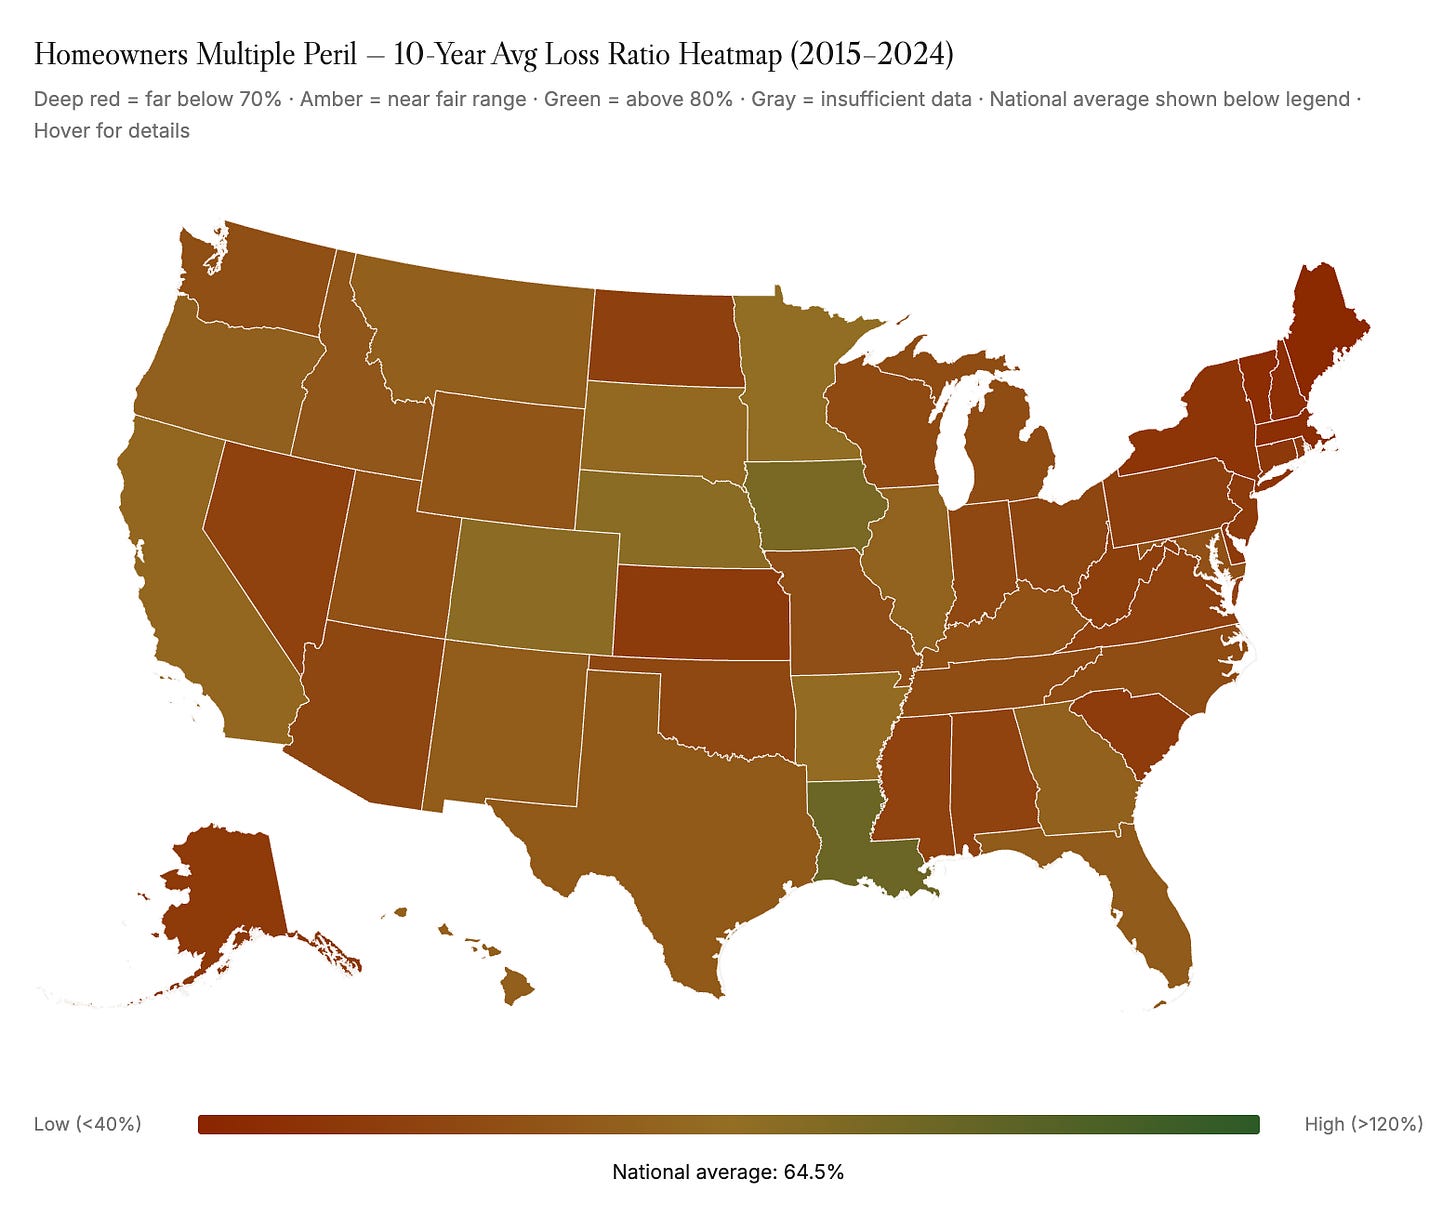
I compiled the NAIC data into a data visualization tool that includes each state’s loss ratio data for the biggest 5 insurance types (homeowners, auto, workers comp, commercial peril, and commercial liability) going back 25 years (2000-2024). You can use this tool to see how your state stacks up. Of course, my thesis is that we are all getting price gouged, nationwide. But the lower your states’ loss ratios, the worse it is.
Looking at the data, here are the 5 states with the worst over-charging problem in these insurance markets. I’m using 10-year averages to rule out specific loss events as the cause for any one state’s poor performance.
Homeowners: Maine (41.4%); Vermont (44.2%); Massachusetts (44.9%); New Hampshire (45.7%); New York (48.7%); national average (64.5%)
Consumer Auto: Vermont (58.7%); New Hampshire (60.2%); Hawaii (60.6%); West Virginia (60.9%); North Dakota (61.6%); national average (68.3%)
Workers’ Comp: Washington, DC (36.6%), Michigan (38.9%); Delaware (39%); Texas (39.2%); West Virginia (40.8%); national average (50.9%)
Commercial Peril: Vermont (35.7%); Delaware (37.2%); Maine (39.7%); New Hampshire (41%); Virginia (42.3%); national average (57.7%)
Other Liability: Wyoming (36.4%); South Dakota (37.2%); Arkansas (37.3%); Maine (39%); Idaho (44.1%); national average (61.6%)
There are a few notable patterns.
First, the Northeast has a big homeowners insurance problem. The 5 worst states are all in the Northeast. Looking at the top 10 worst, 8 are in the NE. There isn’t a single NE state that is above average. This is the starkest geographic pattern I could see in any of this data. These states have lax price laws, which is probably the main culprit. But other states have weak laws, so it might also be a result of relatively low storm-risk and, perhaps, something about the regulatory and business culture. Regardless, if you live in the NE, you’re getting price gouged on homeowners insurance.
Second, purportedly business-friendly Delaware isn’t friendly to businesses struggling with insurance bills. Sometimes we assume “pro business” and “anti-regulation” are the same thing. Nothing highlights this fallacy more than price regulation of property insurance because every business pays for insurance, usually many times over. Even insurance companies get insurance (it’s called re-insurance, and they are price gouged too!). Delaware’s workers’ comp and commercial peril insurance markets -- exclusively business insurance lines -- are among the most over-priced in the country.
Third, smaller states are being overcharged more. Insurers have more leverage over state insurance commissioners in smaller states. When insurance commissioners resist price increases, insurers will often threaten to leave the state. That threat is pretty empty in a state like California or Texas, but in a state like Vermont, it’s perhaps more realistic because it would require a smaller hit to the national insurance entity’s bottom line. Smaller states might want to consider some public options to offset this problem, or support a federal loss-ratio floor as I’ve proposed.
Fourth, certain bigger states have oddly bad prices. We should expect the four mega states of California, Texas, Florida, and New York to use their leverage to stay far from the bottom of these lists. For the most part they are. But New York’s homeowners’ market is 5th worst and Texas’s worker’s comp market is 3rd worst. The insurance commissioners in those states should get to work bringing those prices down.
Fifth, Iowa and Louisiana might be underpriced in peril insurance. I want to be fair here. My thesis is that prices are too high on average in all insurance lines. But looking at the 10-year averages, the loss-ratios in homeowners and commercial peril insurance specifically are arguably too high in Iowa and Louisiana. These are the insurance lines most vulnerable to climate change-related losses, and these are two states heavily exposed to climate change -- Louisiana to hurricanes and Iowa to hail storms. The prices in these states are too high for consumers like everywhere else, but in these two insurance markets in these two states, the insurance industry actually isn’t collecting enough to cover claims long-term. The only other place where I see this issue is Nevada’s commercial liability insurance market.[1] I have no idea what’s going on there, but it’s probably not a climate change story.
The tool only has data up to 2024. The data for 2025 isn’t fully out yet, but it’s coming soon, and what we do have suggests the problem is continuing to get worse. Overall loss ratios went down by 5% in 2025. In fact, while I was previously focused on excess overhead as the main explanation for the high prices, it’s starting to look like profits are becoming a bigger part of the puzzle. We can now see that in 2024 and 2025, profits sharply spiked. In 2022, total profits were $39 billion. That doubled to $88 billion in 2023. Then it doubled AGAIN to $167 billion in 2024. And profits stayed high at $150 billion in 2025.
The very little data we’re starting to get from 2026 suggests the trend is continuing. Loss ratios are at least 5% lower in Q1 2026 than it was in Q1 of the prior 4 years. And the industry made more profits in Q1 2026 than Q1 in any of the last 4 years.
Having spent a lot of time in this data, I think there are three high-level stories that explain how we got here. First, if you go back 50 years in the data (see data in the appendix), what you see is decades of negative “underwriting profit” but positive total profit. The industry used to lose money on the insurance product, but make those losses up and then some by investing the premiums (plus tax write-offs from those losses).
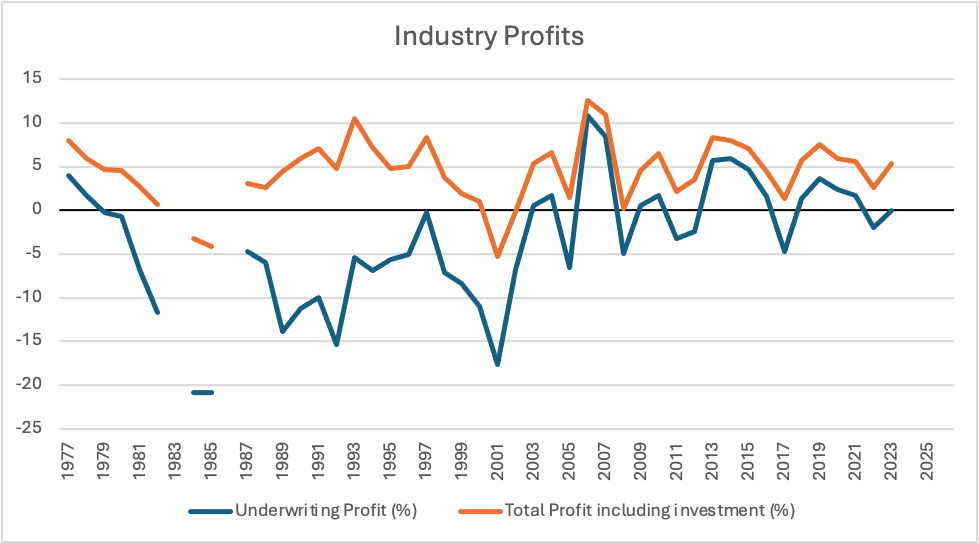
But after taking huge losses from the events of 9/11, the industry reset. They didn’t increase prices to get back to the status quo of reasonably negative underwriting profit. They convinced regulators that they needed to go further and make not just a total profit, but positive “underwriting profit” too. From 1979 to 2002, the insurance industry took underwriting losses every year. From 2003 on, they’ve taken negative underwriting profit in only 6 years. The investment returns also got more conservative at the same time, which is why you see the underwriting profit and total profit get closer together. That’s a clear shift.
The second theory is about the non-loss expenses. If you go back 50 years, the percent of premiums spent on general expenses and selling expenses is remarkably unchanged.
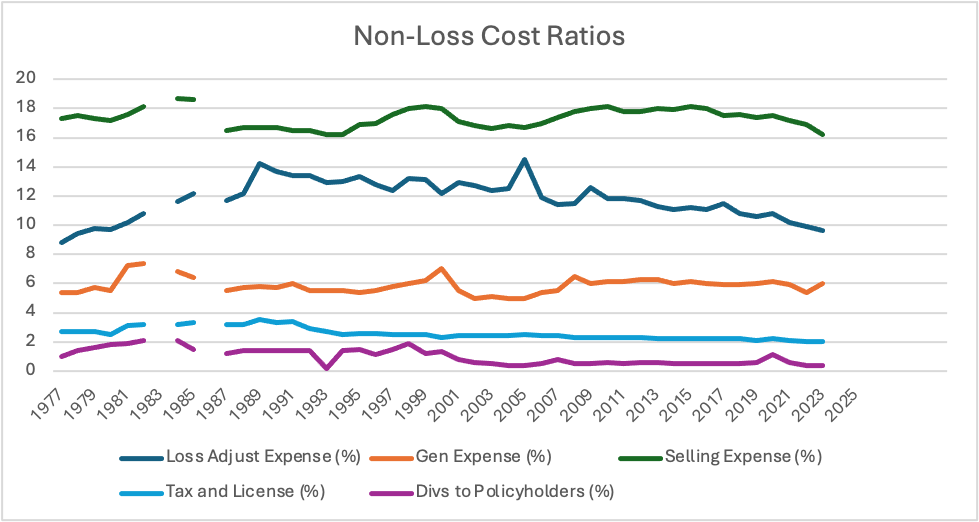
You might think that means the industry is as efficient as it’s always been. But you’d be wrong. Since 1990 the premiums collected quadrupled (controlling for inflation, doubled). Whether that is because of increased lawsuits or climate change or just the fact that America is insuring more risk, what matters is we collectively spend twice as much (after adjusting for inflation) today as we did in 1990 on property insurance.
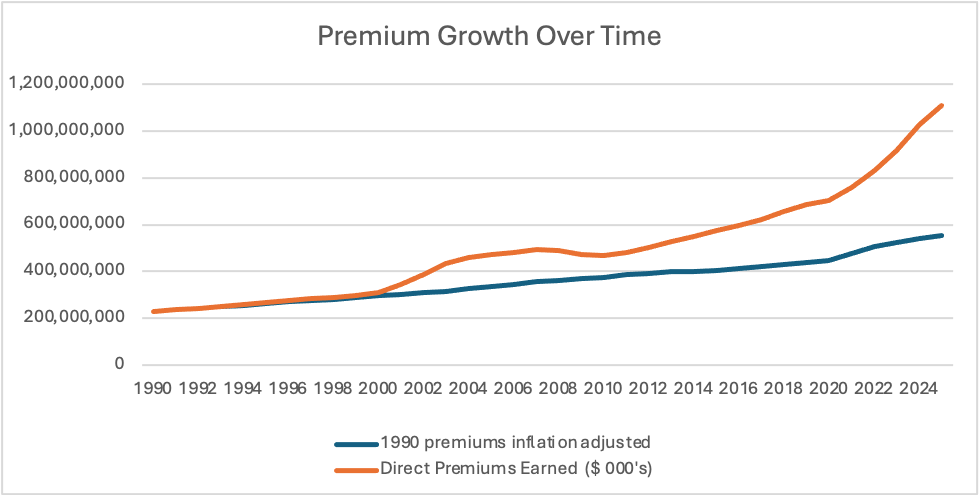
Insurance companies spent 22% of the premiums on ads and referral fees and overhead in 1990, and 22% of the premiums on ads and referral fees and overhead in 2023. But if you double your revenue, does that really mean you have to double your ad budget or double your spending on employees or office space? If you used to have 2 private jets, and you double your revenue, does that justify buying 2 more? It doesn’t, because as your revenue grows, these mostly fixed costs should become a lower percentage of your overall cost. That is basic economies of scale. These percentages should have been going down the whole time as premiums increased faster than inflation.
I think this happened because insurance rate filings are all conducted on a percentage basis. Insurance companies convinced insurance commissioners that last year’s expense ratio was reasonable, expressed as a percentage, and so it should be carried over to next year. And then they did it again and again and again. Spending 22% on overhead, advertising, and referral fees in 1977 meant spending $15 billion on those things ($78 billion in today’s dollars). But spending 22% of premiums in 2025 means spending $242 billion. We’re here because insurance companies and insurance commissioners didn’t adjust the share of premiums that goes to overhead downwards as premiums increased.
The third, is much more recent. We are currently in the middle of a massive shift towards more profits for the insurance industry. Just since 2024, we are seeing astronomical profits like nothing we’ve seen in a long time. In the last 5 years, the industry got really aggressive in demanding price increases from insurance commissioners. They argued they needed huge price increases due to tort liability (which isn’t new, but is suddenly a “crisis”), climate change, inflation, or other reasons. And they’ve gotten those price increases. But losses didn’t actually go up in the last couple years, so they’re pocketing the difference. Some of that is because inflation slowed mid 2023. Some of it is because the tort liability crisis was fake to begin with, designed to justify price increases or feed tort reform efforts that would lower insurers’ losses (without requiring a drop in prices). But some of that is luck – despite the climate driven long-term trend, losses barely increased in 2024 and actually went down in 2025 and 2026 (so far). Even when the long-term trend is bad, sometimes you get a few good years. But instead of rebating the excess back, or even just saving the money in surplus funds for future bad years, the industry sent it to investors and kept asking for more price increases.
Appendix:

Source: NAIC Profitability Reports; 2024 Data from NAIC; 2025 Data from NAIC; Blacked out rows are years where NAIC has not published a profitability report. Profitability Reports for 2024 and 2025 are not yet out, but preliminary data suggests very high underwriting profit.
[1] Wyoming and Washington have high workers’ comp loss ratios. But that is because both states have public insurance plans that serve the vast majority of those state markets.
No posts
Comments
Nothing yet. Say the first thing.
Sign in to join the conversation.