
XRP is currently holding right around the $1.00 level after grinding lower over recent months, sitting a little more than 70% off its all-time highs.
Back on April 1st, when I shared that analysis, XRP was trading near $1.50, and I explained there was a high probability we would see much lower prices from there, and that is exactly what has played out since. As seen in the chart below from April 1st.
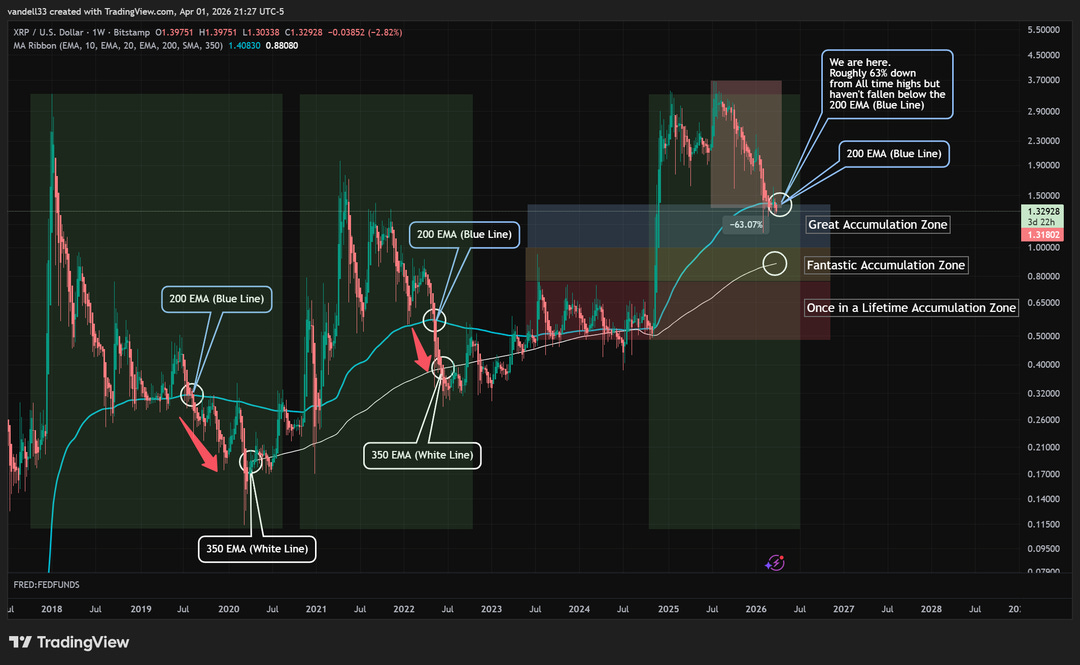
In that same update, I pointed out that every prior XRP bear market eventually took price below the 200-week EMA and SMA and at least touched the 350-week SMA. That longer-term average is currently sitting near $0.94, which would represent roughly a 74% drawdown from the highs if we get there. Here’s what’s extremely important to understand.
Comments
Nothing yet. Say the first thing.
Sign in to join the conversation.