
One of the clearest signals from the previous bull market was when XDC crossed above and closed above its 30-week simple moving average with strong price action and expanding volume.
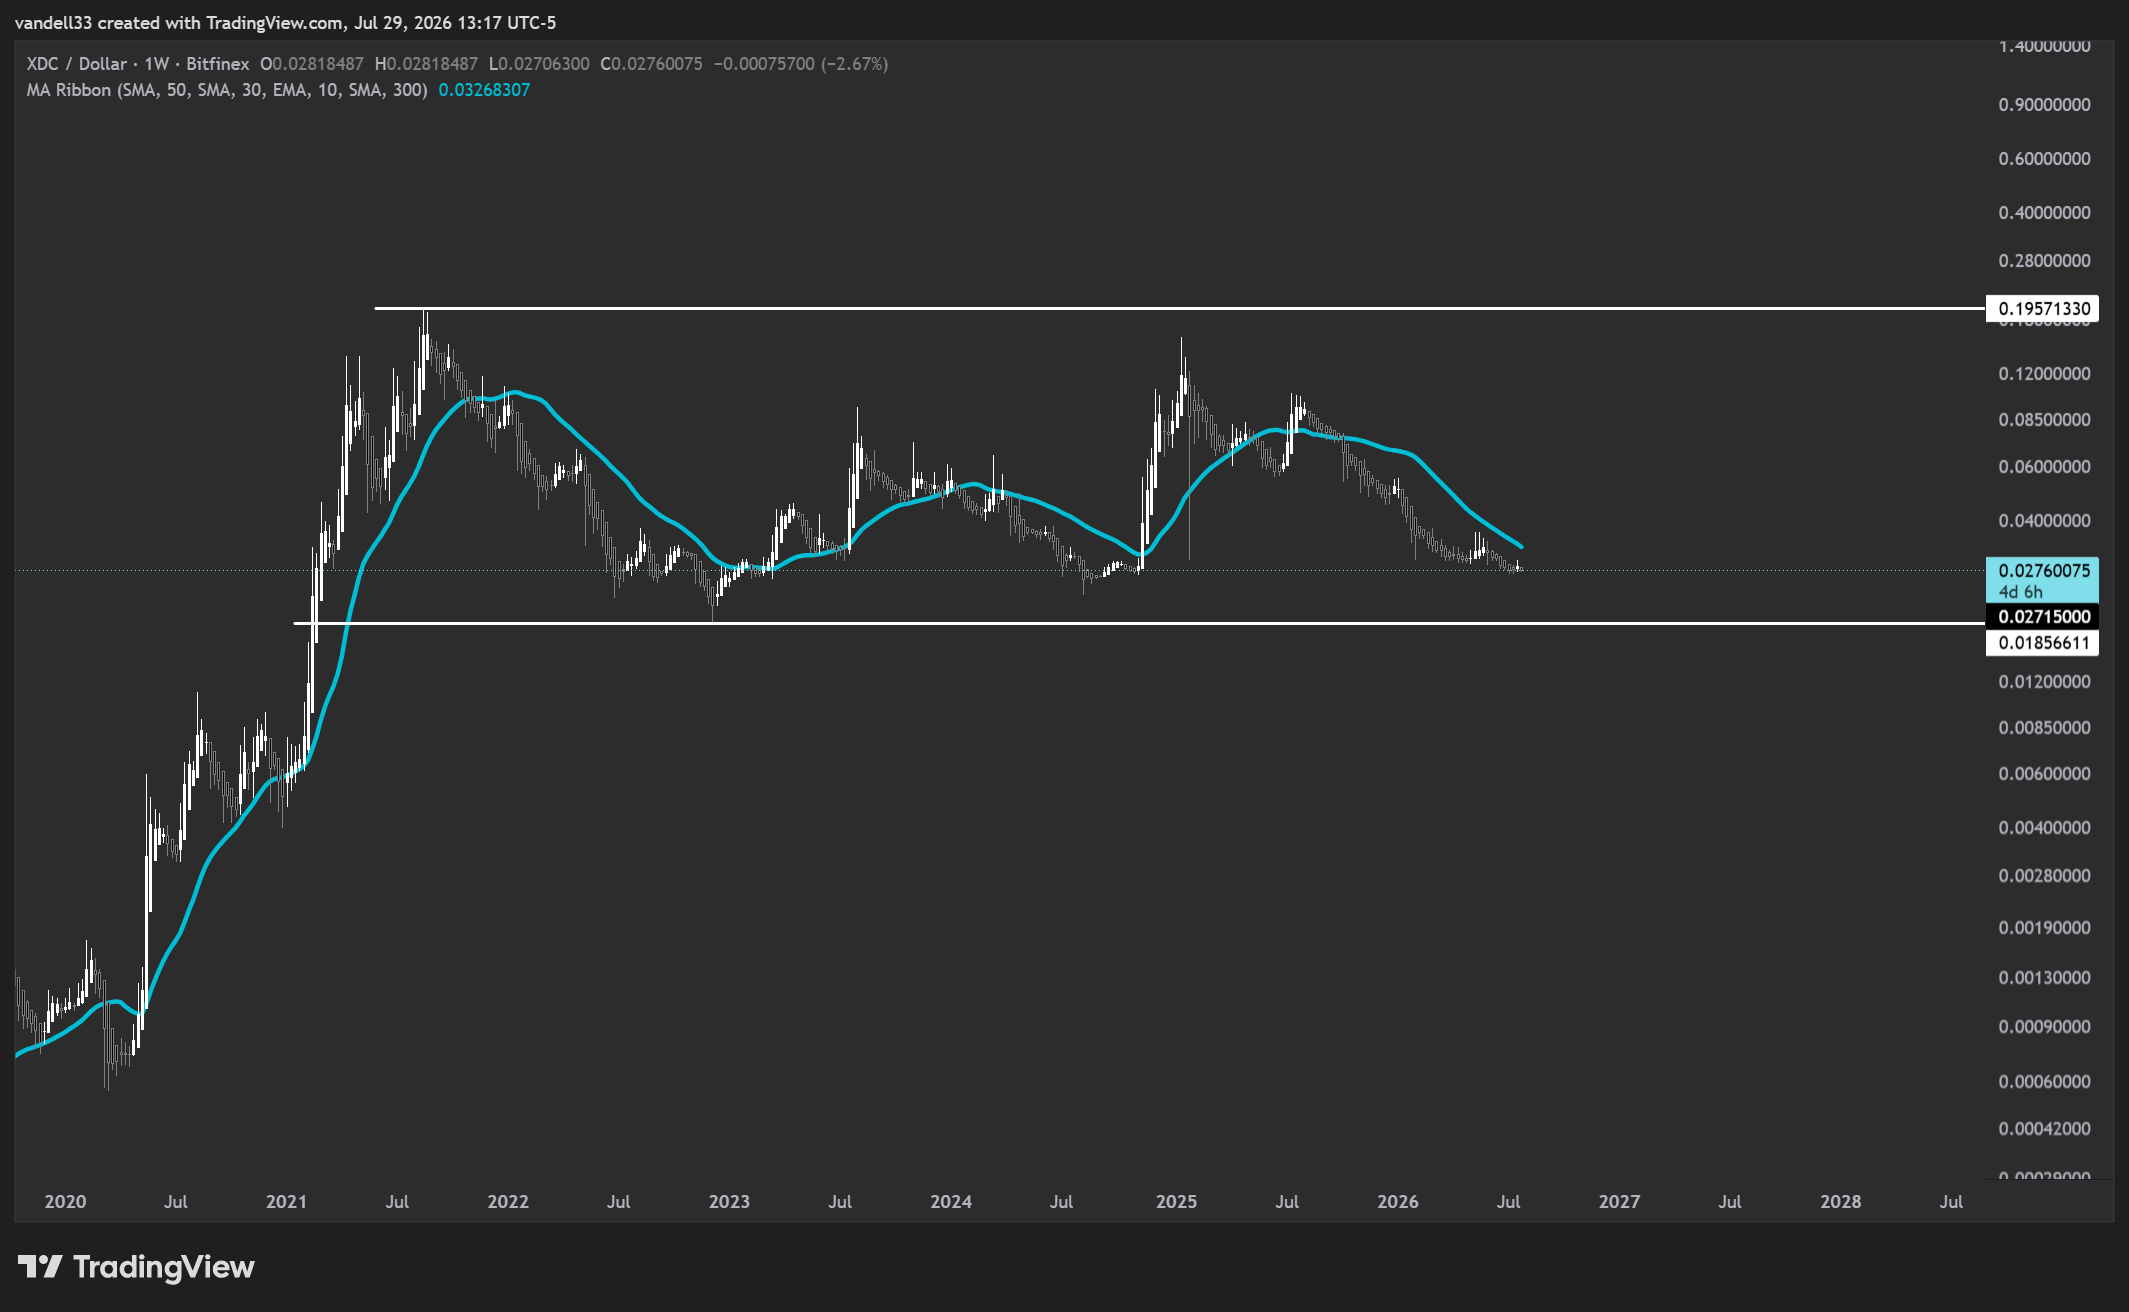
The 30-week moving average is equivalent to a 150-day moving average, just so you all know. This gives us a sense of the overall direction of the market and trend.
From that point, price broke above the 30-week SMA until it eventually broke back below and closed beneath the 30-week moving average, XDC appreciated by more than 11,000%, as seen in the blue zone. By traditional financial market standards, that type of move is extraordinary.
Comments
Nothing yet. Say the first thing.
Sign in to join the conversation.