
Most animals sleep to keep their brains from going haywire. I’ve found that market closes often have a similar effect on my psyche. When markets reopen in the morning, they rarely open where they left off. Things happen while you sleep, a fact occasionally lost on those who believe they’re the center of the universe.
In finance, this gap creates a famous anomaly: The Overnight Effect. We’ve covered it here before, and Matt Levine recently brought it back into the spotlight. The lesson most discovery-minded investors learn the hard way? Monetizing this gap is incredibly difficult. While the effect has diminished in the S&P 500, other markets continue to show surprising resilience, at least on paper.
A History of "Bad Timing"
Two famous attempts to capture this alpha, the NightShares 500 (NSPY) and NightShares 2000 (NIWM), launched in 2022 and were shuttered just a year later. As Robin Wigglesworth noted in the Financial Times, e.g. here and here.
“In practice, the anomaly is impossible to easily exploit because of trading costs (liquidity is much lower overnight, and one-day holding periods would make it a high-turnover strategy). The NightShares ETF has actually lost almost 6 per cent over the past year, compared to the US stock market’s 18 per cent gain.”
But was the strategy flawed, or was the timing just atrocious? Depending on whose backtest you trust, and how crafty your momentum filters are, the strategy remains a point of obsession for quants.
Enter the "AfterDark" ETF
The conversation is heating up again with the launch of the Bitcoin and Treasuries AfterDark ETF (BTAD). As Matt Levine noted, Bespoke Investment Group recently highlighted a striking disconnect in Bitcoin’s return profile. At the time of their analysis, they found that since the IBIT launch:
Overnight Price Gaps: ~200% Gain
Buy-and-Hold Strategy: ~40% Gain
Intraday (Open-to-Close): -50% Loss
The fund, managed by Nicholas Wealth, takes long Bitcoin exposure via swaps at 4:00 PM ET and exits by 9:30 AM ET the following morning. During the US day, the fund rotates the cash into short-term Treasuries, which serve the dual purpose of harvesting a risk-free yield and acting as collateral for the overnight swaps.
The Theory vs. The Data
To see how this looks in the wild, I ran the numbers using Binance 1h candles. I entered the trade at 4:00 PM ET and exited at 9:00 AM ET (30 minutes earlier than the ETF, but a halfway robust strategy shouldn't care about a 30-minute window).
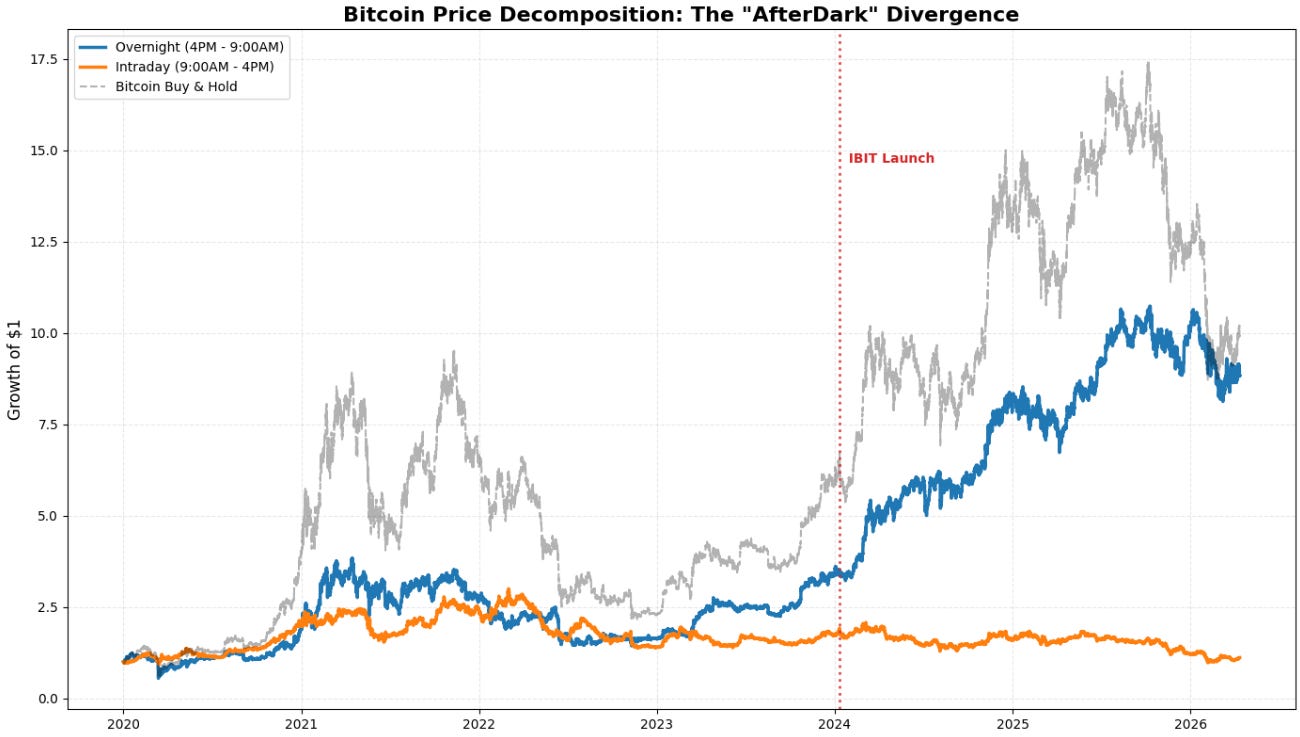
The cumulative overnight return is shown in blue, intra-day return in orange and total return in grey.
=== PRE-ETF PERFORMANCE (2020 - Jan 2024) ===
          Ann. Return Ann. Volatility Sharpe Ratio Total Return
Overnight      23.79%          46.13%         0.52      247.51%
Intraday       11.39%          31.98%         0.36       87.70%
Total_BH       38.79%          55.04%         0.70      577.64%
=== POST-ETF PERFORMANCE (Jan 2024 - Present) ===
          Ann. Return Ann. Volatility Sharpe Ratio Total Return
Overnight      34.01%          28.58%         1.19      160.11%
Intraday      -14.97%          29.13%        -0.51      -41.12%
Total_BH       14.42%          39.83%         0.36       55.25%
The takeaway? The overnight session has always carried the water, but the trend has intensified significantly since the spot ETF launch. Post-January, the overnight Sharpe ratio (1.19) is miles ahead of the intraday "grind." Judging from the chart, it seems that the stronger dispersion even started before the ETF launch, early 2023.
Of course this is highly theoretical and as we’ve explored in our post about the night effect in SPY, slippage and transaction costs easily destroy the overnight attractiveness. The AfterDark ETF is leaving us a bit in the dark regarding costs (besides the 0.95% TER) and just mentions that it uses swaps to generate the overnight return. Instead of making assumptions about potential costs I decided to take a look at the NightShares ETFs. How much did they actually stray from the theoretical overnight return during the brief period they were alive?
Below is a chart showing the theoretical overnigth performance of each strategy (SPY and IWM overnight) in blue vs the theoretical performance net TER of the ETFs (yellow) as well as the actual performance of the respective NightShares ETF (red).
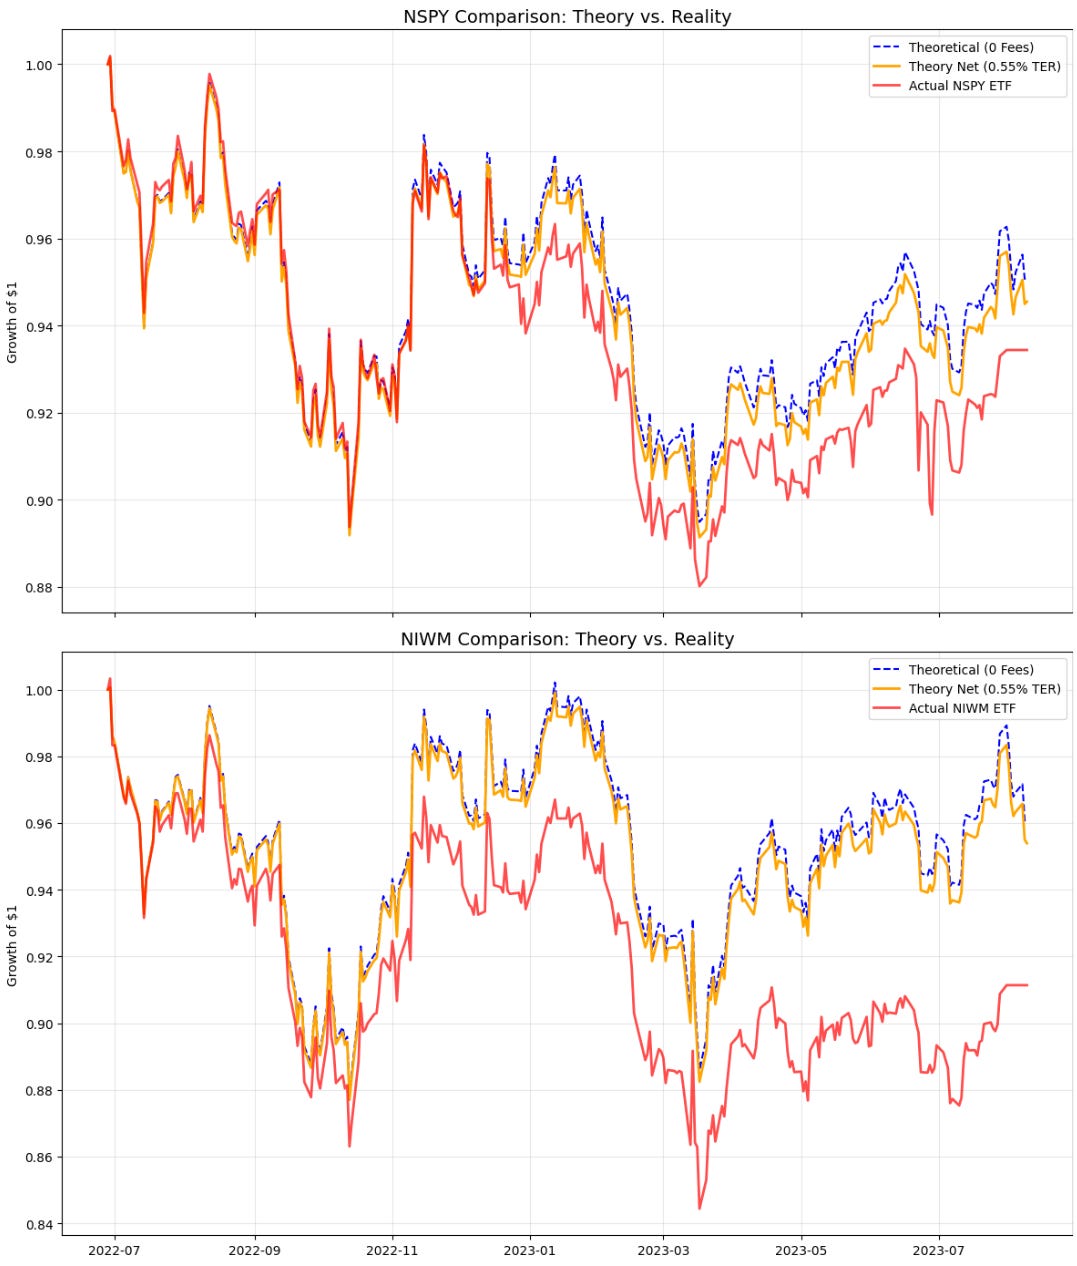
Back in July 2023 when Nigthshares closed their ETFs, a lot of articles mentioned their underperformance. However, as we can see from the chart, the ETFs live period coincided with a slump in overnight performance in general as the theoretical strategy did not exactly perform well during the period. I decided to calculate the "Alpha Leakage", the difference between the theoretical overnight return and the actual ETF performance, for the brief life of NSPY and NIWM. By stripping out the explicit 0.55% expense ratio from the total underperformance, we can isolate the 'Institutional Ghost' (swap financing and slippage):
--- NSPY Friction Breakdown ---
Total Alpha Leak:    1.69%
Due to Expense Ratio: 0.58%
Due to Funding/Swaps/Slippage: 1.11%
--- NIWM Friction Breakdown ---
Total Alpha Leak:    4.84%
Due to Expense Ratio: 0.59%
Due to Funding/Swaps/Slippage: 4.25%
So, in total, the difference between theory and practice in total return was around 1.69% for NPSY and 4.84% for NIWM (including TER of 55bps).
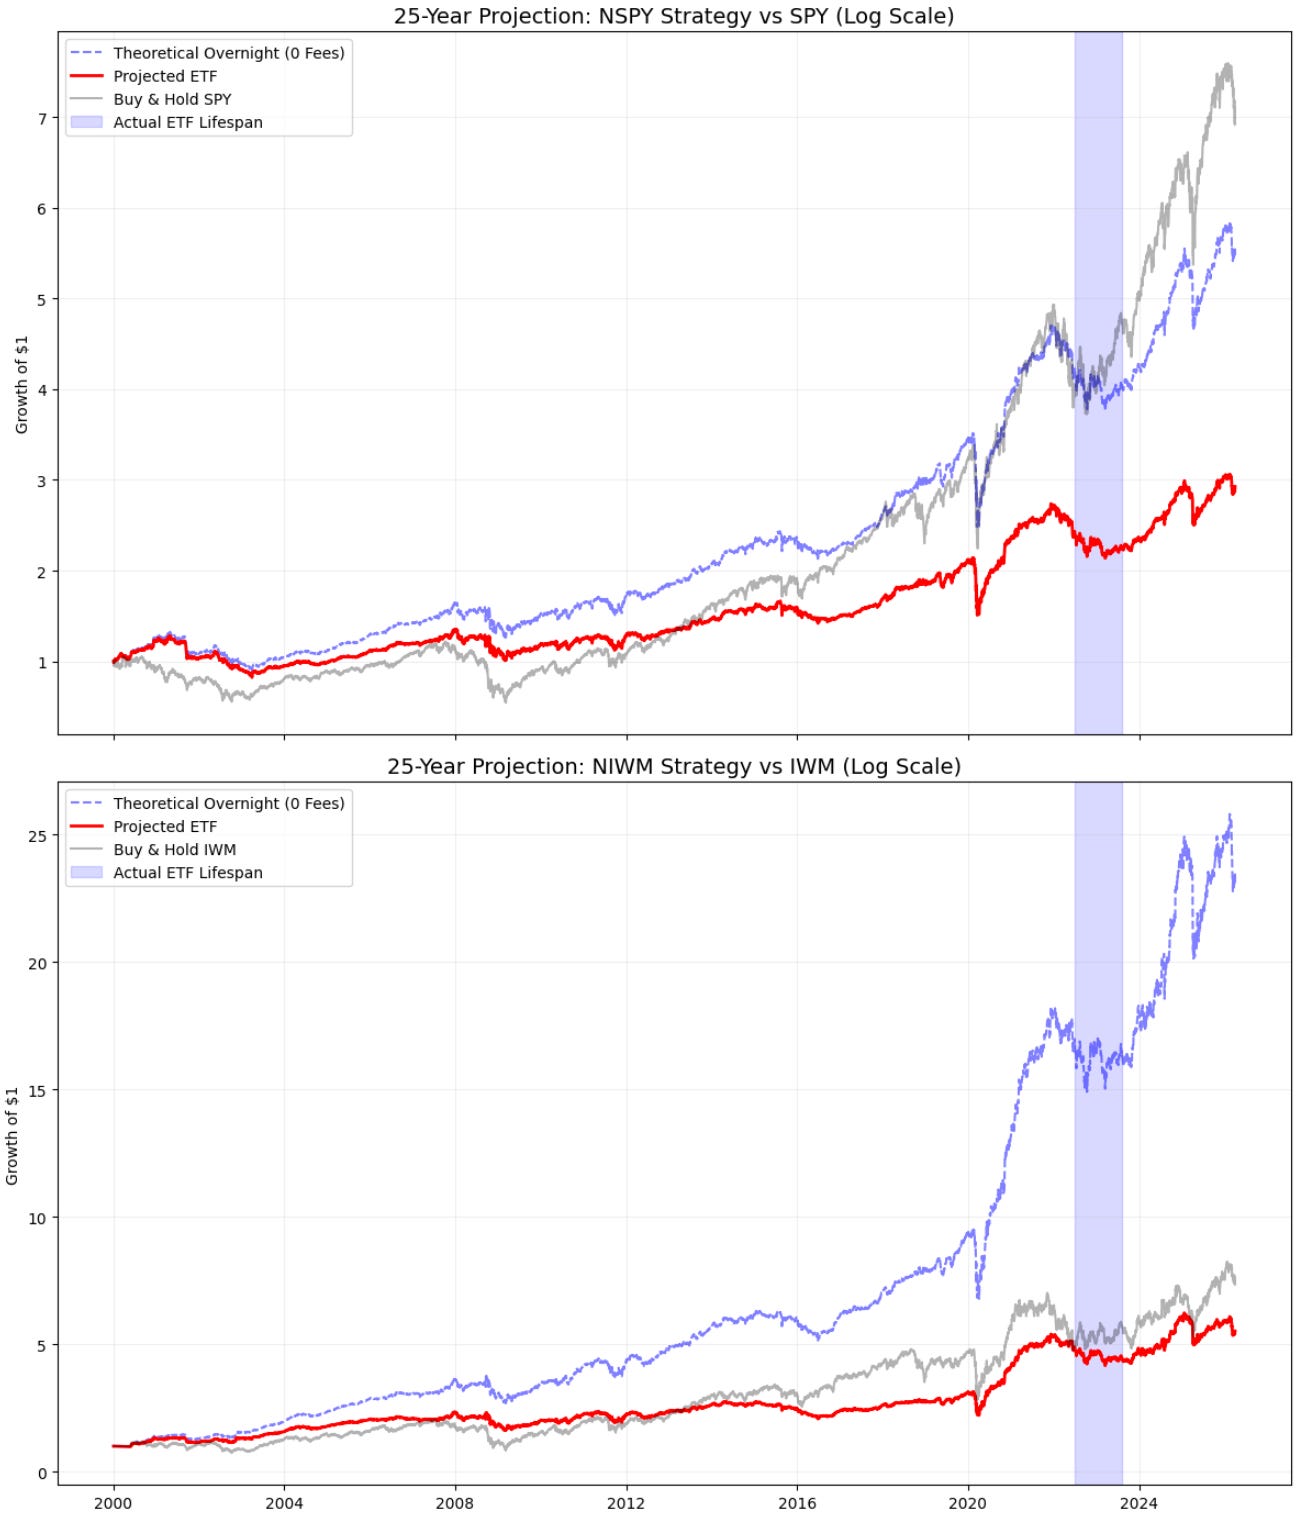
If we propagate the NightShares performance backwards and forwards in time, using the same alpha leakaged and mark the live performance of the ETF, we see two things:
Timing was really bad for both ETFs. The period itself was mixed for buy& hold the underlying as well as the theoretical overnight return.
Costs destroy even the best theoretical performance. Overnight IWM looks great on paper, much better than IWM buy & hold (blue dashed lined in the second chart) but terrible if we account for costs (red line).
The Bitcoin "Haircut"
What does this mean for the Bitcoin AfterDark ETF? If we assume a conservative annual drag of 3.59% (based on a mean of the NightShares friction + the 0.95% fee), the strategy still looks attractive.
The below chart shows the theoretical BTC overnight returns (blue dashed) vs the after drag performance (red line).
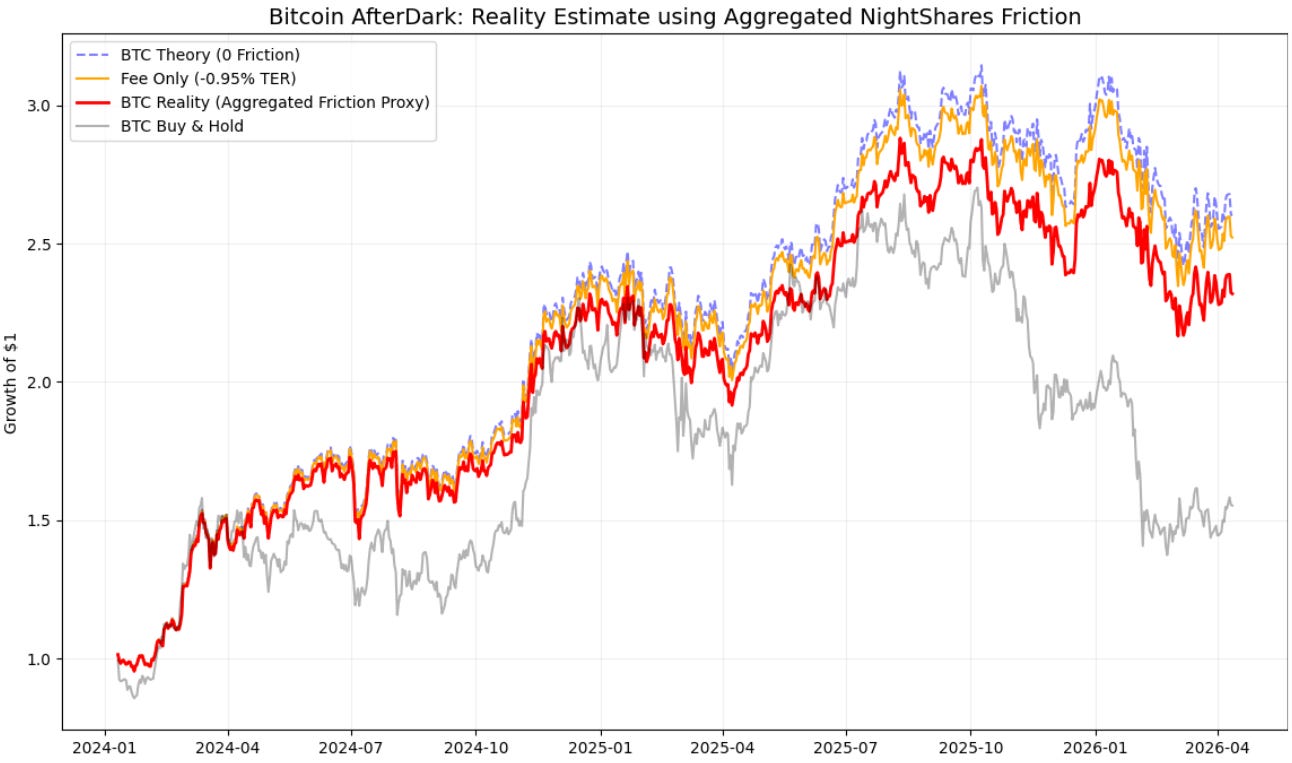
But we’re likely being too optimistic. When banks price swaps for an asset like Bitcoin, which is 3x more volatile than the Russell 2000, they don't charge S&P 500 rates. They price in the hedging difficulty. If we assume a more realistic 10% annual drag (2x the NIWM friction + fees), the hurdle becomes much higher. At a 10% drag, we start to see the 'Cost of Carry' eating the very volatility-adjusted returns that make the strategy attractive in the first place. The chart below shows the resulting after drag performance in red.
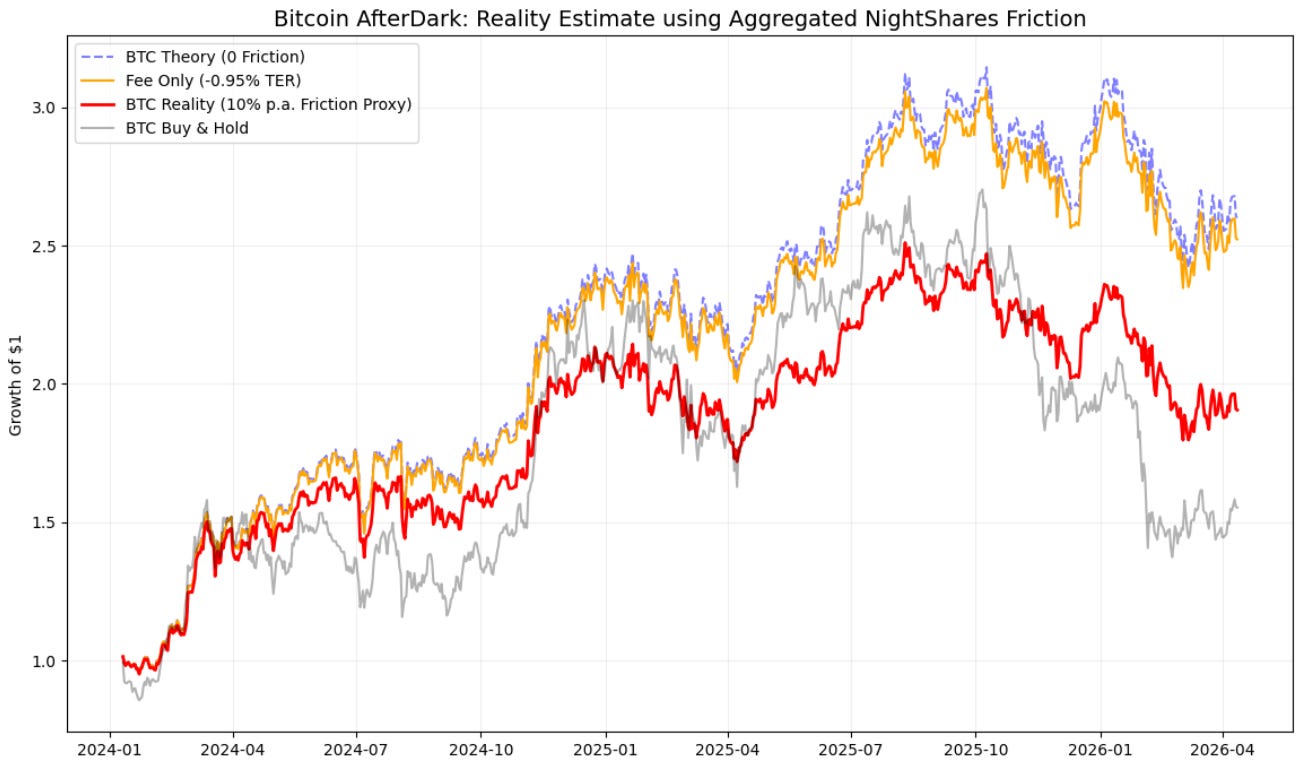
Even with a 10% headwind, the Bitcoin overnight effect is so historically potent that it might still survive. However, the only way to truly know is to watch the "Actual" line diverge from the "Theory" line over the coming months. In the meantime, the second path has always been my favorite: testing it on a DEX to see the slippage for yourself.
It looks like Hyperliquid just got me back.
Happy Trading!
Comments
Nothing yet. Say the first thing.
Sign in to join the conversation.