
He quit smoking in March, the week the account doubled. A reward, he told his wife.
Late in the evening of the 30th of July he buys a pack at the GS25 under his office, smokes one in the doorway, and checks the app again. That’s the only way he felt like he was doing something.
His portfolio stopped meaning anything in Won weeks ago, so his brain runs the conversions it always runs now: the apartment deposit, gone. 3 years of salary, gone. The account holds one position, a 2x product on SK hynix.
He bought it because he was told Hynix was the future and 2x was faster. It’s down 65%.
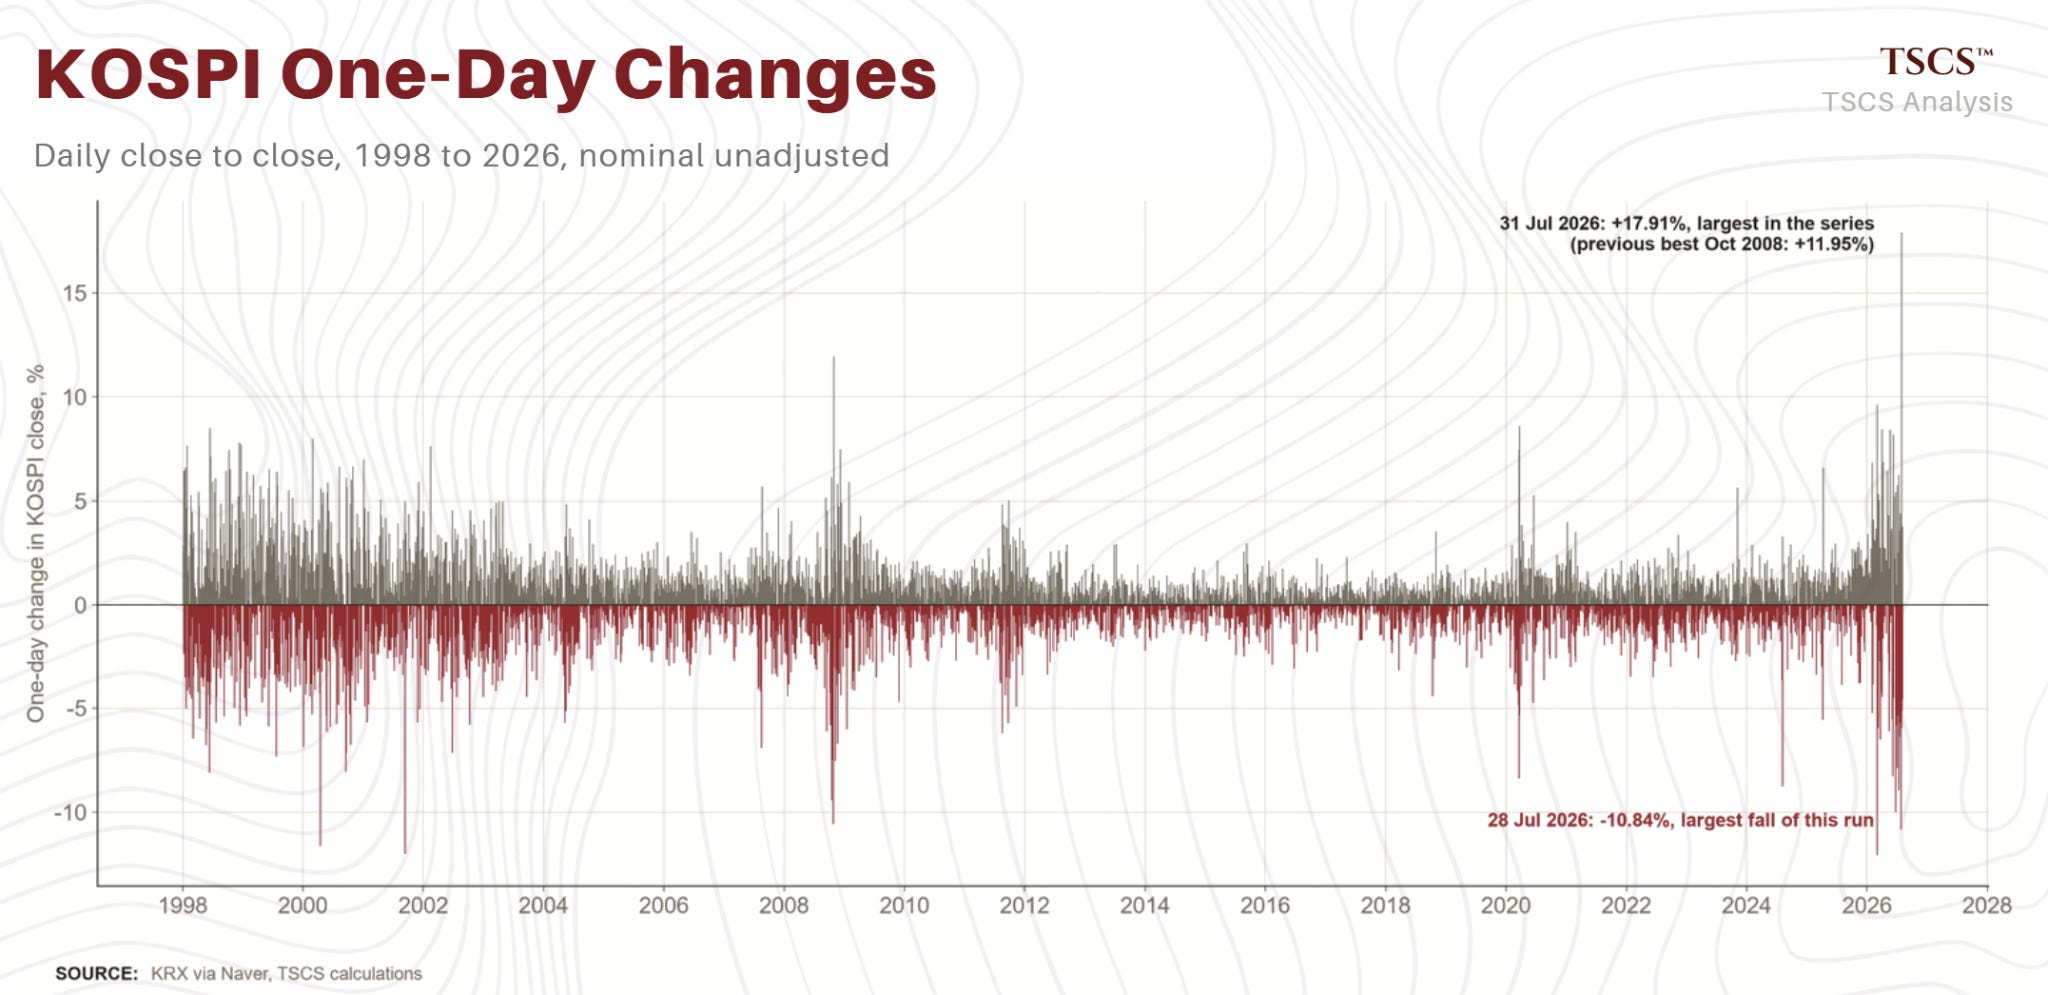
The index closed at 5,593.56 today. He doesn’t know it yet, but that’s the lowest it was going for now.
At 11:00 he types a question into the product’s chat room and puts the phone face down on the counter.
The FT quoted it on the 30th of July, from the chatroom of that product:
“When can I get out of this hell?”
Well, he wasn’t being rhetorical. It has a computable answer, so let’s compute it.
The next session, the market had the best day ever. The index rose 17.91%, the largest single day in its history. SK Hynix went limit-up. 30%.
A product built to double the daily move did its job, up 59.9% that day.
What’s left of his account is 100 - 65 = 35 x 1.6 = 56. He’s down 44%. (The product is fine btw. It did everything the prospectus promised. That’s quite literally the problem.)
The best day in the history of the Korea stock market moved him from -65% to -44%. This is what daily-reset leverage does in a drawdown. Averaging down closed to him the same morning: From the 31st, new purchases of these products will need a ₩30 million deposit (per Yonhap), and there will be no new products either, since the regulator stopped approving them.
So when does he get out of hell?
Not at a price. The answer goes through a different series, one that measures whether the leverage that built this hell is gone. It says 2 things.
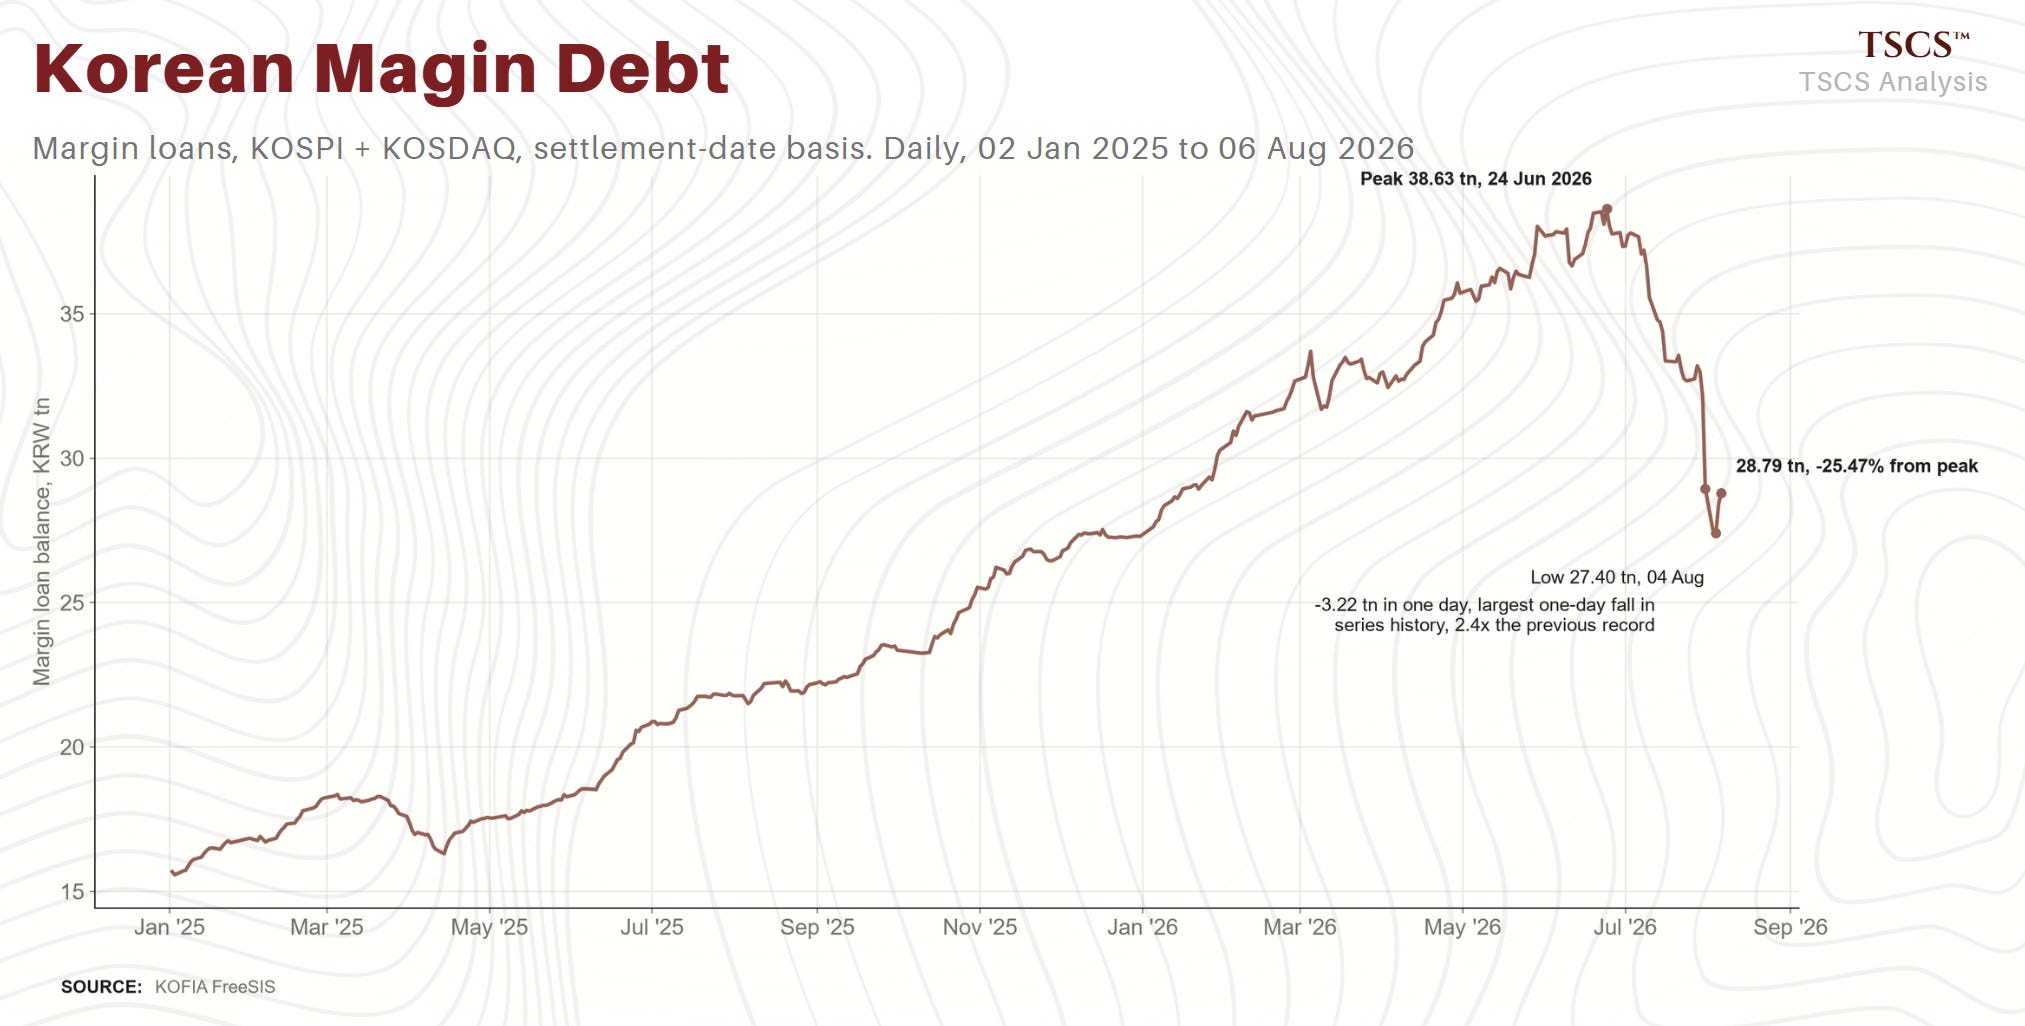
Korean margin debt has fallen 25.5% from its June peak in 43 days. In 28 years of data, only Covid got there faster.
It’s still sitting at the 98th percentile of its history.
The balanced finished this week at ₩28,794,010 million on Thursday (6th Aug), the same 신용거래융자 I used in the previous article. Thats ₩3.36 trillion less than last week and 25.47% below the peak of June 24.
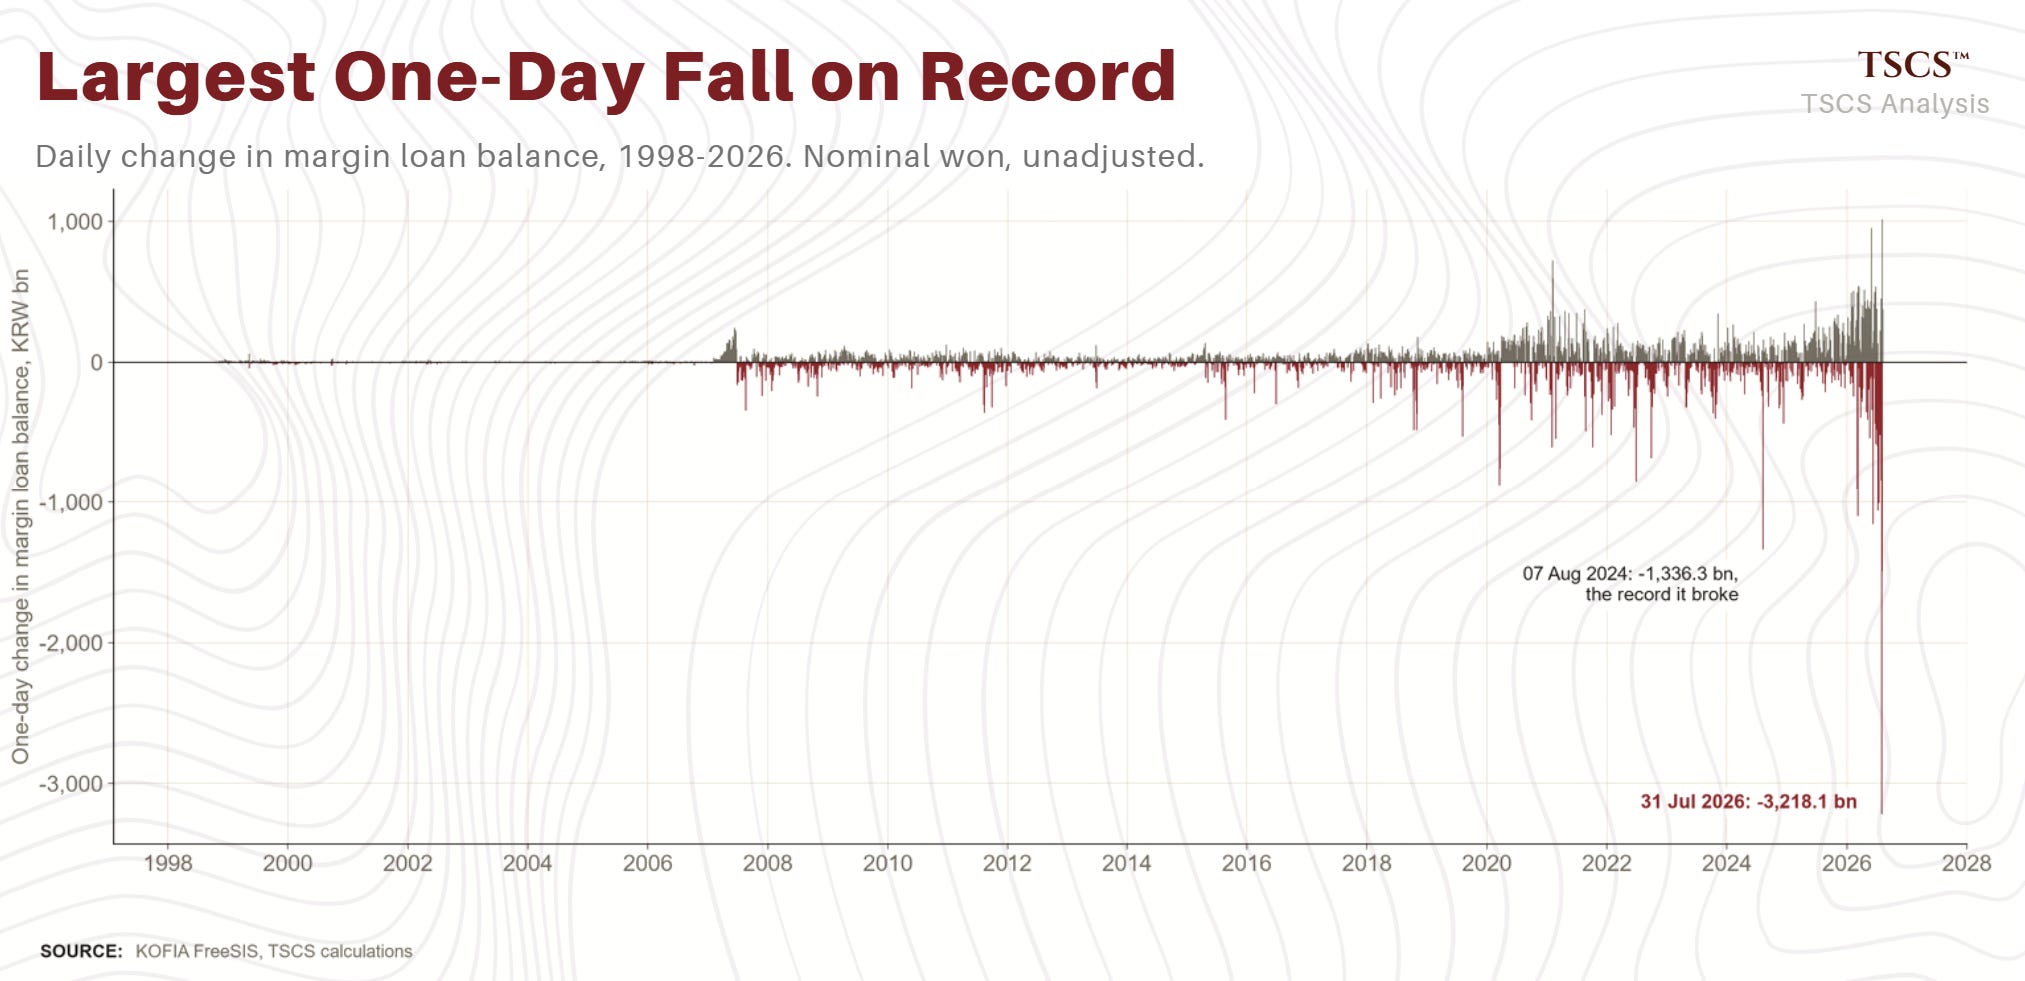
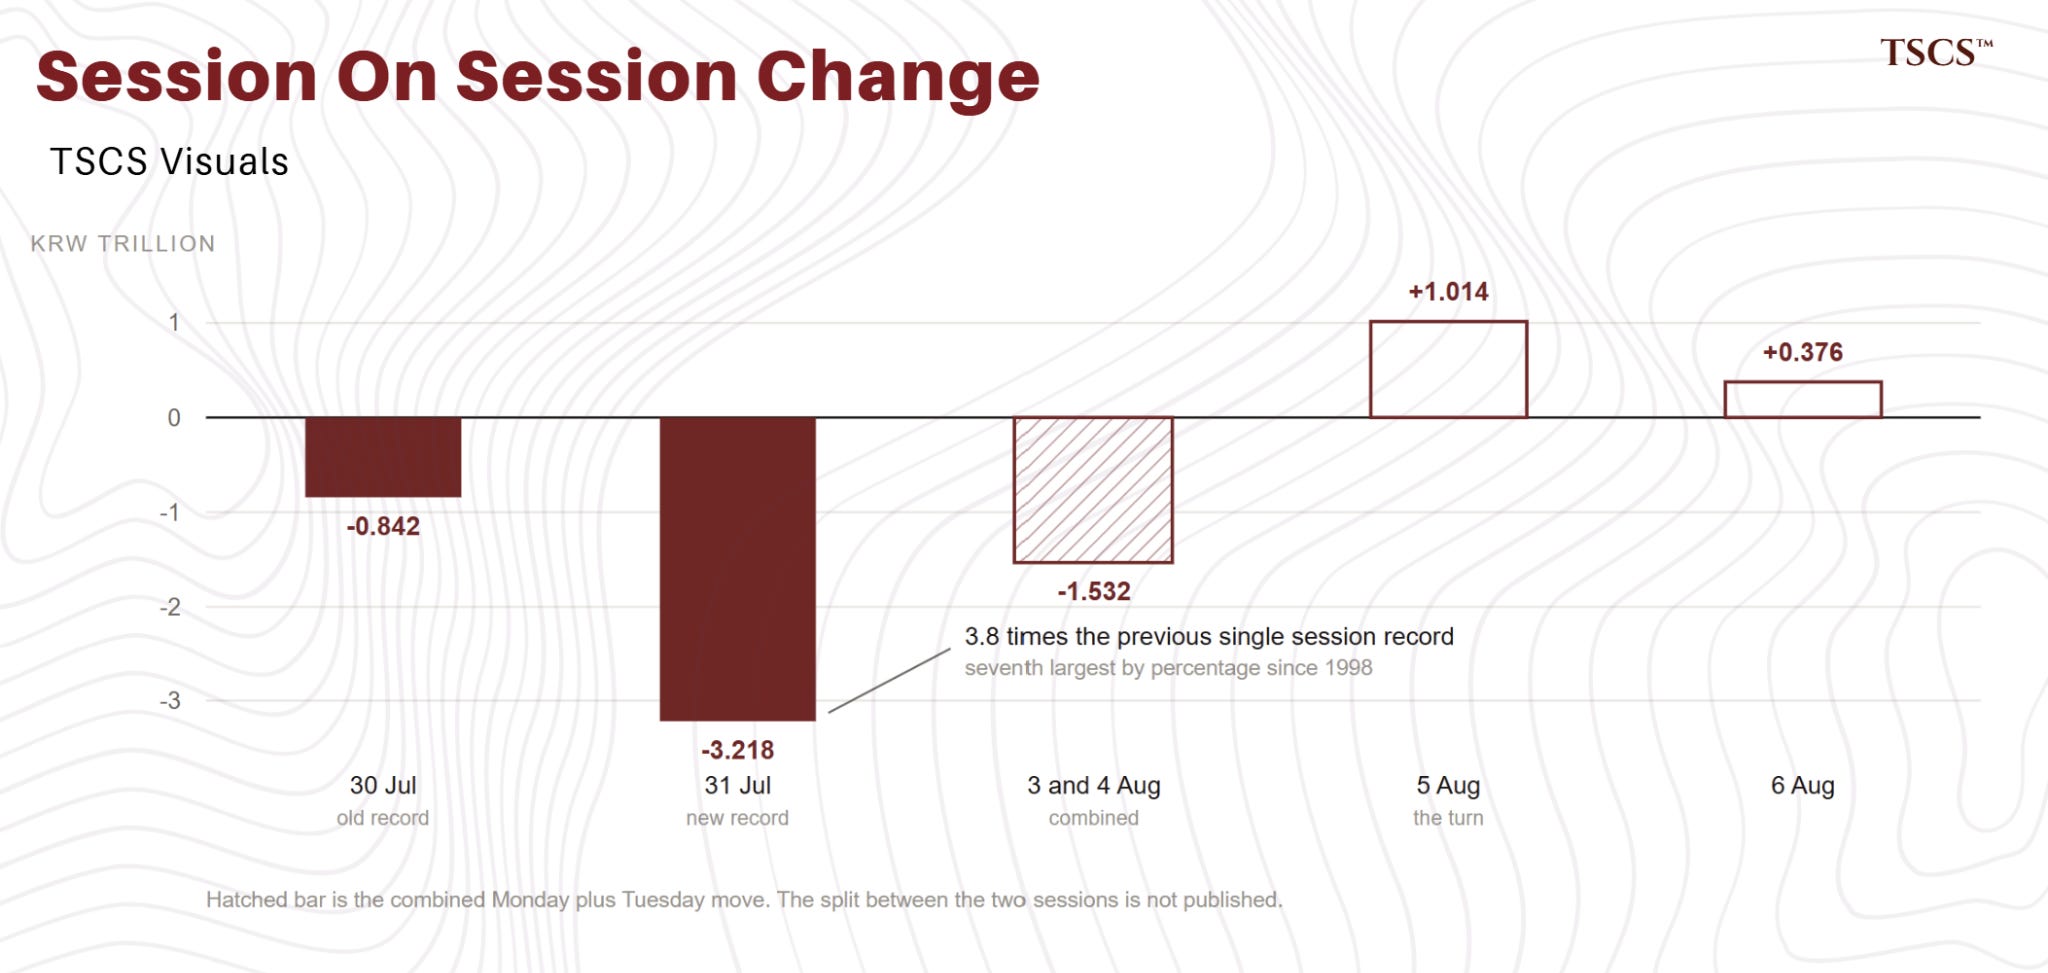
Getting to this point was obviously not gradual. On the 31st (that same session that took the index positive 17.91%) the margin balance fell ₩3,218.122 million the same day. That’s, once again, a record breaker for Korea. Before Friday the biggest single day drop was… Thursday… Of ₩842 billion.
Do note that by % the day ranks 7th since 1998.
But the balance didn’t stop falling. ₩27,403,828 million by Tuesday the 4th, 29.07% below the peak.
Wednesday finally broke this generational run. The balance went up ₩1,014,138 million, then another ₩376,044 million on Thursday. That looks like a bottom, right?
₩122,012 million on the 31st of July, the 3rd largest print of this episode behind the ₩169,796 million of the 9th of June and the ₩142,197 million of the 9th of July. Then ₩22,371 million, ₩31,535 million, ₩11,768 million, ₩10,694 million.
The last 2 sit under ₩20 billion a day, which is the level I said this series had to return to before any of this counts as clearing.
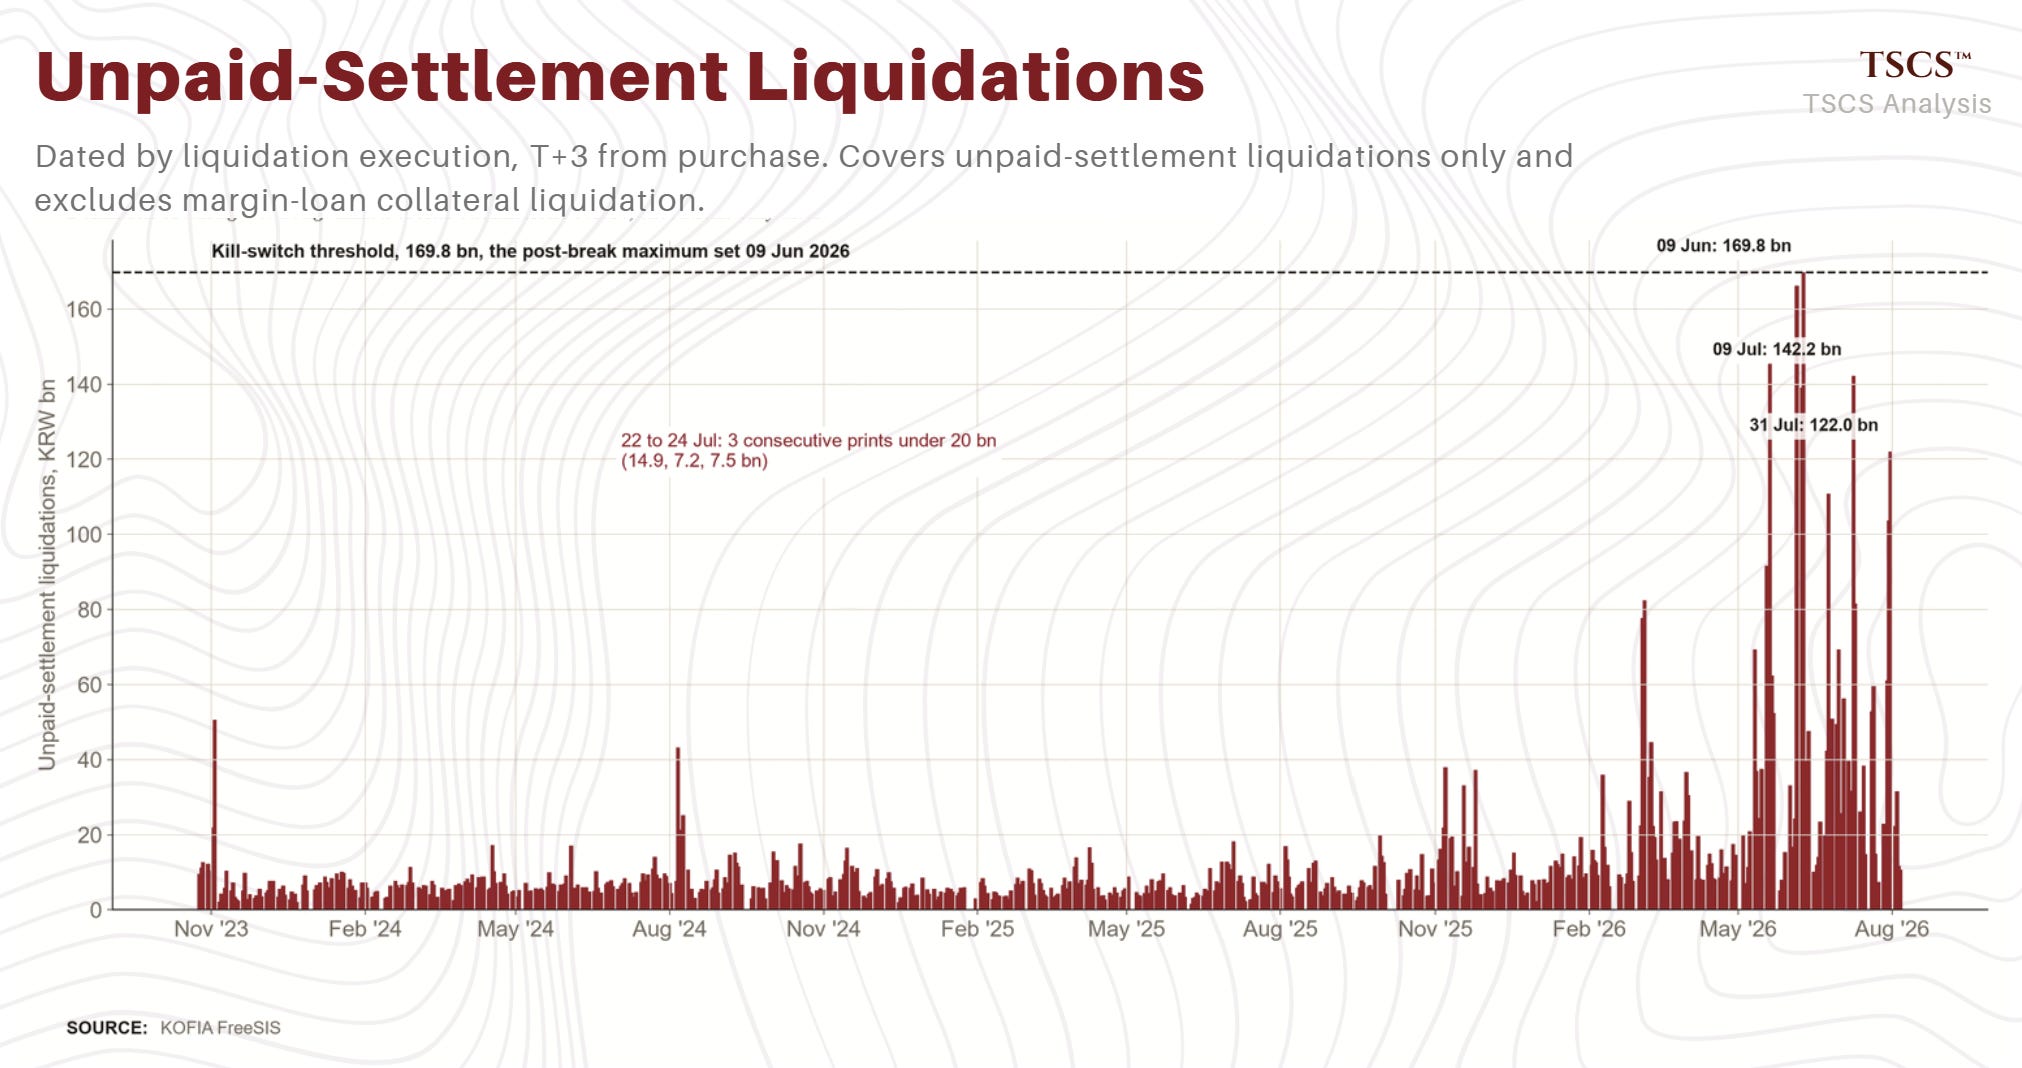
If we look at the 23rd and 24th of July, the series showed ₩7,208 million and ₩7,488 million, the 42nd and 44th percentile of 20 years, and with the 22nd’s ₩14,923 million that made 3 consecutive sessions under my ₩20 billion line.
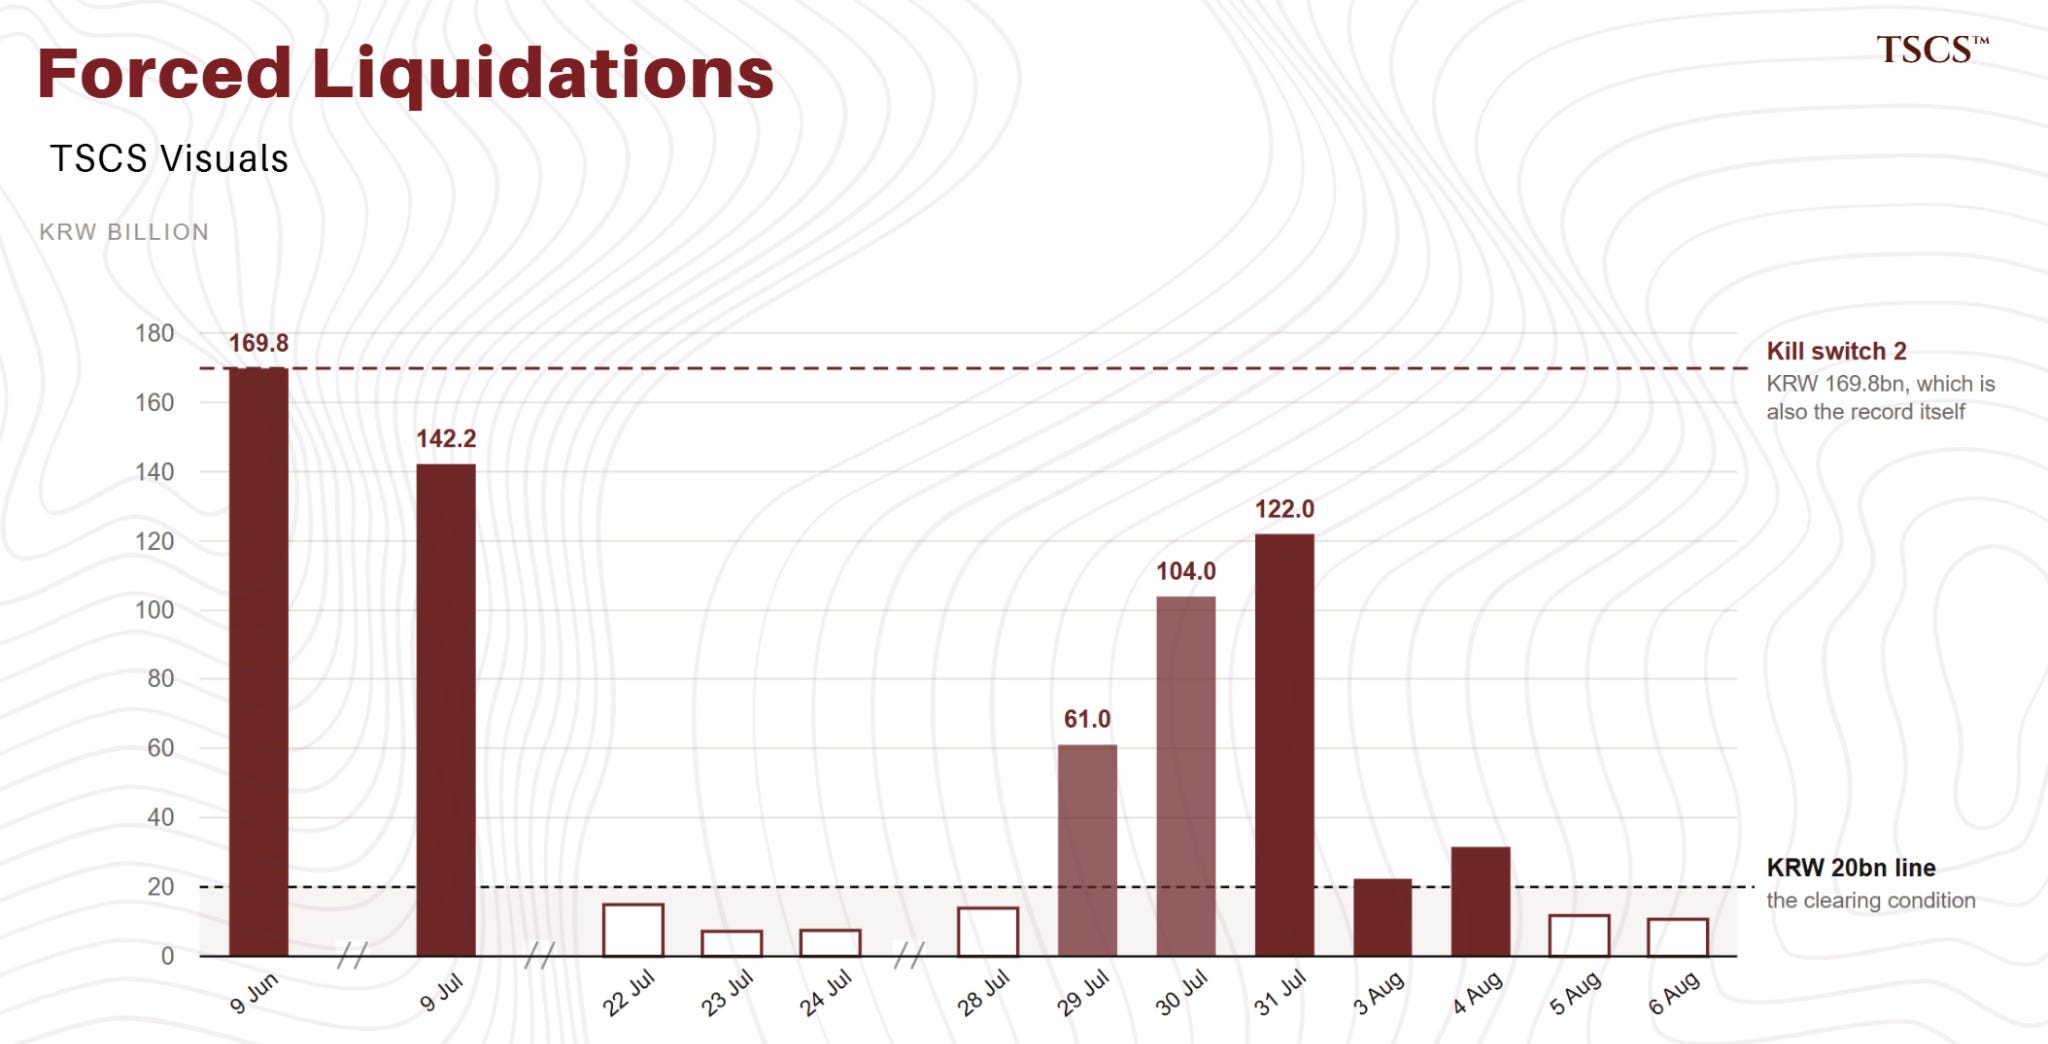
If this tracker had existed a fortnight ago I would have probably written that the condition was met and moved on.
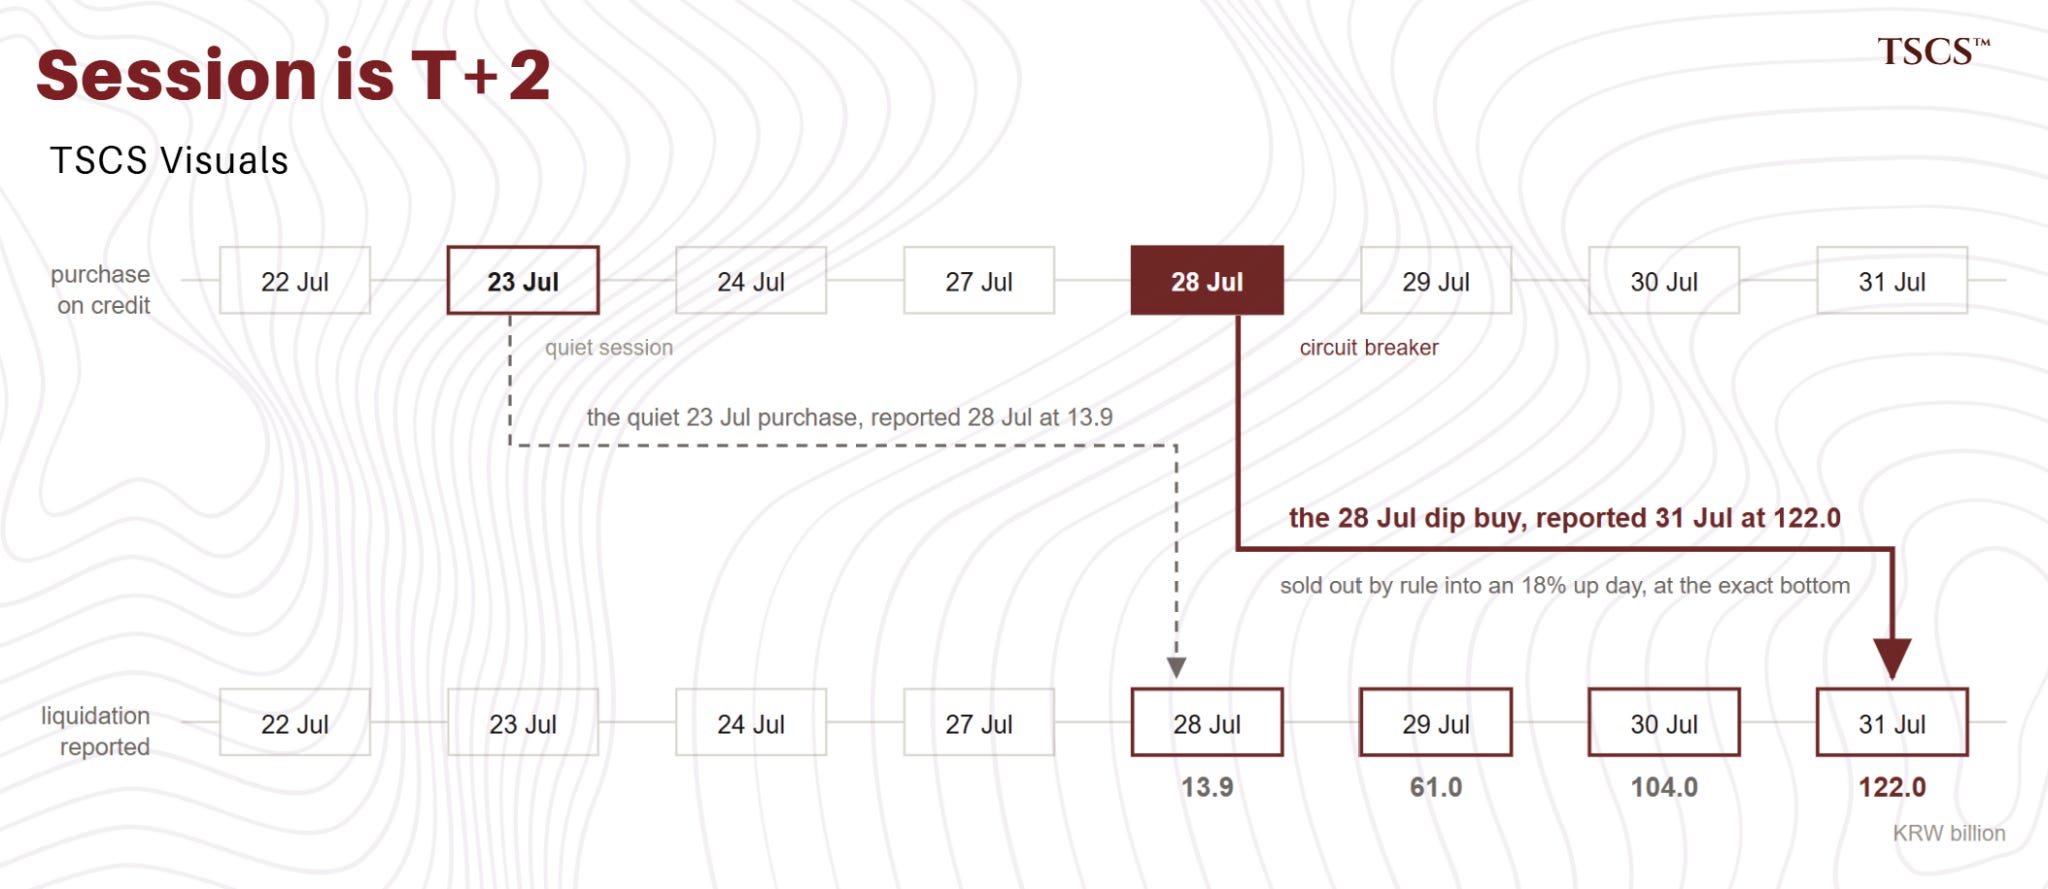
The line gets crossed a lot, 8/26 sessions. The strangest crossing is always the one that teaches you the most. Specifically how to read this series. On the 28th of July, the day of the first back-to-back circuit breakers, with index down 10.8%, the reading was ₩13,890 million.
That’s under the threshold on the WORST day of the crash. The lag explains this. A reading on any date traces to purchases 3 sessions earlier so the 28th’s number describes that moment on the 23rd. Which also explains why the crash-week buying only reached by the 29th, 30th and 31st (at ₩61 bn, ₩104 bn, and ₩122 bn respectively).
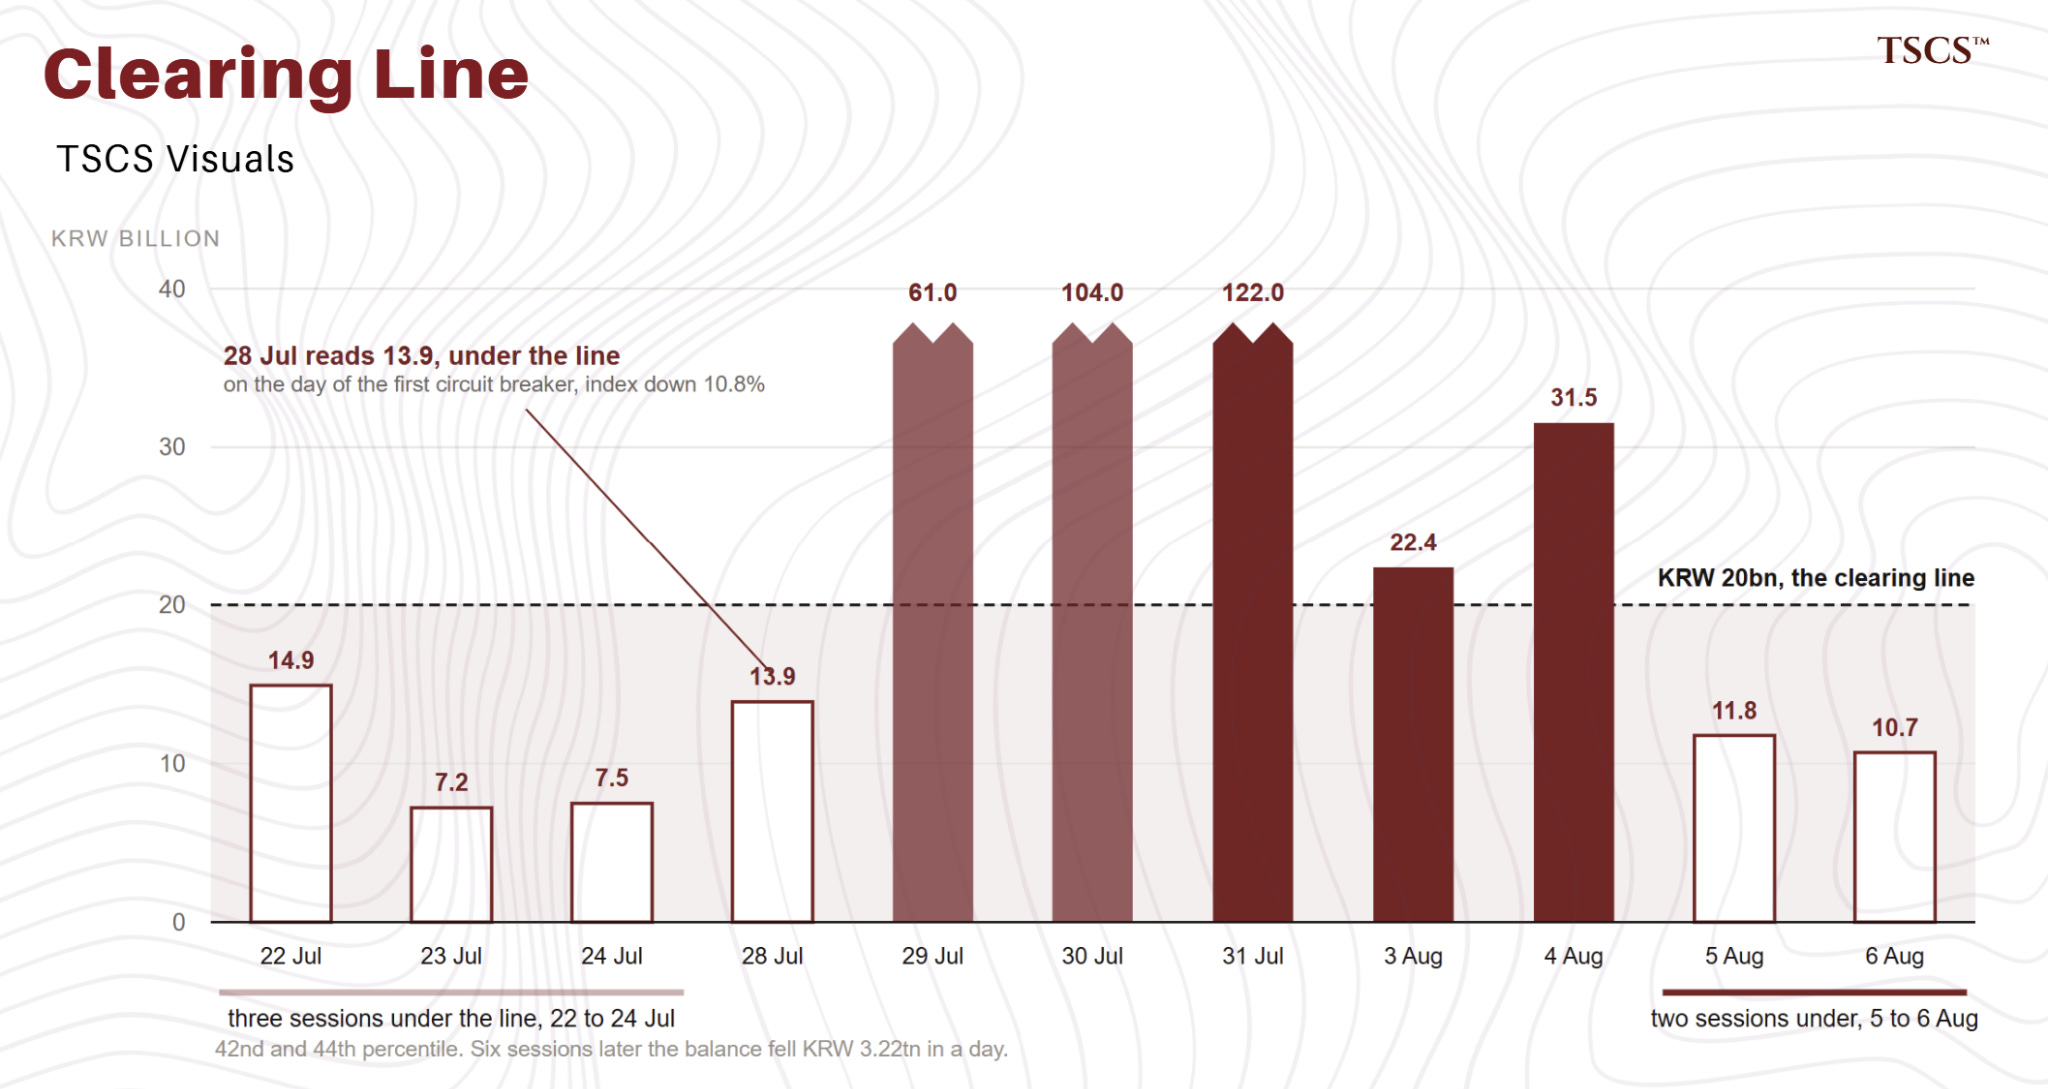
This means that the ₩122 bn on the 31st is people who bought the circuit-breaker session on credit they couldn’t cover, liquidated into that huge rally.
It’s a rear-view mirror with a 3-session delay, which is why the 2 readings today do nothing about today.
Put a person inside that ₩122 bn bar (because you’ve met him). He’s the guy from the introduction. It’s Tuesday 28th and the market is halted by 10:45, down 8%, and he buys the dip, because the dip-buy worked in June and he’s been paying himself back with that idea for 5 weeks.
He obviously doesn’t have the cash. Settlement is 2 days away and it always worked out before. Wednesday brings another halt. Thursday the index closes at 5,593.56. That’s the lowest close of the entire drawdown, and the cash still isn’t there.
So on Friday morning the broker sells him out. Sorry dude. And the market opens into the largest rally the index has ever seen.
He was carried out at the exact bottom, into an 18% up day (the market’s sense of humour survives every crash).
The two setups aren’t identical, from what I see the difference argues for taking this week more seriously. On the 23rd and 24th the balance was still falling. This week it’s rising again.
My condition needs both, a quiet liquidation series and a balance that has stopped going down. Both are holding at once now.
To clarify, those percentiles span a definition change on the 25th of October 2023. I had been describing the change as contracted amounts becoming executed amounts. Before the change, brokers could report amounts targeted for liquidation that were never executed. A parctice that surfaced during the Yeongpoong Paper mess, and from the 25th KOFIA kept actual executions only (its own explanation carried by Yonhap). What I’m trying to get at is the older history isn’t a clean definition. There’s a decent reason to distrust long comparisons.
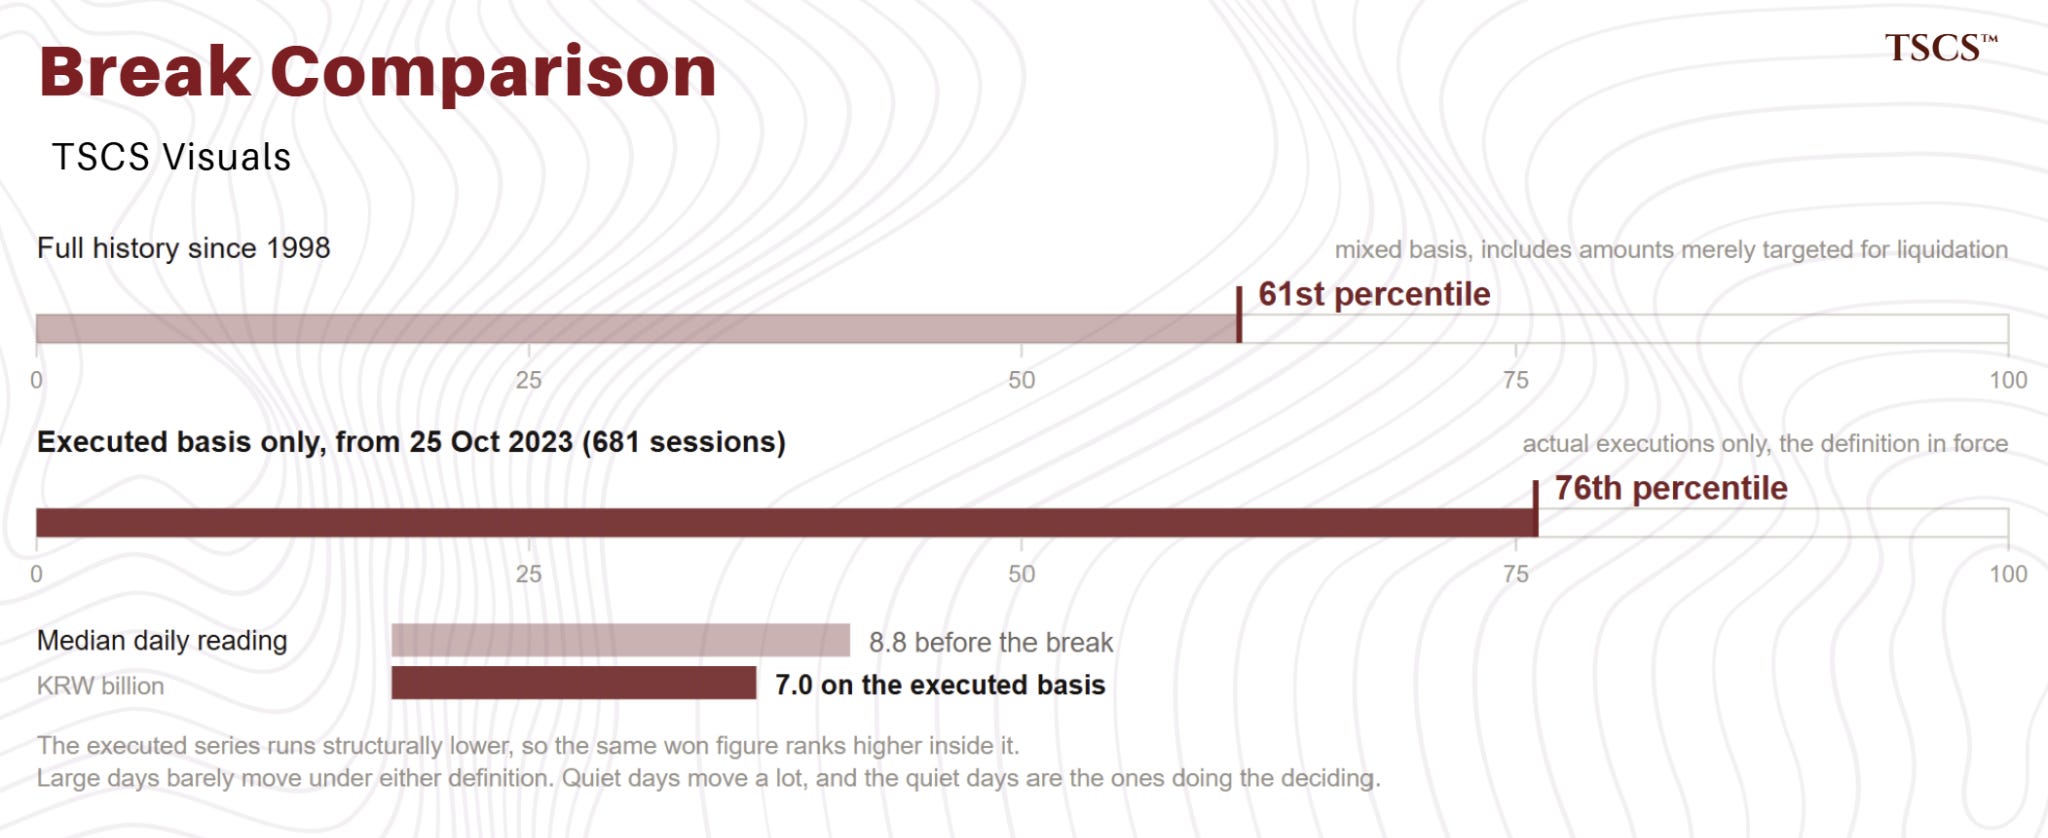
On the longer timeframe, Thursday’s reading is at the 61st percentile, which sounds like nothing crazy.
On the executed basis alone (the definition in force), it’s the 76th percentile. The executed series is structurally lower, with a median of ₩7.0 bn against ₩8.8 bn before the break.
While checking that, I found I’d under-described kill switch 2 as well. On the executed basis, the largest reading in all 681 sessions is the ₩169,796 million this episode recorded on the 9th of June. My threshold is at that level, so a trip would be a record. Pretty high bar and something that was downplayed.
And of course, it counts liquidations of unpaid settlement balances and excludes margin loan collateral liquidation entirely. It’s supposed to be a floor.
Deposits went nowhere this week:
₩104,071,197 million on Thursday
₩104,658,382 million a week earlier
It’s been swinging between ₩102.8 and ₩112.5 trillion over the past 3 weeks so no single session in it means much.
But the underlying structure did move. Reuters reported on the 7th that Korean retail bought $6.4 bn of US stocks in July, against a $2.7 bn monthly average across 2025, their offshore buying surpassed their domestic buying for the first time since February (with another $278 million net out in August). At ₩1,419 won to the dollar it’s about ₩6.5 trillion. Some of the cash emigrated from brokerage accounts it seems.
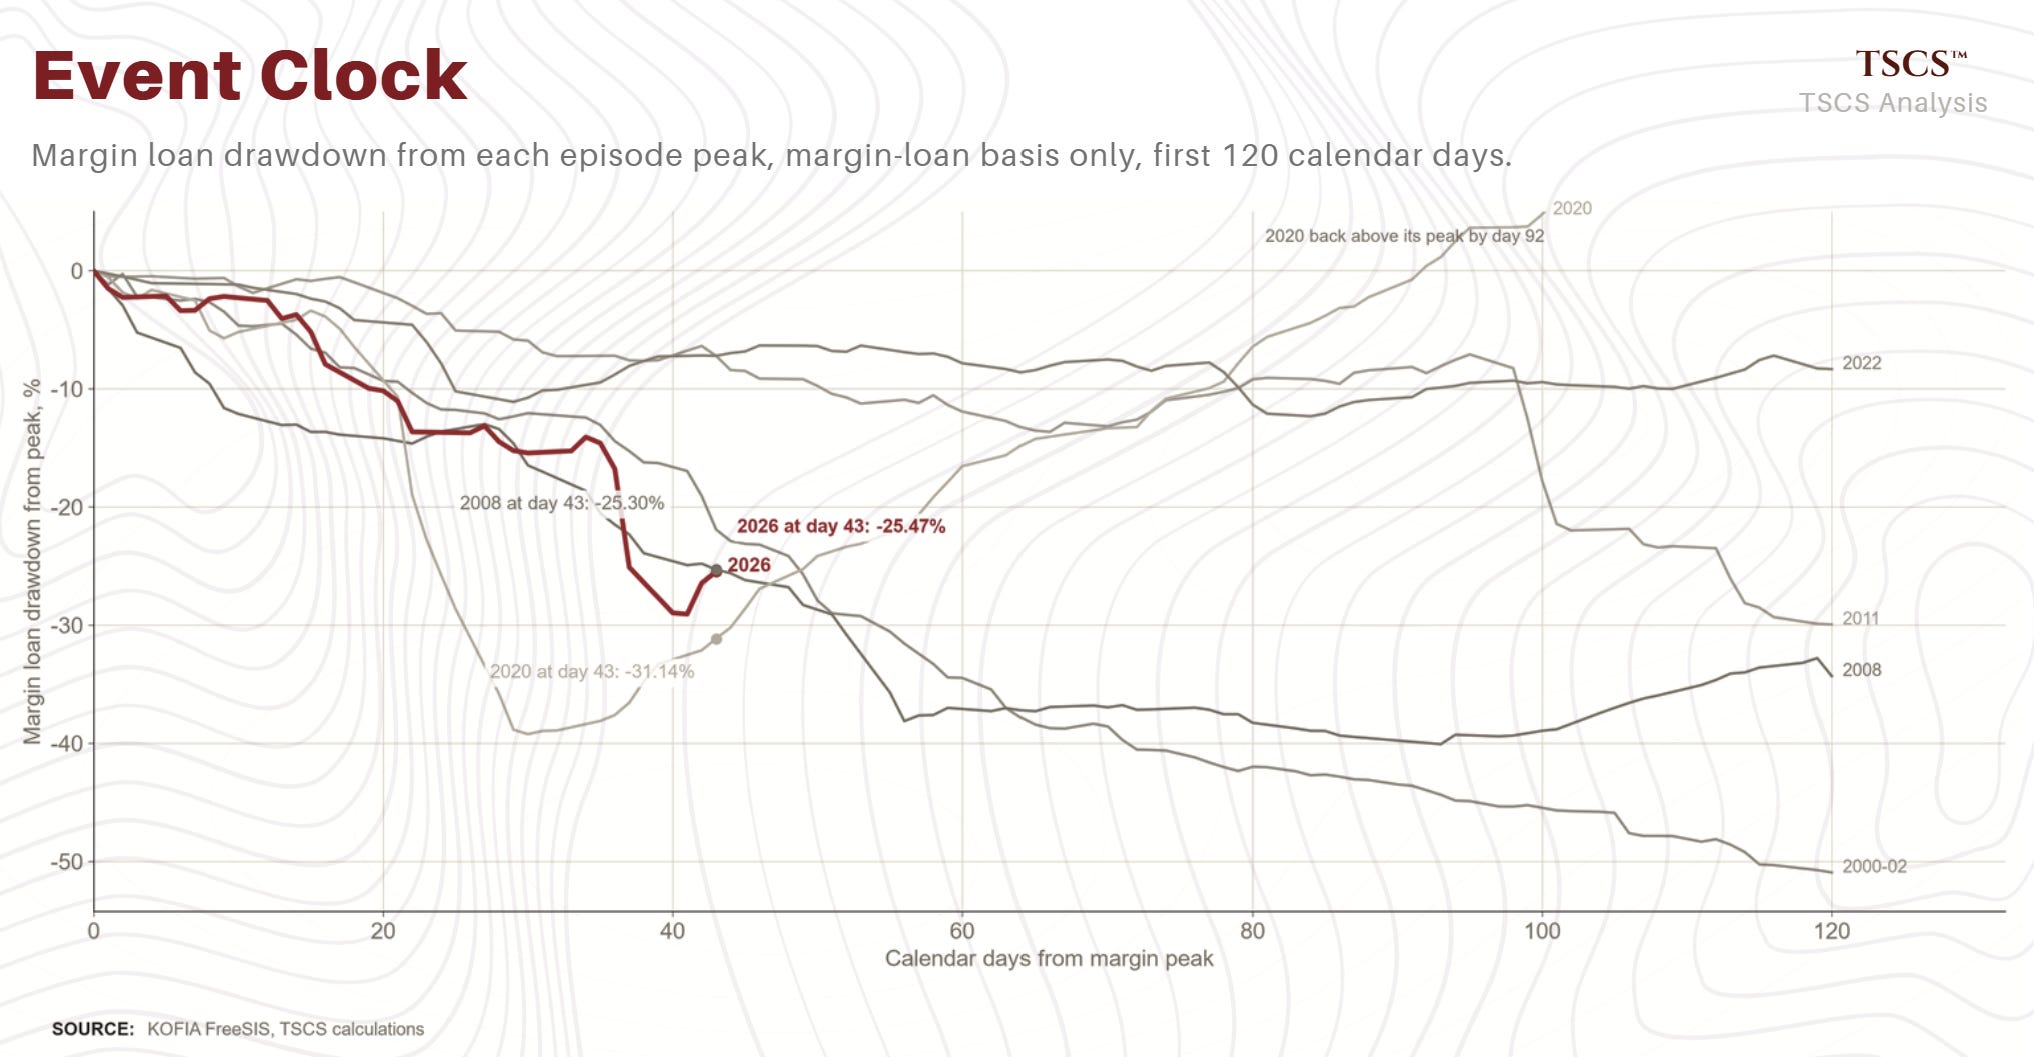
This episode is 25.47% below its peak.
The financial crisis was 25.30% at the same point, level with it inside 0.2 points. Covid was 31.14%, and Covid had already troughed 13 days earlier, 39.23% down on the 30th day. The 2000 unwind was at 21.90%. The 2011 crash and the 2022 bear were both at 7.20%, indistinguishable to two decimals.
So at day 43 this is in line with 2008. Either it’s a compressed 2020, violent and finished. Or it’s tracking the opening weeks of episodes that went on for 1-2 years. One regime fact would influence the choice: in 2020 the BoK cut 75bp into the unwind. This time it appears to be hiking into it, which is a 2011 config.
Day-43 depth is a poor guide to the endpoint since 2011 and 2022 were both at 7% here and ended at 48% and 38%.
Comments
Nothing yet. Say the first thing.
Sign in to join the conversation.