
Do me a favour. Go to Cameco’s website and find that boring page, the one with the price table nobody screenshots.
Two rows are important:
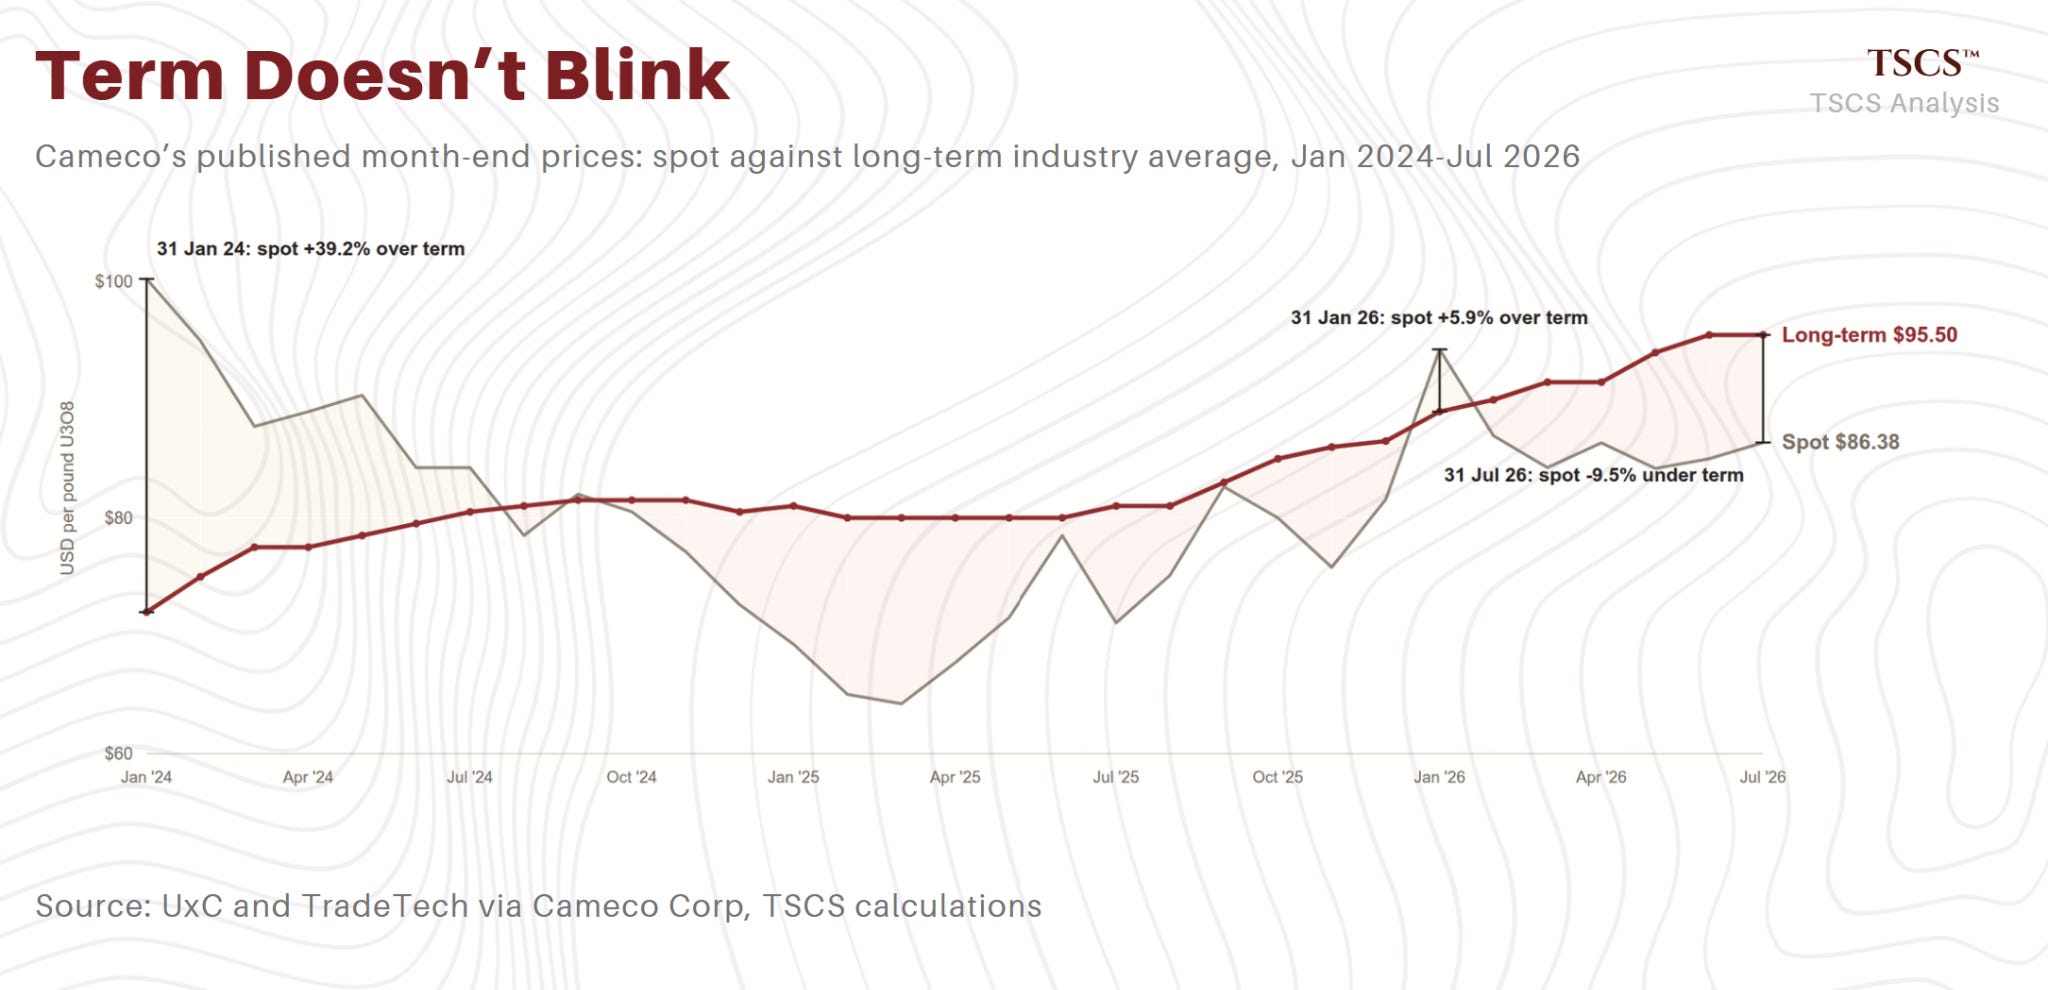
January 31, 2026: spot $94.28. Long term $89.00
July 31, 2026: spot $86.38. Long term $95.50.
Read them again, slower this time.
In January, the spot indicator stood 6% ABOVE the assessed long-term contracting price.
By July month-end it cost 9.5% less and Numerco’s Friday indicative spot was $87.25 as I publish.
But I was only able to understand it once I plotted all 31 months since the beginning of 2024: term has been the HIGHER price in 22 of them. And the nine exceptions are all things you probably didn’t expect either.
Eight of them were from 2024 (old squeeze regime dying, with a spot premium that started at 39% and decayed to under 1% by September). Then term took over and in the 22 months since, spot has closed above the term line exactly once. Jan 2026.
That was the month the complex topped, and in every “uranium is dead” tweet people were telling a narrative that the term price never justified.
Spot has since spent 6 months not moving at all. Boring, and another reason to why many stopped talking about it.
There’s been 15 points of relative swing between the two prices in the last 6 months. This has happened while the sector’s equities have lost 1/4 to 9/10 of their value.
Spot is lying to you. We’ll tell you why.
On February 10th I wrote that uranium had flashed one of its loudest signals in a decade. Spot above $100, term at $88, what I called backwardation, the market paying up for pounds TODAY. I called it asymmetric.
Most of you weren’t here for that. So here’s the last 6 months for the record, which is house policy.
Spot: flat since publication.
Construction: The one we endorsed, developers plus a core physical holding, is about 25% below its late-Jan high.
Now the part worth your time is what 6 months of new data has done to our idea.
The famous spot premium was paper thin. On UxC’s own January month-end marks, set before the 3-day spike finished, the spread was 55 cents: $88.55 spot against $88.00 LT.
While spot round-tripped with twitter writing its obituary, the long-term indicator (which is an assessment of where sizable utility contracting could clear) went 86.50 at YE, then 89, 90, 91.50, 91.50, 94, 95.50 without a single down month.
The signal was in the term, and I should’ve said that.
So while everyone was watching the wrong price here’s what happened:
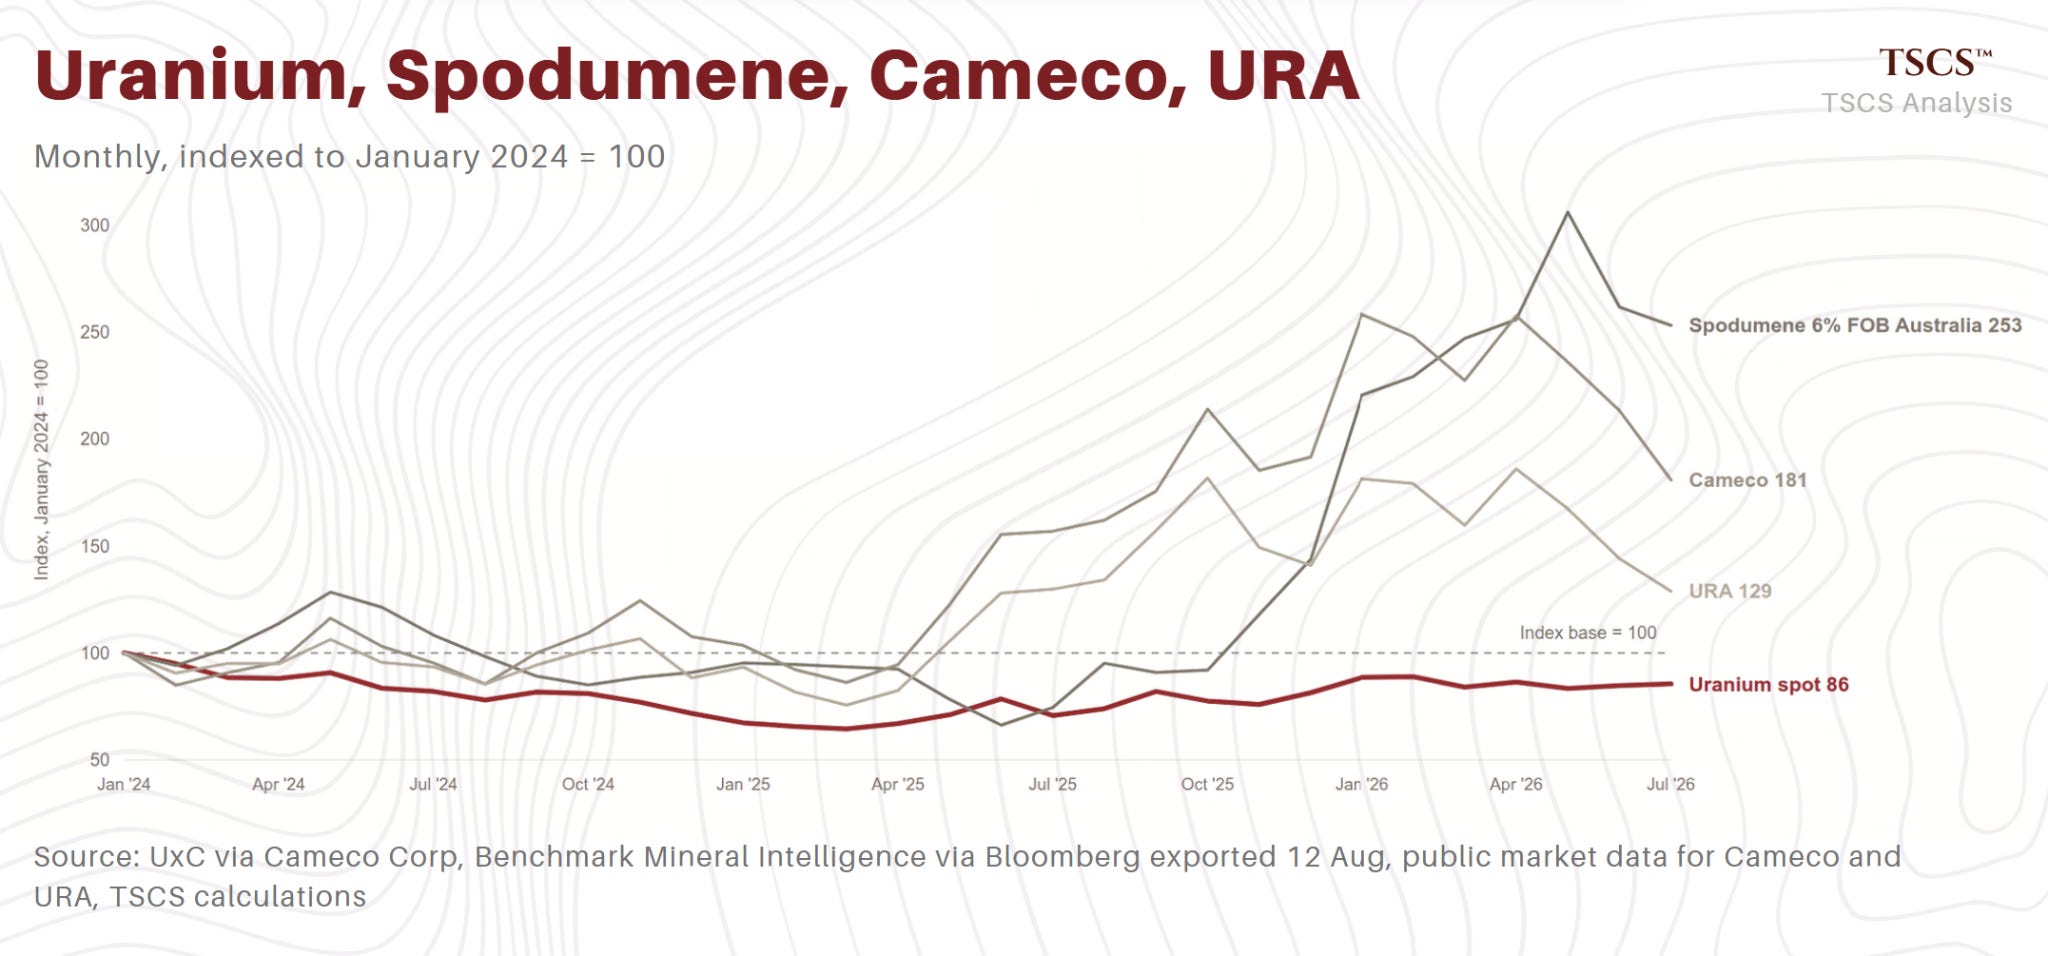
From August 2025 low to the January 2026 high, Cameco nearly doubled. Up 96%. URA rose 75%. And spot uranium rose 25% on composite.
The equities ran at 3-4x the commodity, and some is just normal maths: a producer with $40-50 costs sees cash margins move twice as fast as the metal around these prices.
Westinghouse got its $80 billion handshake in October. Reactor headlines were appearing every week even when the money wasn’t. Fine.
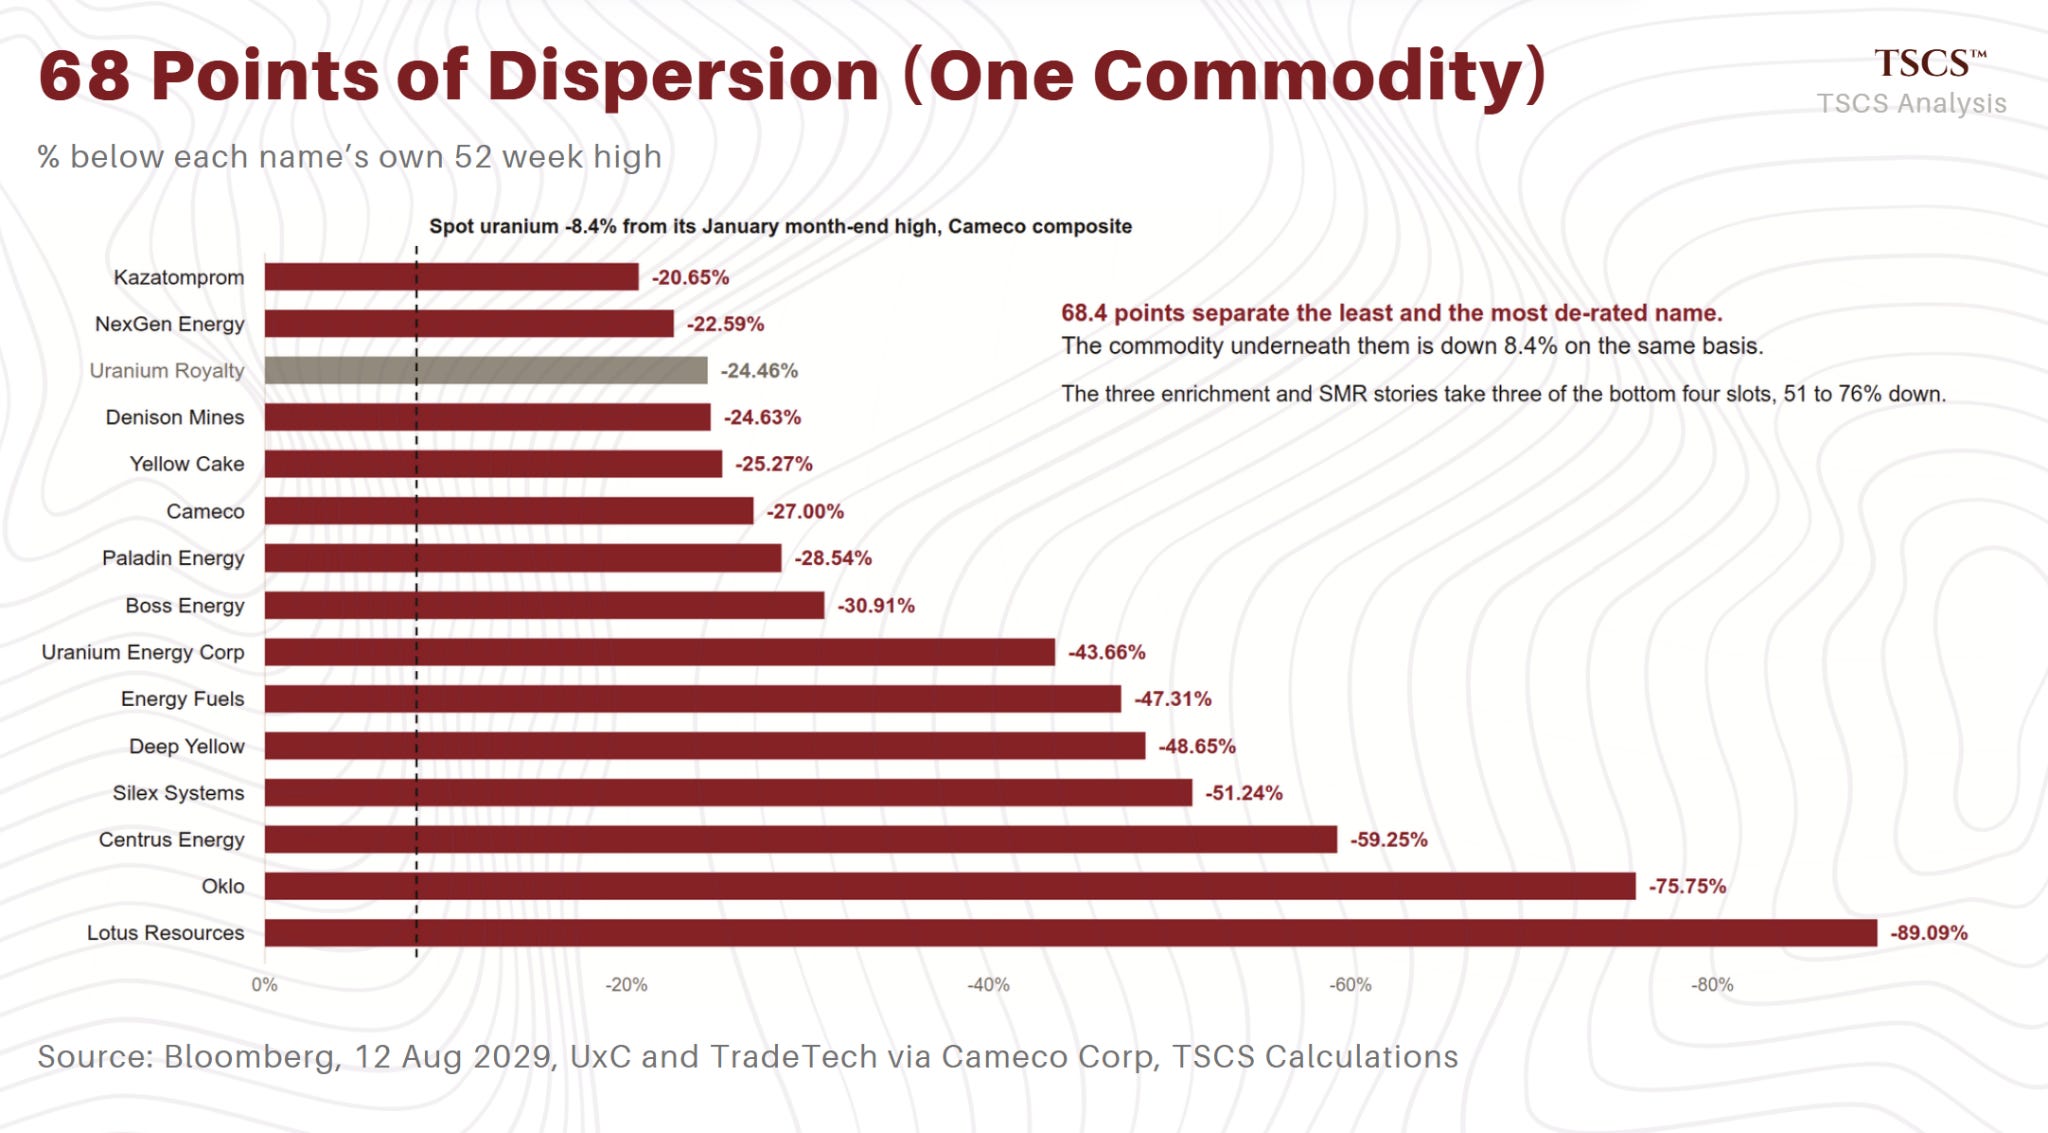
Then January 29. Everything topped the same day. Everything. From then Cameco is -27%, URA -27.5% and the juniors far worse.
So was it a de-rating? No, I don’t think so. Over a full 12 months CCJ returned +26%, URA +17%, spot 16%.
On any normal horizon, nothing de-rated at all. What happened was a sentiment spike that round-tripped.
I wrote in April that the consensus nuclear basket was one bet dressed as 5 (“Size Nuclear Smaller”).
The framework held. What I underweighted was the sorting. The break was correlated in direction and vicious about quality and magnitude, and the spread between the best and worst name over 12 months is now 150 points. We’ll get to who’s who behind the paywall.
Some know that there’s even a stat for how mechanical this all is. The HANetf Sprott miners ETF has logged 11 declines of 20% or more in 5 years, averaging 30.7% over 46 days, against 14 rallies averaging 43.6% over 34 days (MoneyWeek ran these last week).
Falls are long and grinding. Rallies are shorter and bigger. The current decline, 120 days and counting, is the longest in the dataset.
Draw your own conclusion about what usually comes after the longest one. And as I file this, prices seem to be already answering for themselves: URA is up about 15% from its late-July low in two weeks, Cameco nearly 16%, both still around 28% below the Jan highs.
So while uranium equities were busy doing this, the state got its chequebook out. Something I love seeing.
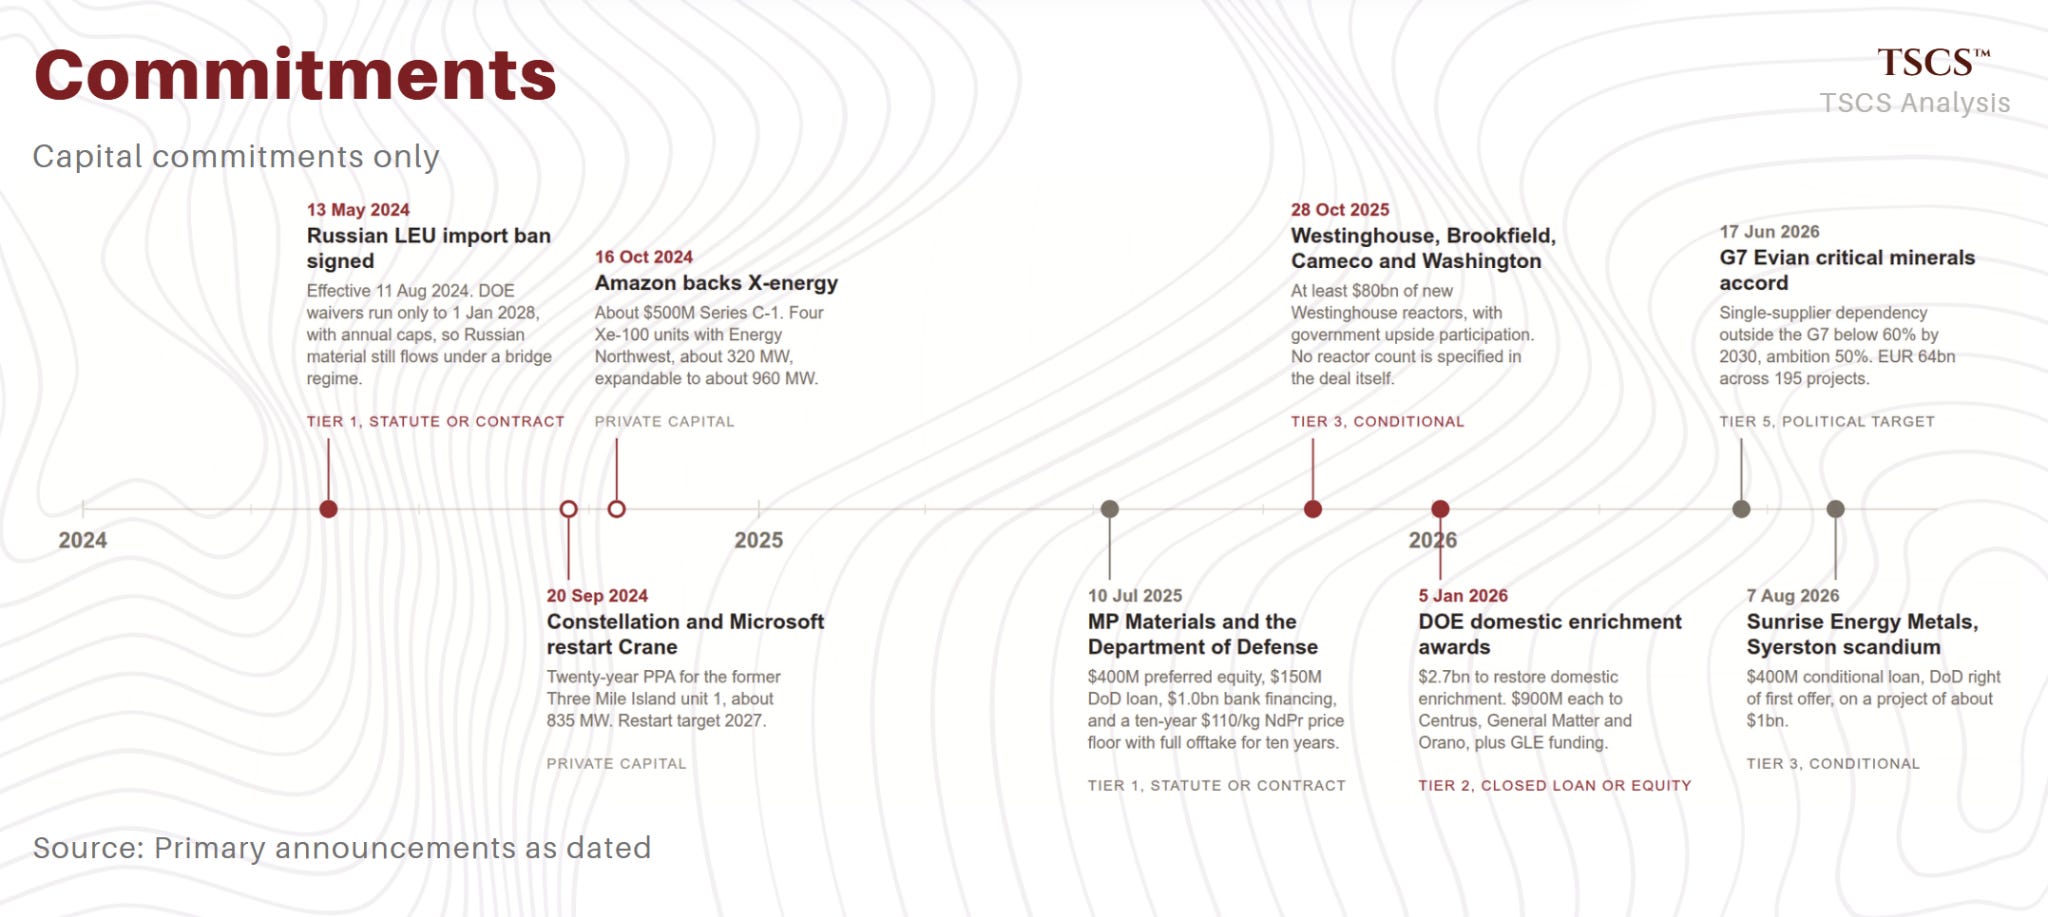
May 2024, Washington bans Russian enriched uranium, waivers running out January 2028, hard stop. July 2025, the Pentagon buys $400 million of MP Materials preferred, lends another $150 million, and, this is the part that should’ve gotten more attention than I think it did, guarantees a $110/kg FLOOR under NdPr prices for 10 years plus 100% offtake of new magnet plant.
October 2025, the Westinghouse partnership: “at least $80 billion” of new reactors with the government taking upside.
January 2026, DOE writes $2.7 billion to restart American enrichment, $900 million apiece to Centrus, General Matter and Orano.
June 2026, the G7 agrees to push rare earth dependence on any single supplier outside the club below 60% by 2030, ambition 50%.
July, a Defense Production Act determination on recovered minerals.
July 22, Washington and Riyadh sign a 123 civil nuclear agreement, the legal doorway for American firms into a Saudi reactor programme, now sitting before Congress.
August 7, a $400 million loan to build the West’s first primary scandium mine, in Australia, weird.
This is the government systematically buying out every risk that private capital in the West refuses to invest in: price risk (floors), demand risk (offtakes), capital risk (equity and loans), timeline risk (DPA authority).
If you’d described this to a mining financier in 2019 they’d have laughed you out of their office (a repurposed Maersk container). Now they’re asking if the state would underwrite THEIR project too, hopefully they can upgrade to an EverGreen container.
Obviously not all of these commitments weigh the same. A signed statute (the Russian ban) is not a closed loan (DOE’s enrichment money) is not a conditional commitment (Sunrise) is not an investment framework (the Japanese $332 billion project list) is not a political target (10 large reactors under construction by 2030, which is ambition and not a purchase order).
The failure mode of this whole trade is counting tier 5 announcements as a tier 1 cash deposit. The timeline below colours every entry by how hard the commitment actually is.
Frameworks aren’t money.
And if you want to know what happens when one of these left-for-dead critical minerals actually turns, you don’t need a model. You need lithium.
Spodumene bottomed at $597 a tonne in June 2025 (Benchmark Mineral Intelligence, Bloomberg), forgotten, every generalist gone, heck even investors from one of the plants I run left.
13 months later it stood at $2,285. Up 282%.
Nobody got some ‘memo’, the cycle turned and the price simply went.
Now before anyone emails me: lithium had truly washed out, years of it, capacity leaving the industry, and uranium’s commodity never washed out at all.
So the analogy tells you what a turn looks like when it comes.
Put yourself in the chair. You run fuel procurement at a US nuclear utility.
Your reactor has maybe 30 months of inventory sitting in the cycle, your fuel bill is 5-10% of your cost of generation (a gas plant’s is 70%), and your CEO just signed power contracts running to 2044.
Nothing about a $10 move in spot uranium changes your week. You don’t give a shit about the chart Twitter bros are staring at. What you care about is whether pounds EXIST for your 2031 reload, because a reactor without fuel is a very expensive building.
Your bonus tracks the lights staying on, not some rounding error.
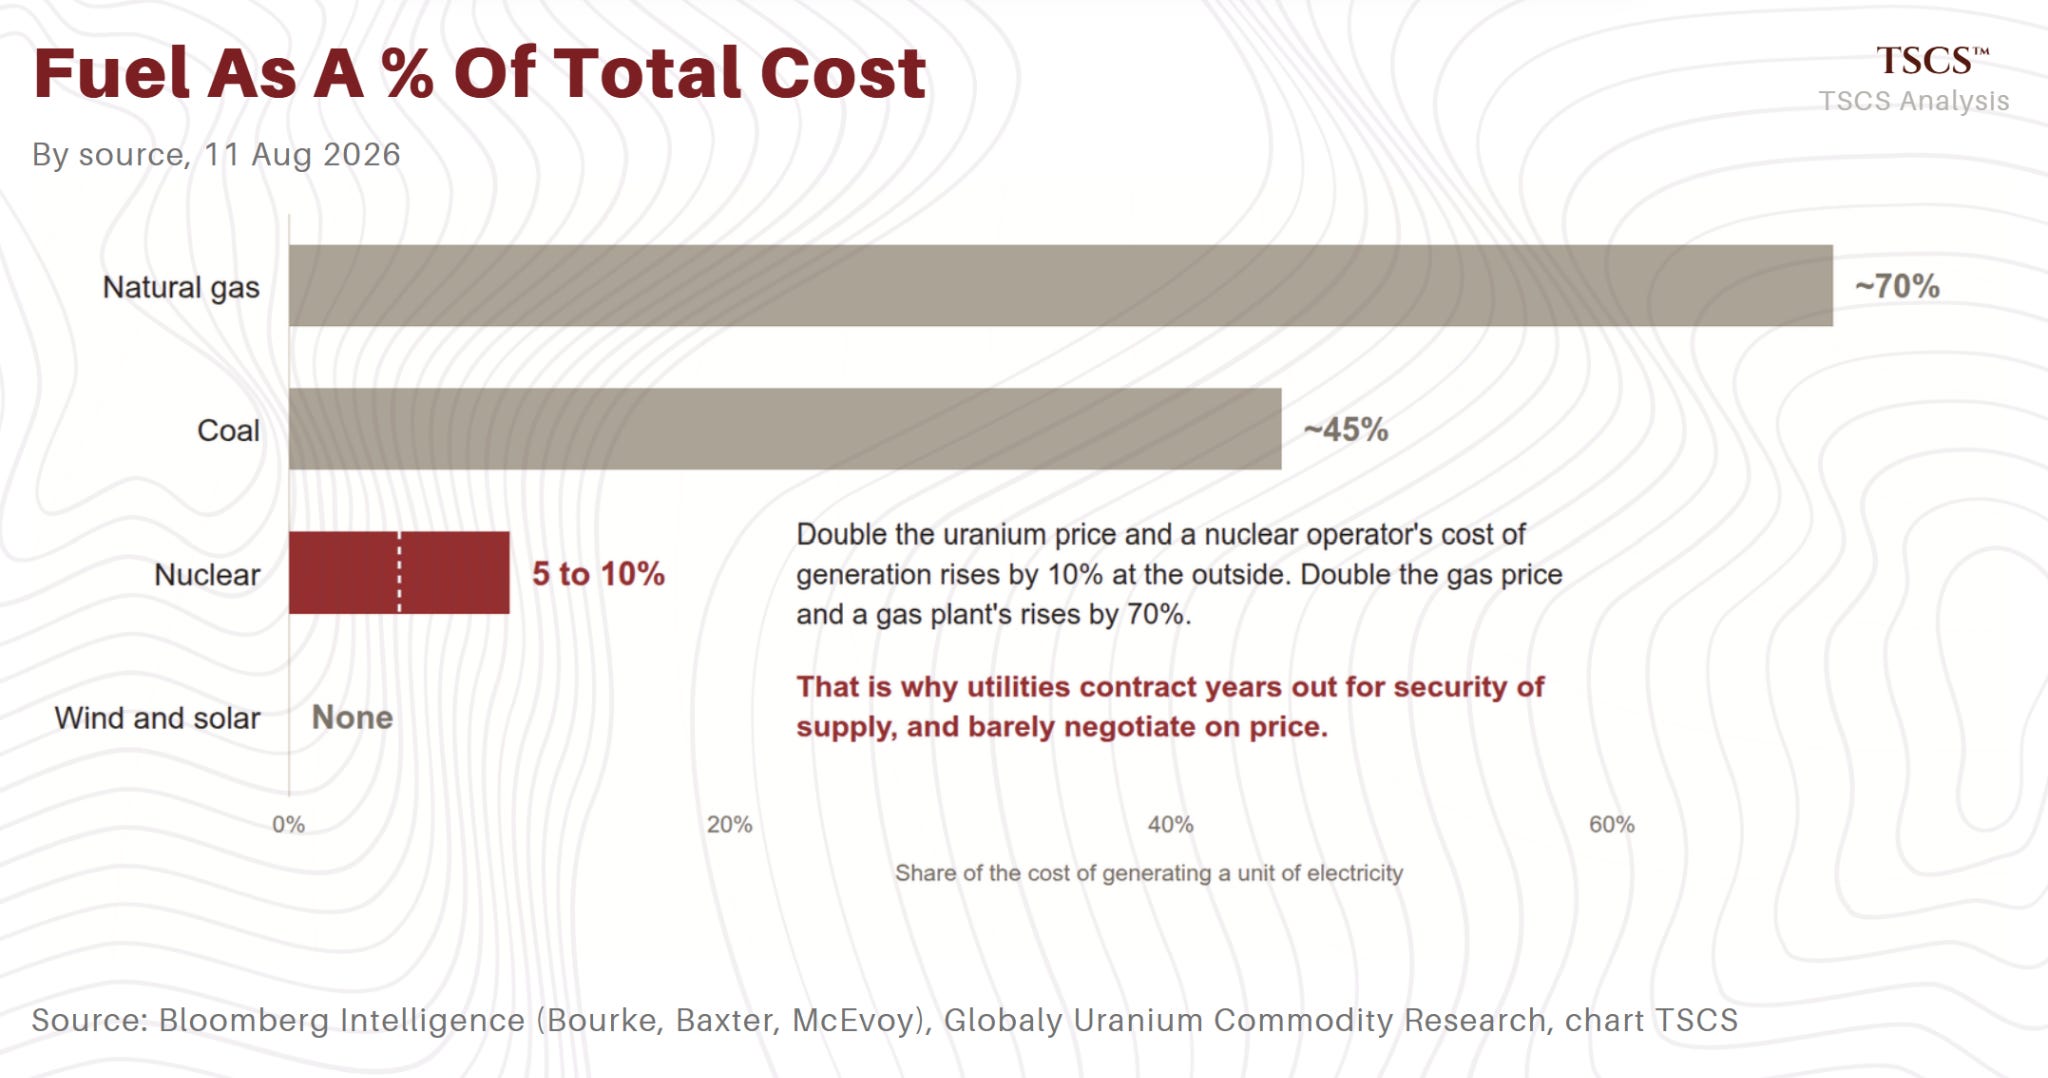
The chair you’re sitting on explains everything in my article (the guy, not the chair).
It explains why demand shows up in the power market first.
Constellation’s Q2 deck: roughly 920 MW of new nuclear PPAs signed at premium prices, average duration 18.5 YEARS, customers investment grade, contracts starting 2029-2031.
License renewals filed for Ginna and Nine Mile Point. Crane, the artist formerly known as Three Mile Island, has its key federal approvals.
About 30% of their expected baseload output is under long-term agreement by 2032.
Electricity locks in first. Always.
Fuel lags a bit, but it’s following. Term price has consistently increased through the first half (UxC month-ends, Yellow Cake’s RNS has the staircase), TradeTech’s marker sits at 97, and the composite finished July at 95.50.
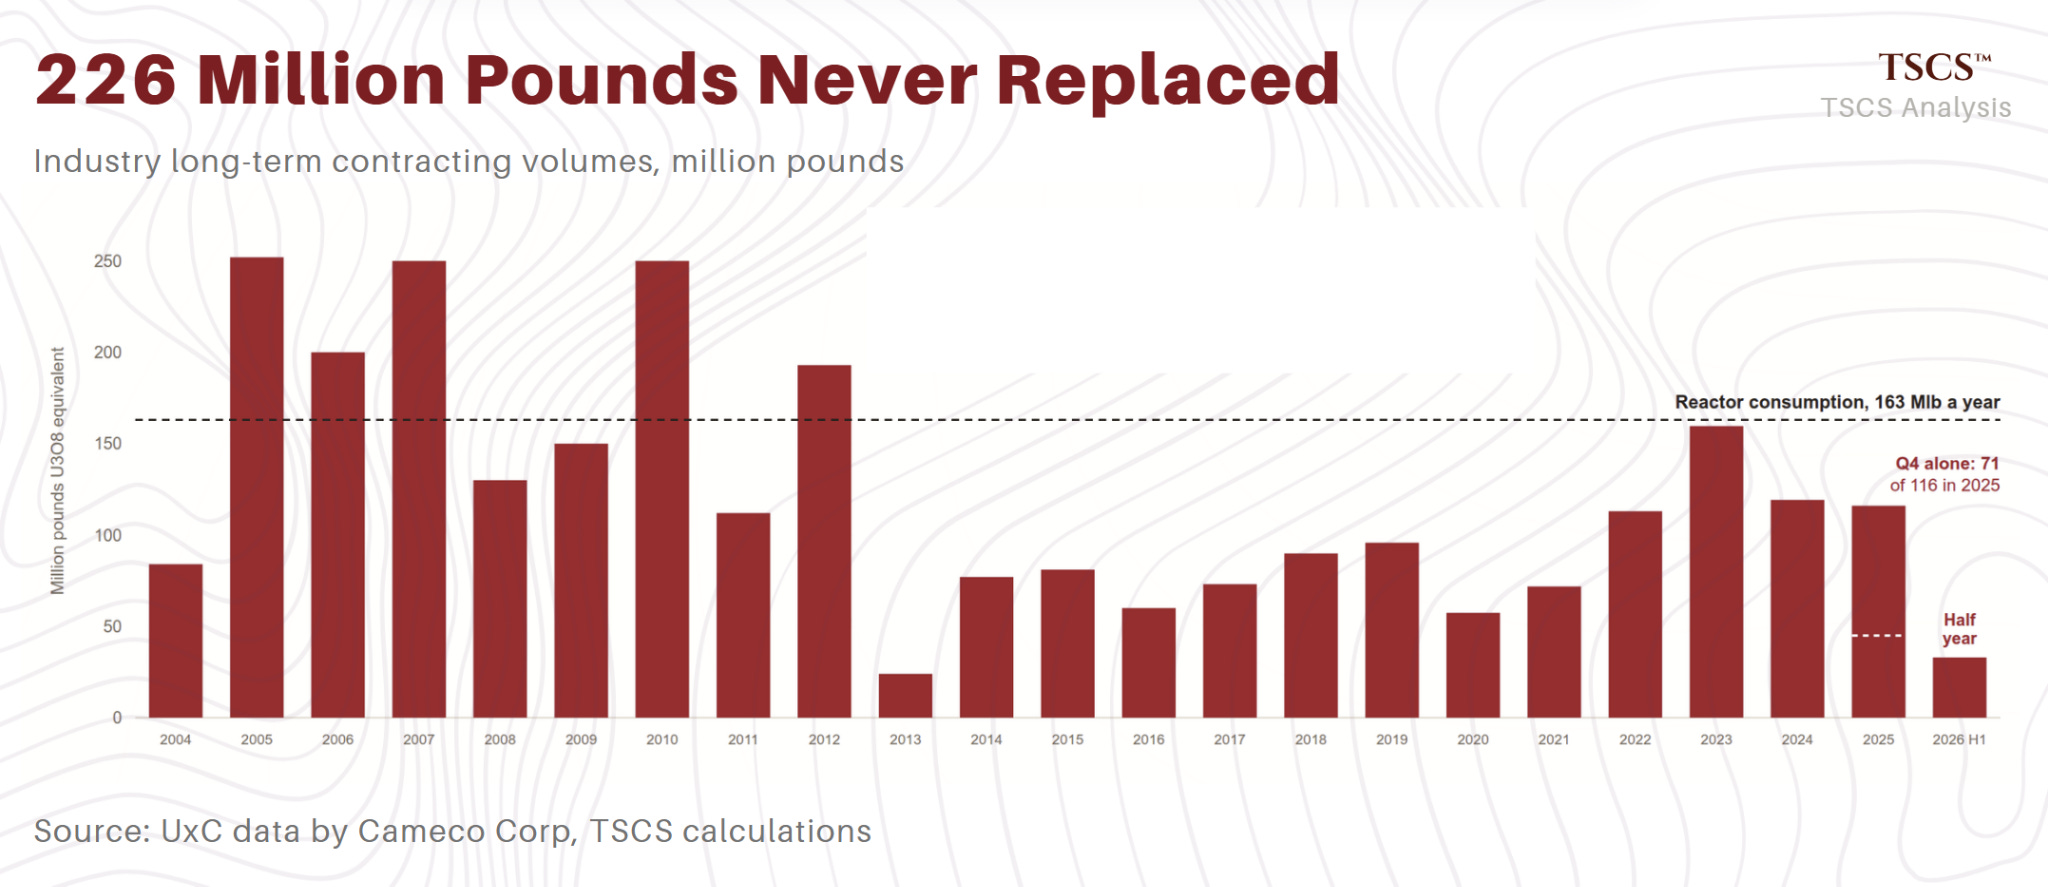
Base-escalated deals are reportedly printing in triple digits. Regular readers know the Q4 number already: roughly 71 million pounds contracted in one quarter, 61% of the whole year.
Now we should put the year itself in a row:
113m in 2022, 160m in 2023, 119m in 2024, 116m in 2025, UxC’s count.
Annual volumes are FLAT. What changed is the shape inside the years. There were 9 dead months and then a 71-pound quarter.
On Cameco’s 5-year ledger they have 589 million pounds contracted against 815 million pounds burned.
Utilities consumed about 163 a year over that stretch and signed 118.
Gaps like these close in lumps, like Q4 did, and the next one has a likely date.
The financial bids are back too, and bigger than the models say.
Bloomberg Intelligence assumes funds absorb about 2.7 million pounds a year. Sprott’s trust bought 6.65 million in the FIRST HALF of 2026 alone, went quiet in early summer, and came back to the market in July.
That’s a through-cycle average. Sprott can only issue at a premium and its spot buying is capped at 9 million pounds a year by its own prospectus. Even so, the average is straining: 8.6 million pounds taken out of the market in 2025 and another 6.65 million in this year’s first half.
Eighteen months of buying has consumed about 5 years of the assumption, and BI’s surplus to 2031 is sensitive to this input.
But Goldman estimates 2026 term volumes are running BELOW their 5-year average through July, and Yellow Cake’s July RNS, citing UxC, calls completed utility term business in the first half “minimal.”
Here’s the exact count, from Cameco’s Q2: around 33 million pounds of term business in H1 against 27 in the same period last year.
The Q4 surge has not continued at scale. The composite term price is up better than 7% since January on the thin volume.
My bearish reading: the 2025 restart was a burst and not a cycle.
My bullish reading: assessed clearing levels are hardening before volume returns, sellers won’t offer cheaper, and the test is whether the next real award cycle validates that.
The World Nuclear Symposium runs September 9-11. Contracting season opens there.
We find out within weeks.
My primer’s enrichment chapter argued the real chokepoint was further down the chain, and it aged well: spot SWU is $200, more than tripling in 5 years, still the largest single slice of a fuel bill at 30-40%, while conversion has finally started easing, down 9% over 12 months.
The whole fuel chain repriced 2-3 times over.
So here’s the thesis. I’m not bullish “inevitable demand.”
That’s been the most crowded sentence in this sector and Cameco at 70x forward earnings has already been paid for a lot of it. I’m bullish the contracting cycle: the multiyear process, badly mispriced by everyone staring at spot, of utilities converting a decade of announced reactors into signed pounds.
And I’ll state the condition of this claim: so far the PRICE has moved and the volume hasn’t confirmed it. That makes this more of a hypothesis with a decent dated kill switch.
If term volumes don’t recover through the second half, if the RFPs stall, Sprott goes quiet again and the term gets nearer to spot, I’ll be wrong for this specific thesis.
Ok let’s actually price this. The three supply models can’t agree on the sign of this year’s balance. I’ll look at which of the three completely different trades using the “uranium” ticker you actually own, and what I see as the best asset in this sector that nobody will buy, and the dated kill-switch dashboard.
Let’s get into it.
Comments
Nothing yet. Say the first thing.
Sign in to join the conversation.