
Troy Tassier is a professor of economics at Fordham University and the author of The Rich Flee and the Poor Take the Bus: How Our Unequal Society Fails Us during Outbreaks.
For years movie producers have lamented declining box office sales. Independent theaters and many corporate theaters have closed. However, in November last year, it seemed as though things turned around. All of sudden box office ticket sales nearly doubled as they soared to an increase of over $365 million. Compared to the previous month sales of the average movie had doubled. All was good. Yet, producers still didn’t feel good about the future. Why?
Many of you have already suspected the trick above. Ticket sales in November contained two box office smashes, the Wicked sequel, Wicked: For the Good and Zootopia 2. If we took away the sales from those two movies, ticket sales would have fallen by about $62 million compared to October. In essence, very little had changed in the big picture of the box office.
In many ways we are seeing the same thing with our economy. President Trump and President Biden before him, along with much of the media, keep extolling gains in GDP, the stock market, average income or low unemployment rates. The media in particular talks about how those average and aggregate statistics are at odds with how people “feel” about the economy as consumer sentiment continues dropping.
Yet, it isn’t just a feeling. There is real data that show why people are hurting but we are stuck in old times believing a rising tide lifts all boats and ignoring those who have fallen overboard.
First of all, many low income professions simply have not yet fully recovered (and may never) from the setback of the Covid pandemic. The graph below comes from Opportunity Insight, a collection of economic researchers at Harvard and Brown universities and supported by the Bill and Melinda Gates Foundation. The graph presents the change in employment in various industries since January 1, 2020. The number of people employed is set to a baseline of 100. Deviations from the baseline are percentage changes in employment.
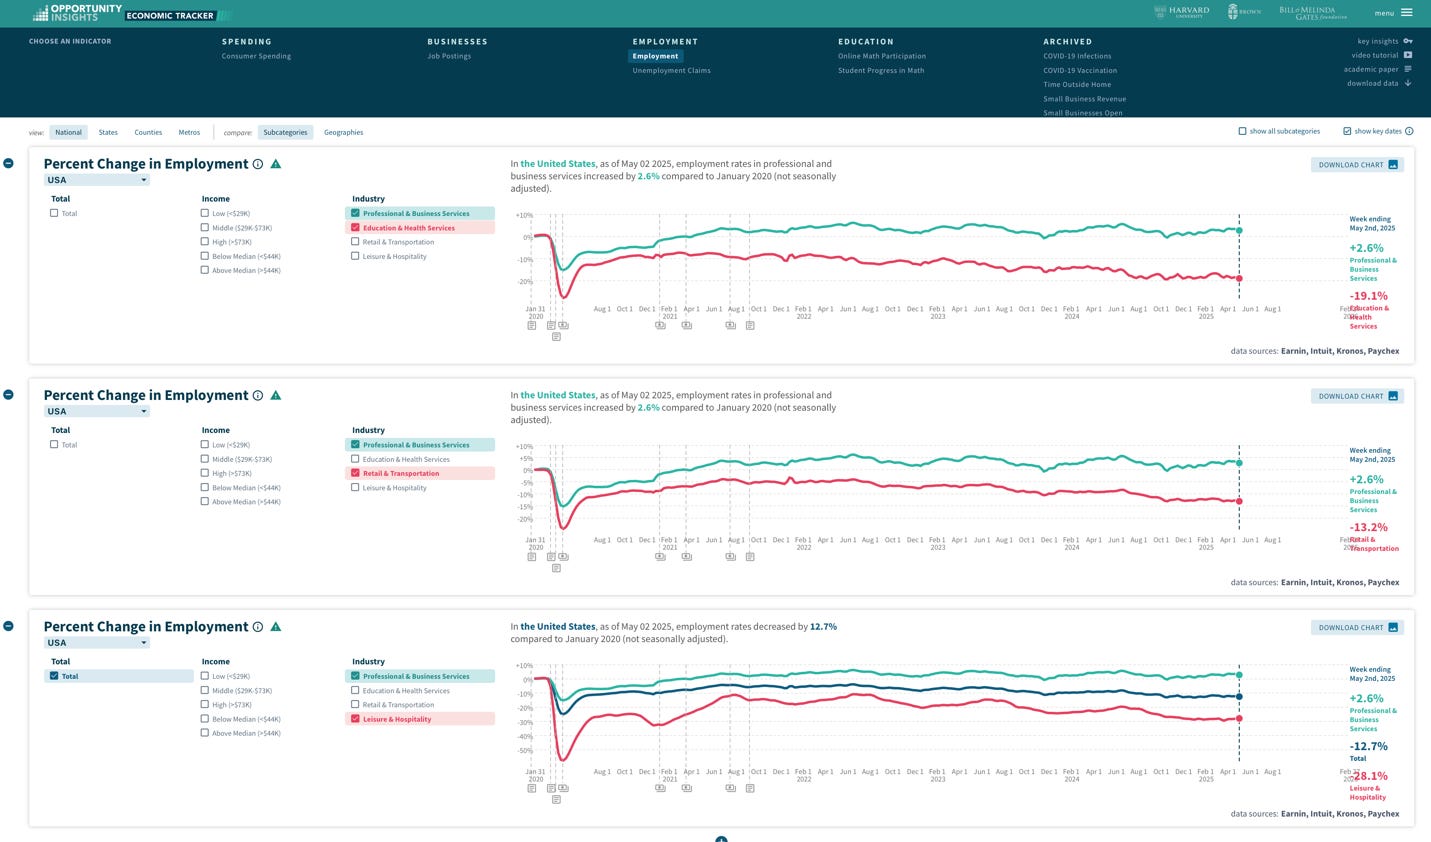
As you see in the top panel of the graph, the professional and business services industry (shown in green) has increased employment by 2.6%. In other words, for every 100 people employed in this industry on January 1, 2020, 102.6 people are employed today. All of the other industries listed, (Education and health services, retail and transportation, leisure and hospitality) have significant decreases in employment. For every 100 people employed in these industries on January 1, 2020, 13 to 28 fewer people are employed in each of these industries.
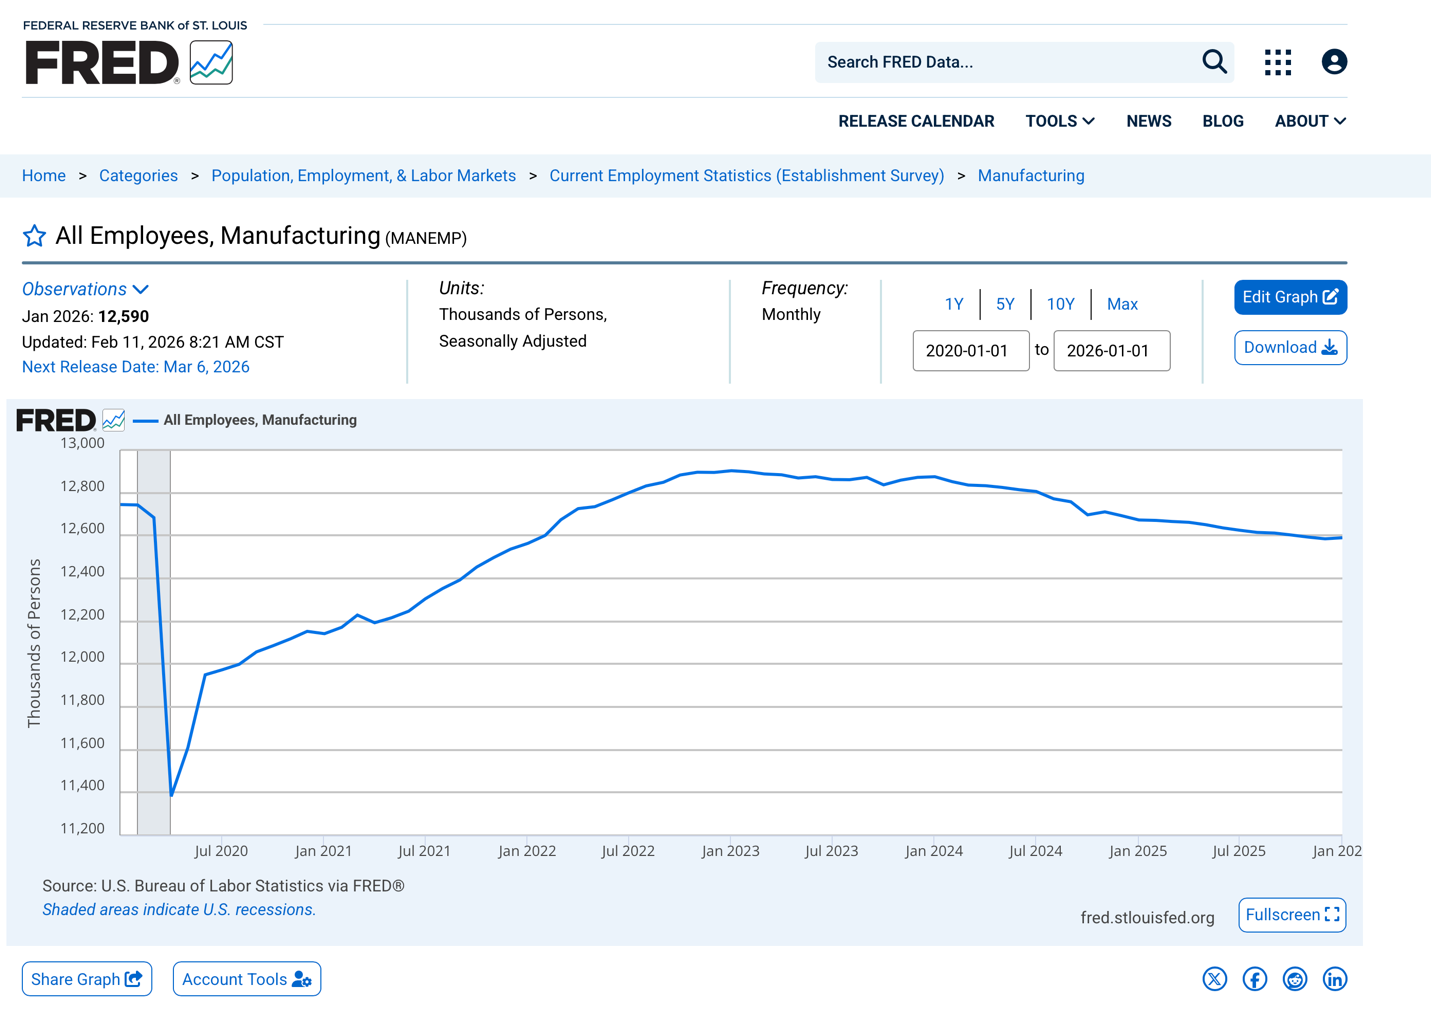
You see a similar trend in manufacturing jobs. After a precipitous fall in 2020, manufacturing jobs rebounded to surpass pre-pandemic levels by the middle of 2022. Yet today we sit with about 1.3% fewer manufacturing jobs than we had on January 1, 2020. As Bruce Springsteen prophesized over three decades ago, “These jobs are goin, boys, and they ain’t coming back.”
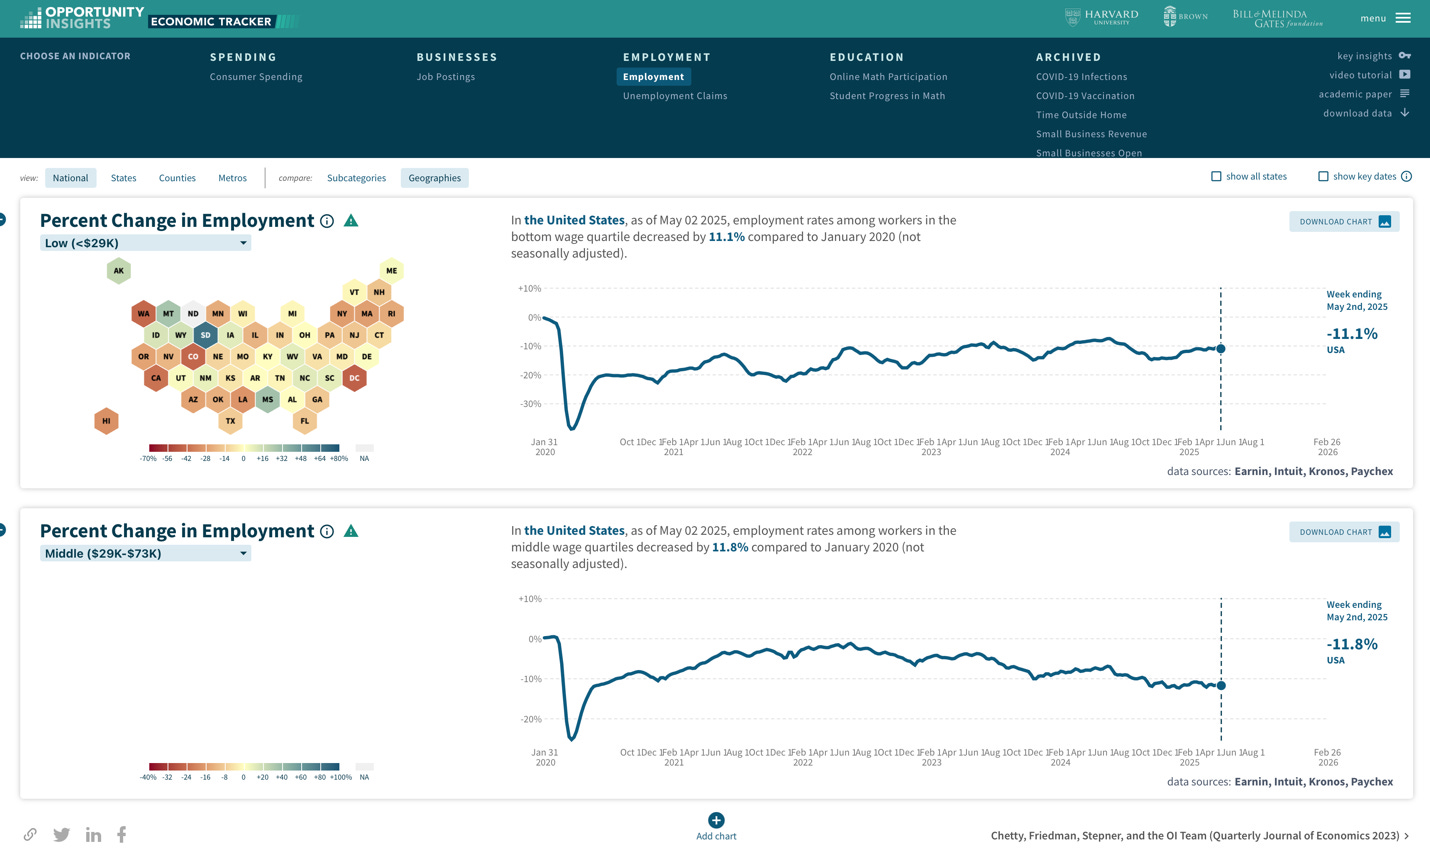
You can see hardship if you divide the population up by income as well. Of the group of people who make less than $73,000 a year, employment has dropped by about 11%.
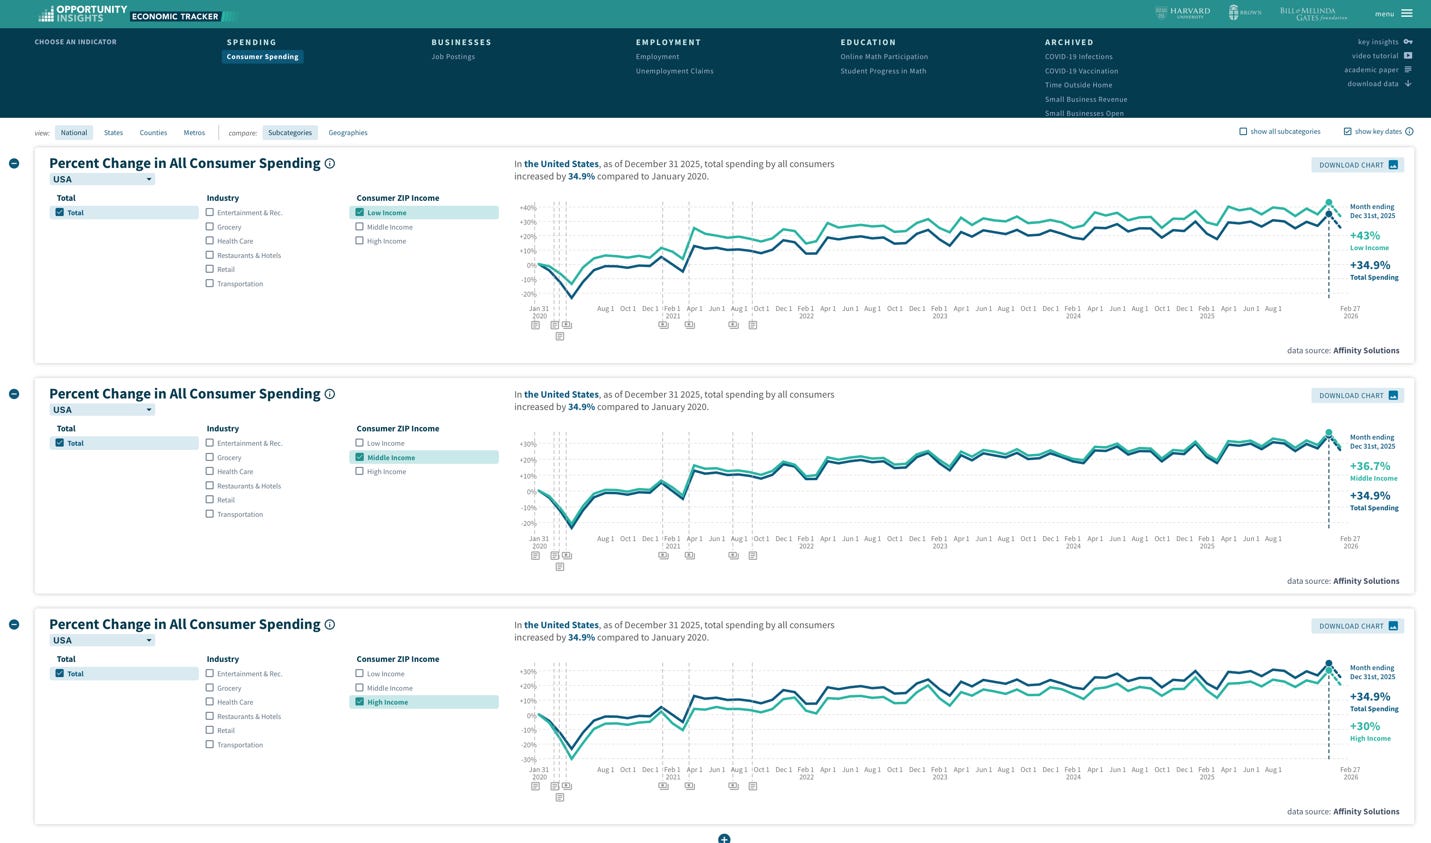
At the same time consumer spending has shot up due to inflation. As I discuss at the end of chapter 5 in my recent book, inflation impacts consumers in different ways. Typically, the lower your income, the larger the percentage of your income that is spent on necessities like food, shelter and clothing. This is why you see consumer spending since the onset of the pandemic increasing by more in low and middle income groups than it has for the wealthy. Wealthy people can simply forgo a vacation if the price increases too much for their liking. A low-income family can’t forgo food and rent. Inflation hurts those at the bottom more than those at the top.
I put these graphs together in about an hour. It didn’t take long to find the data demonstrating the “feeling” that all is not well. The feeling present in ailing consumer sentiment reports doesn’t come in contradiction to economic data. The feeling comes because people are hurting and the the data shows why if we stop focusing on averages and aggregates. When we focus on the aggregates and averages we are ignoring the plight of those who do not sit at the top of the income distribution.
As wee do so, rich folks are enjoying the view of Dow Jones skyrocketing above 50,000 and consistent increases in GDP while they sit on their yachts sipping martinis. They feel pretty good as they enjoy a unique place at the top. The producers of Wicked and Zootopia feel pretty good too. But the feelings of the rich don’t match the statistics of the rest.
Troy Tassier is a professor of economics at Fordham University and the author of The Rich Flee and the Poor Take the Bus: How Our Unequal Society Fails Us during Outbreaks.
No posts
Comments
Nothing yet. Say the first thing.
Sign in to join the conversation.