
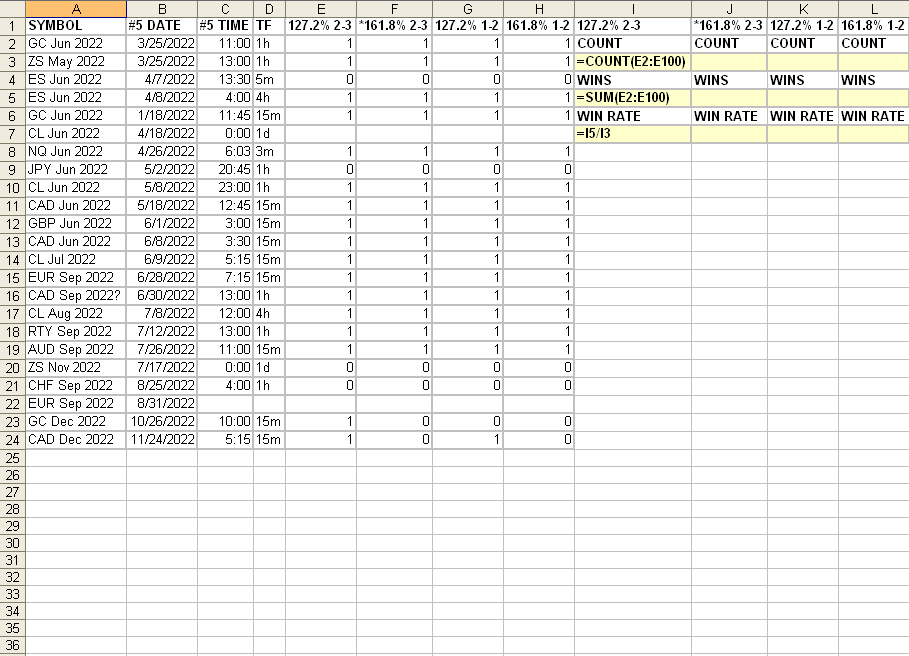
Let’s say you’re doing a study of a particular trading strategy and you want to track the Win Rate using different Targets. Column E-H above represents 4 different possible Targets. The names of those Targets are repeated in column I-L to hold the summary statistics. I like to save a one (1) or a zero (0) where the 1 represents when the attribute is true. In this case, the attribute would be that the trade hit its Target for a win.
This enables me to easily calculate statistics by using the spreadsheet functions COUNT() and SUM(). These are among the simplest functions for calculating statistics. There are other more complex functions you can use. This post is just about the advantage of creating columns for all the pertinent attributes you want to study and using 1’s and 0’s as values.
The COUNT() function will count all the occurrences of values in the range. The ranges in the example spreadsheet above are the rows of data vertically underneath the column headings. Notice there are some blank rows imbedded in the data range. These are trades I haven’t collected the data for yet. The COUNT() function will ignore these blank rows, as well as all the unused rows under the collected data. Notice the range is row 2 to row 100. But row 25 and below are blank. The COUNT() function will ignore these blank rows. Specifying a range larger than you need, at least for a while, relieves you of the need to keep changing the range when you add more data.
The SUM() function will add up all the 1’s and tell you how many events in that range are true, or in this example, hit their Target. This is where using 1’s and 0’s pays off.
So now its simple to calculate the Win Rate by dividing the number of wins by the number of trades.
You can also create a column where you store a 1 or 0 based on a combination of other columns. Then you can calculate statistics for when those combinations of attributes are true.
For example, you could use the TF column, the timeframe of the chart on which the trade was based, to get the Win Rate for just those trades on a 5 minute chart. And do the same for all the timeframes.
If you’re curious, the example spreadsheet above was taken from a study in progress for a pattern known as a 1-3-5 pattern I learned from Larry Pesavento.
By the way, its just a style thing, but I like to highlight cells with calculations. This distinguishes what cells are pure collected data and which are calculations based on the collected data. That’s why some fields are highlighted in yellow on the sample spreadsheet above.
No posts
Comments
Nothing yet. Say the first thing.
Sign in to join the conversation.