

A well-known finance paper showed that an AI model could read a news headline about a company and say, better than chance, which way the stock would move. The same paper predicted the effect would fade as more traders started using the same tools.
We tested that prediction with 2026 data, a different AI model, and about 850 US companies. The effect has not faded. But it only appears for companies with enough news coverage that day for the score to mean anything — and our own scoring formula had been obscuring that, because it treated a company with one positive headline exactly like a company with twenty.
We are not claiming that any of this makes money. The amounts involved are small enough that ordinary trading costs would likely consume them. Think of what follows as a study of how markets digest news, not a tip sheet.
In 2023, Alejandro Lopez-Lira and Yuehua Tang gave an AI model 159,137 news headlines about US companies and asked one question of each: is this good or bad for the stock?
The answers tracked the market’s immediate reaction remarkably well, and they also predicted a small amount of further movement the following day.
They then argued that this could not last. If the AI’s advantage comes from a gap between what it can read and what the price already reflects, then as more traders use AI the gap closes. Their own data shows this happening: the strategy’s risk-adjusted return falls steadily from late 2021 through early 2024, shrinking to roughly a fifth of its original size.
Their data ends in May 2024. Ours runs into 2026, after two more years of exactly the adoption they predicted would erode the effect. So we can check.
Every night we collect news headlines for about 850 US companies across all nine major sectors. For each headline, an AI model answers a single narrow question: is this new, specific, verifiable information that would move this particular company’s stock?
The default answer is no. Most headlines are commentary, recaps, roundups, or restatements of things already known, and the model is instructed to treat all of those as neutral. Roughly eight headlines in ten get “no.”
For each company each day we then count the positive headlines, subtract the negative ones, and divide by the total. That gives a score between −1 and +1.
One filter matters enough to mention. News searches overreach badly: a search for the salad chain Sweetgreen, which trades under the symbol SG, returns articles about Singapore and Société Générale. A search for Bio-Techne, which trades as TECH, returns most of the technology sector. Since late June, a filter checks whether each article is actually about the company it was attached to, and discards it if not.
Each day we split companies into two groups: those whose news was net positive, and those whose news was net negative. We then average the stock returns in each group and take the difference.
Call that difference the gap. A gap of +0.5% means companies with good news outperformed companies with bad news by half a percentage point. It is a difference between two groups, not a return anyone earned.
We measure the gap on the day the news lands, the day after, and the two days after that.
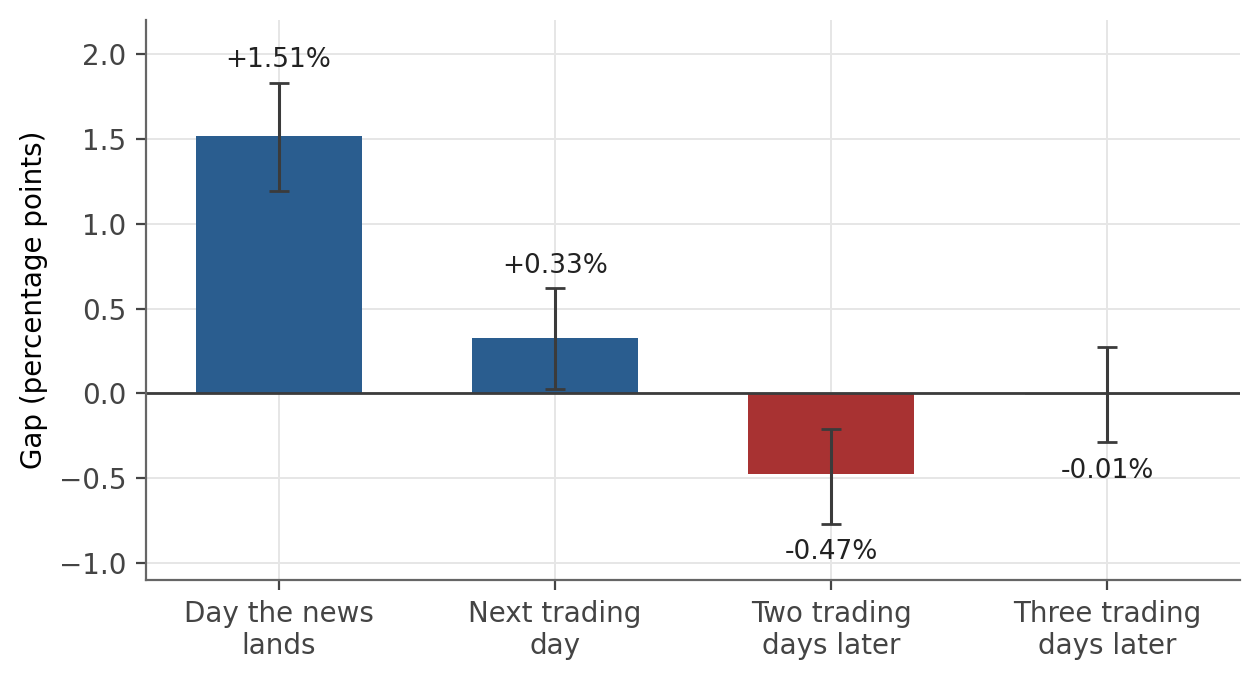
The gap on the day the news lands is roughly five times larger than on any later day. But by the time you have read a headline, the market has read it too. This is the part of the effect nobody outside the market can act on. “Trading day” means a day the market is open. Friday’s news and Monday’s return are one trading day apart, though three calendar days.
The bars show our best estimate; the whiskers show how much the estimate could reasonably move given only six weeks of data. Where a whisker crosses zero, the data cannot distinguish the result from zero.
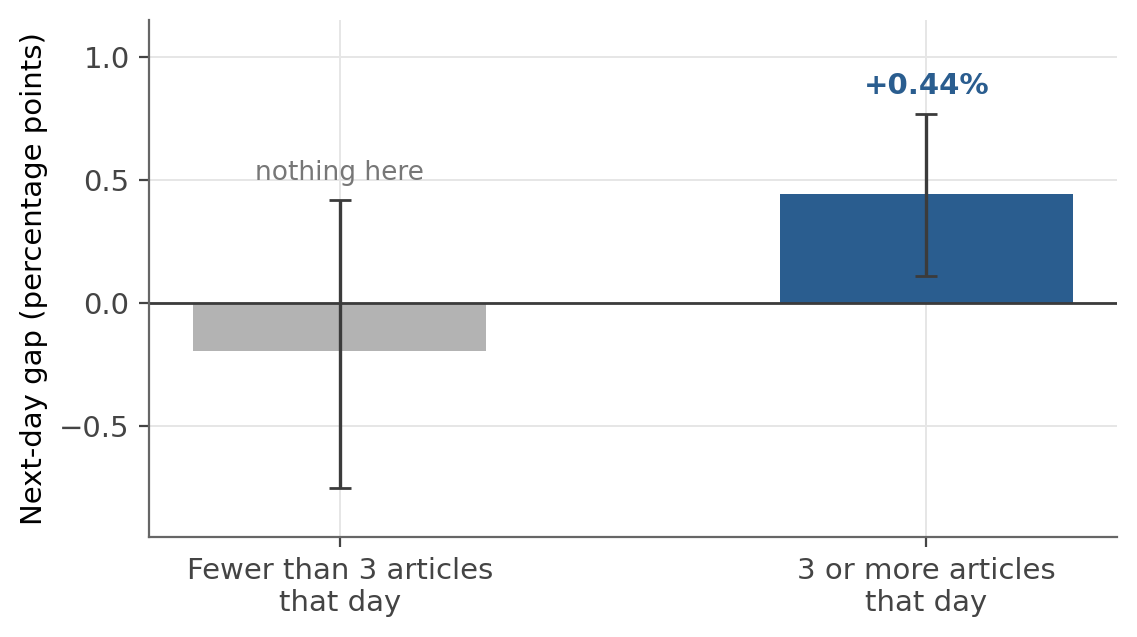
On company-days with fewer than three articles, there is no next-day effect at all. On days with three or more, there is.
This is the finding we did not expect. Our score divides good news minus bad news by the total number of articles , which is an average, and an average throws away how much it was averaging over. A company with a single positive headline scores a perfect +1. A company with eight positives and two negatives scores +0.6.
The first looks stronger on paper, yet it tells you almost nothing. Nine times in ten, a perfect score of +1 or −1 is simply a day on which only one or two articles appeared.
Once we separate those thin days from the well-covered ones, the next-day gap on the well-covered group is +0.45%, and it is clearly distinguishable from chance.
Companies with good news underperform on the second day, and companies with bad news outperform, giving back roughly a third of the first day’s gap. This is not the effect fading. It is simply crossing over to the other side.
We checked whether this was an artifact of small, thinly traded stocks, where prices bounce around for mechanical reasons. It is not: the reversal appears among the largest companies in our universe, with a median market value of $98 billion. We do not yet have a firm explanation. The most natural candidate is investor overreaction. Prices are pushed a little too far by the initial news, then drift back. But for now that is a hypothesis, not a finding.
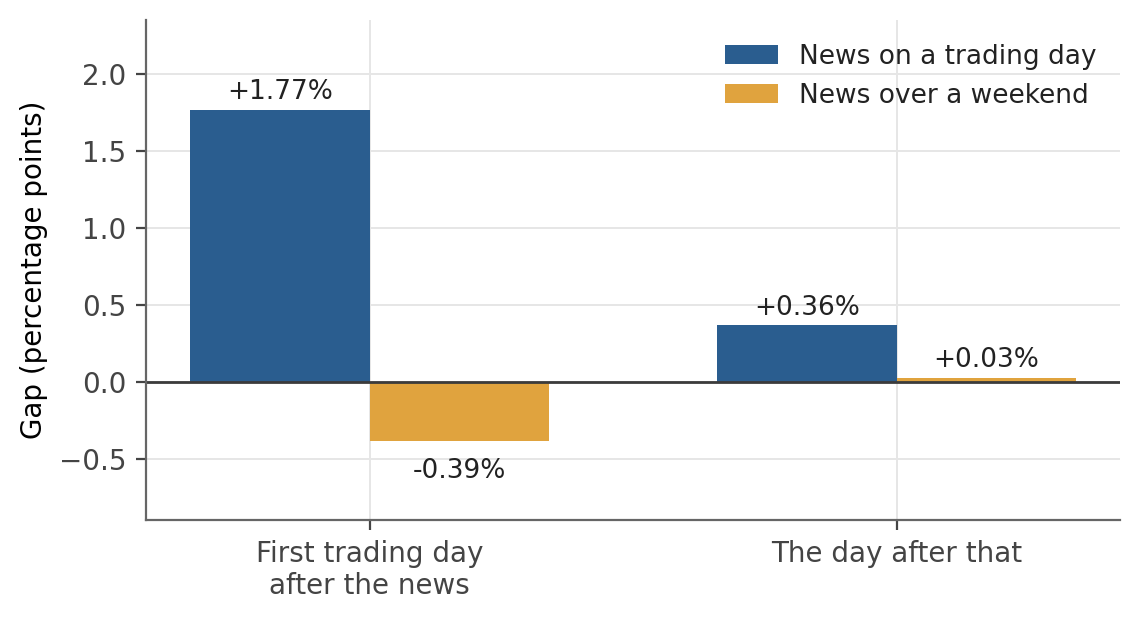
News published while the market is open shows a large same-day gap. News published over a weekend shows none.
This is a useful clue about what we are actually measuring. An article published at two in the afternoon can describe a move that happened at eleven in the morning. An article published on a Saturday cannot, because there was no trading.
If the same-day gap were the market absorbing new information, weekend news should show it on Monday. It doesn’t. That suggests a good deal of what we score as “news” is journalism describing a move that has already happened, which is worth knowing, and which we intend to test directly.
The obvious way to check a result like this is to ask whether it is bigger than zero. That test is too easy to pass. Markets have their own structure. Some companies simply rose over these six weeks, some days were good for everything, and a statistic can pick up that structure and make it look like a discovery.
So, we use a harder test. We take our real sentiment scores and deliberately scramble them, a thousand times, so they land on the wrong days or the wrong companies. Then we rerun the entire calculation on the nonsense.
If our real result sits inside the range that scrambled data produces, we have found nothing.
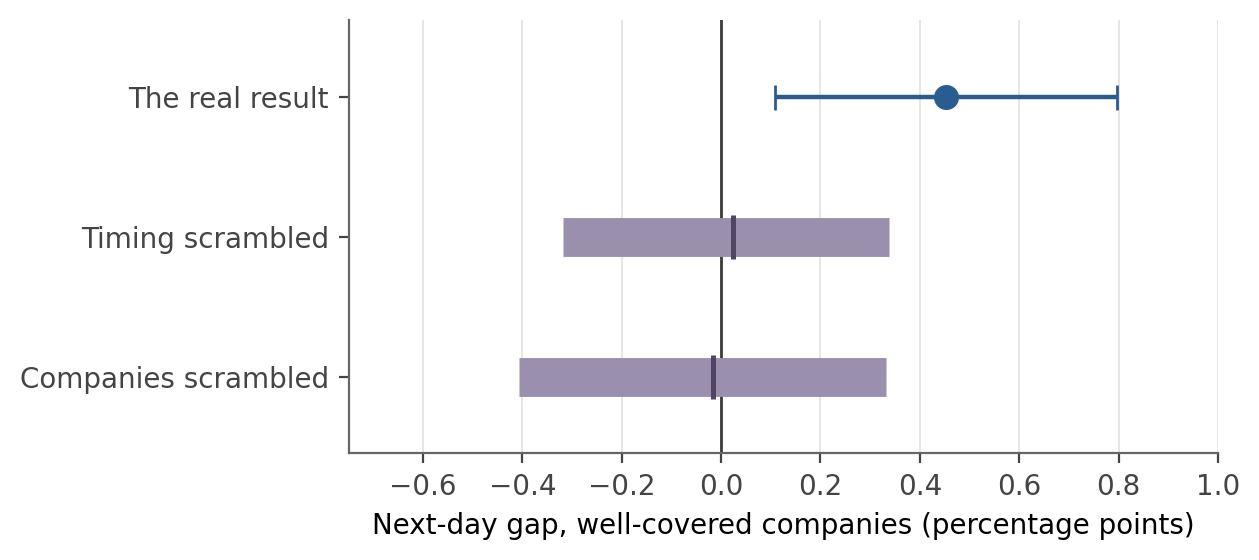
The purple bands show what scrambled data produces, the middle 95% of a thousand scrambled runs, with the tick marking the typical one. The real result, in blue, sits outside both.
We run two versions of the scramble, because there are two ways a result can be an illusion. One shuffles each company’s scores across days, which destroys when the news arrived while keeping which companies had good news. The other shuffles across companies within a day, which destroys which company the news was about while keeping the day’s overall market mood.
A real signal has to beat both. This one does, roughly four scrambled runs in a thousand did as well.
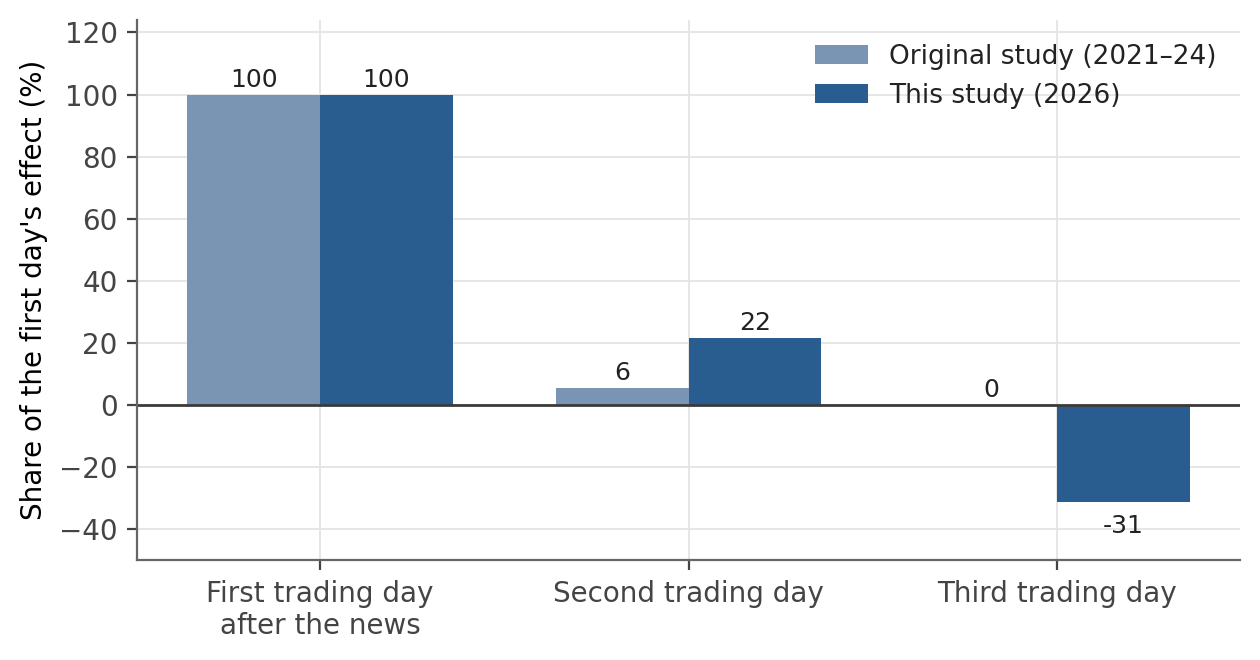
Both studies scaled so that their own first trading day’s effect equals 100.
The shapes agree on the first two days: a large immediate reaction, a small residue the next day. They part company on the third day, where their effect has faded to nothing and ours turns negative.
We are deliberately not putting our numbers next to theirs and calling it a replication. They had finer data than we do: the exact minute each article appeared, and opening as well as closing prices. That lets them separate the overnight jump from the trading day that follows. Our measurement blends the two. The agreement here is in the shape, not the digits.
The finding that matters is simpler, and it is worth stating plainly: two years further into the AI adoption that was supposed to erase this effect, with a different model and a different universe of companies, the effect is still there.
That this makes money. The gaps we measure are small enough that ordinary trading costs would likely consume them. The original authors found their own, larger effect unprofitable once costs reached twenty basis points per round trip. We have not built a strategy, tested one, or traded one.
That the news causes the move. Our weekend result raises a real possibility that much of what we measure is coverage following a price move rather than news preceding it. We have a test for this but have not yet run it. Stay tuned.
That six weeks settles anything. This is one window. We have a re-test scheduled for September, and we will report the results whichever way they come out.
The most valuable change is also the most obvious one: separating news that arrives while the market is closed from news that arrives while it is open. Those are different situations, and we currently blend them. It is the difference between “the market has not yet seen this” and “the market saw this an hour ago.”
Beyond that: testing whether the effect differs by the kind of news, for example earnings figures behave differently from analyst opinions and insider-trading disclosures. The original study found that insider transactions were the single category markets absorb most slowly, which makes it an attractive next analysis.
If you take three things away from this piece, let them be these.
The signal is still there. In 2026, with a different model and a different set of companies, news sentiment still predicts a small piece of the next day’s returns. The decay the original authors expected has not yet arrived.
But only where there is enough news. One headline is an anecdote; three or more begin to be a signal. The next-day effect lives entirely in the well-covered names. Our own averaging had been hiding that from us.
And it is knowledge, not income. The gaps are real but small, and ordinary trading costs would likely swallow them. What survives is the more interesting claim: markets still seem to need about a day to fully digest the news they are given.
Thank you for reading. If you spot a hole in the reasoning, or have a suggestion for what we should test next, comments are open and we would be glad to hear from you. The September re-test is already on the calendar.
A fuller version of this analysis, including the statistical detail, the alternative treatments we tried, and the errors we found and corrected along the way, is available for readers who want it — just ask.
No posts
Comments
Nothing yet. Say the first thing.
Sign in to join the conversation.