
Structural Context (Free)
Company Overview
Analysts’ Outlook
TizyCharts Setup & Chart
Weekly Ranking Snapshot
Swing Portfolio Dashboard Access
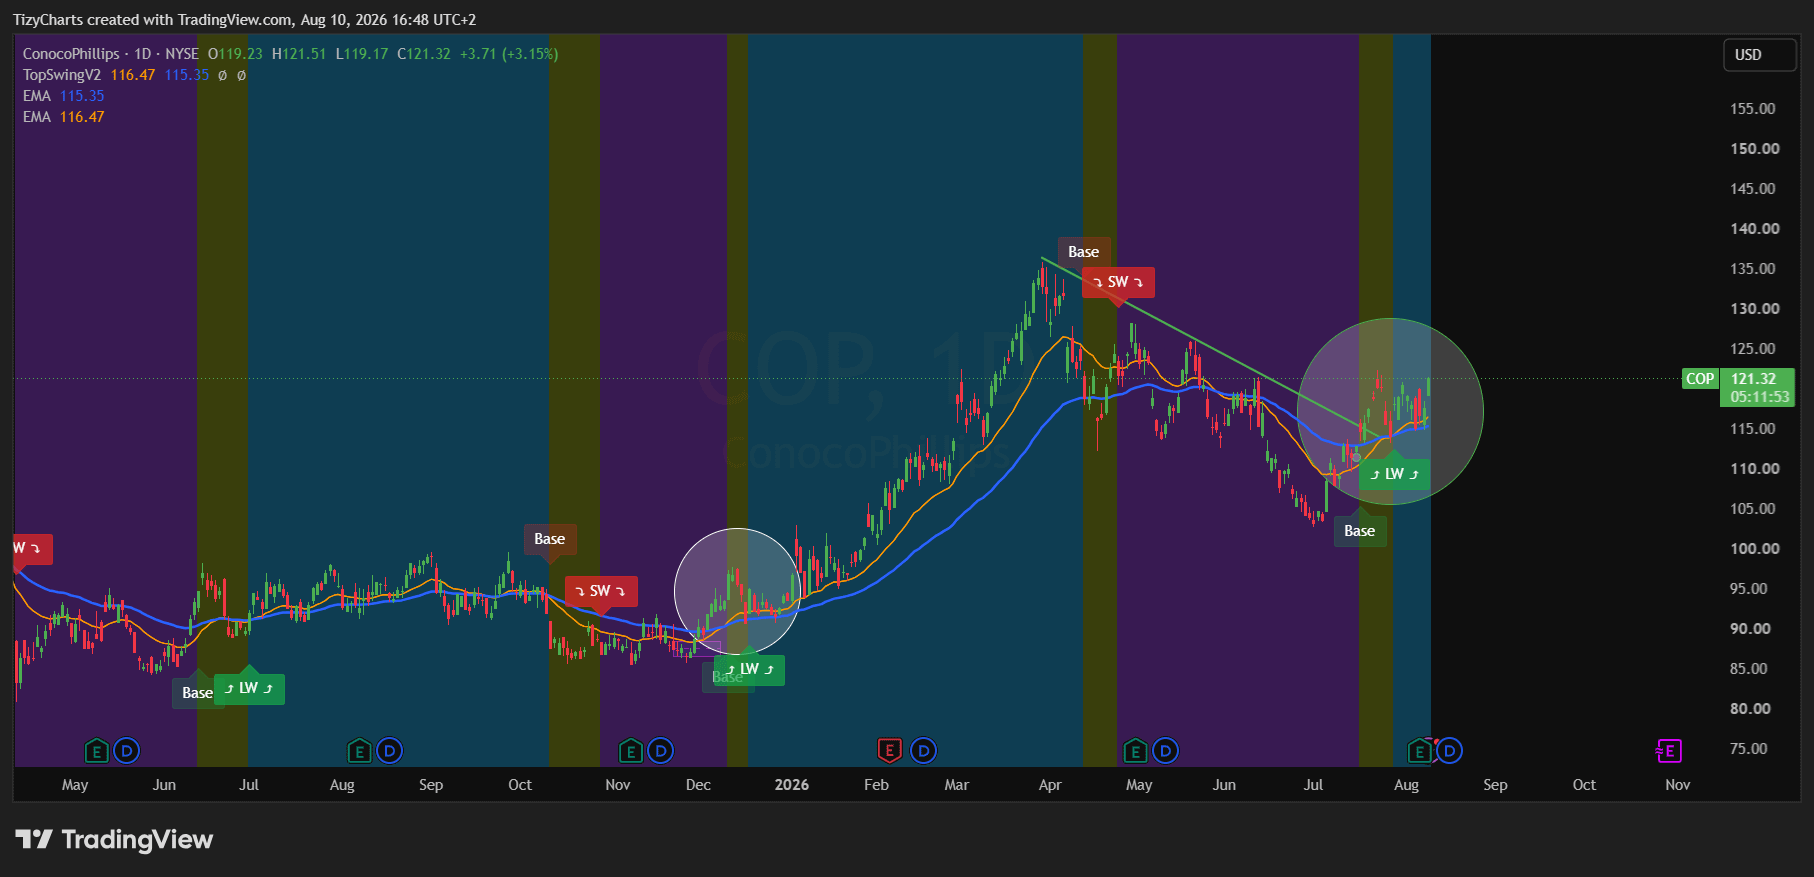
A new long setup has entered the TopSwingV2 framework, this time on $COP.
The stock already corrected roughly 25% from its previous highs.
That reset is behind us.
Since then, the structure has completely changed.
The bullish crossover is confirmed.
The LongWave is active.
And the first pullback — roughly 9% — has already happened without breaking the new structure.
That’s exactly the sequence I want to see.
Correction.
Structural reversal.
LongWave.
Pullback.
And now we’re waiting for fresh bullish price action.
The setup isn’t trying to become bullish.
It already is.
The next step is activation.
And that’s the important difference between seeing a chart from the outside and following the framework from the inside.
PRO members already have the activation area, invalidation, risk and extension levels before the outcome is known.
YTD Performance: +71.09%
Outcome of Active Setups: +23.23%
Overall Outcome (All-In Risk Management – S.T.): +412.42%
Overall Outcome (Balanced Risk Management – S.T.): +334.85%
Several setups are currently active and being tracked day by day.
The public side shows the structure.
Inside PRO, members follow the complete sequence : activation, invalidation, extensions and every structural update as it unfolds.
Comments
Nothing yet. Say the first thing.
Sign in to join the conversation.