
Two new analyses are out on thinkvalue.co:
Understanding Palantir’s Premium: AIP, Network Effects, and the Minerva Hypothesis
The goal of this analysis was to understand what drives PLTR’s growth, valuation and perform a reverse-DCF in order to reveal the required performance from the company in order to justify the current price.
High Payback Periods, Low Margins: The Challenges of Wind Energy Investing in 2025
The analysis is meant to reveal at which electricity price level are windmills a viable investment, as well as analyzing the business performance of 6 companies with exposure to the wind energy industry.
I have also been rolling out updates on the app itself.
You can now save your models locally and export them as a shareable link for use on your other devices or if you want to send them to someone else.
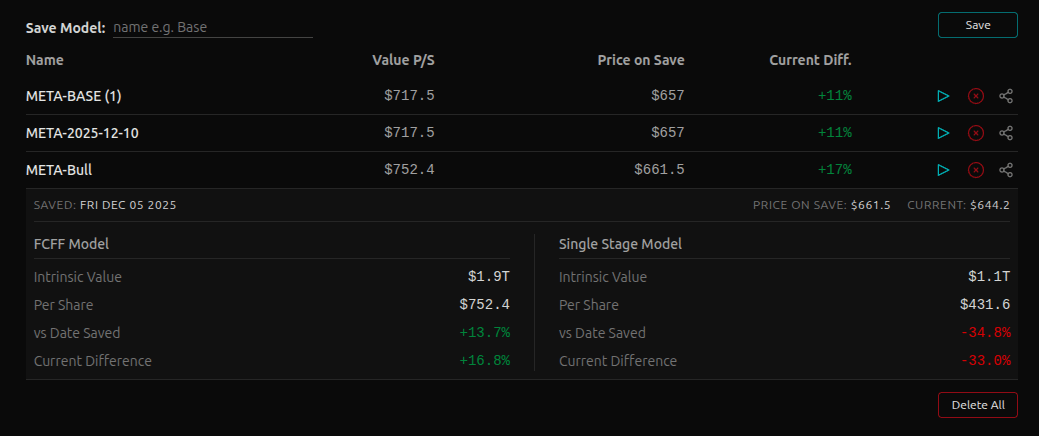
The output compares the price to your valuation at the date you published your model, and compared to the current date, so that you can see how your thesis is performing over time.
You can review how financial items changed over a multi-year period using the CAGR calculation, and get better visibility with the sparkline charts above every item.
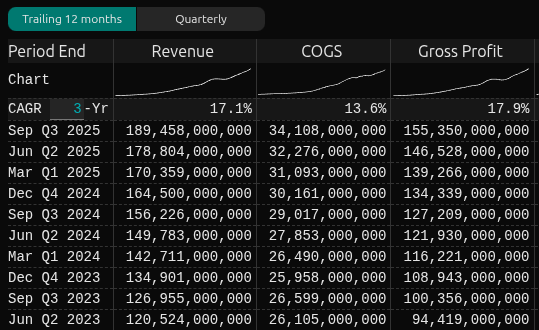
The CAGR value is customizable.
The new value-line incorporates a 2-year forecast on the change in value over the forecast period. This analysis uses a pull-forward method and is experimental at the moment, and is meant to reveal the value gain of a company as time goes by.
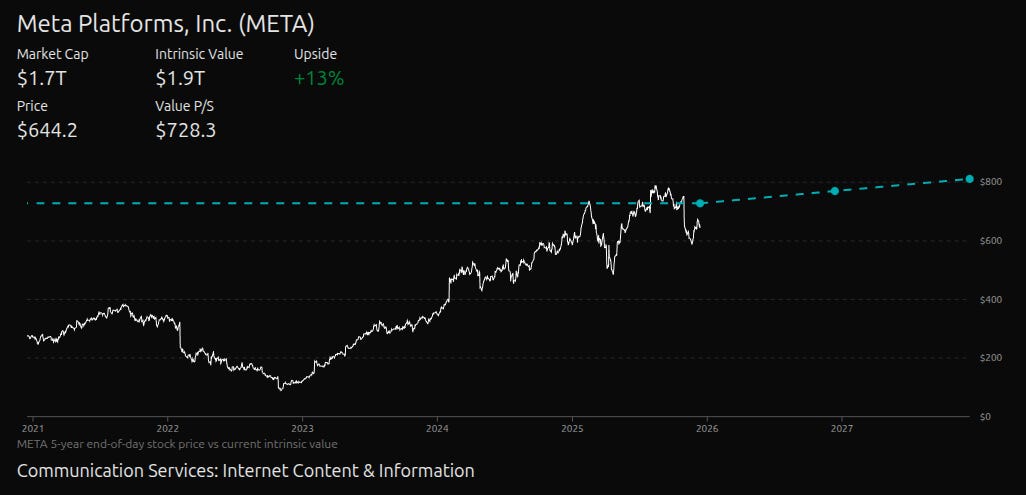
The hypothesis is that higher ROIC + growth companies will see a higher increase in their value growth over time. It also allows you to compare the value of a company across the years and see how long an investor needs to hold a premium stock in order for it to break-even on the fundamentals.
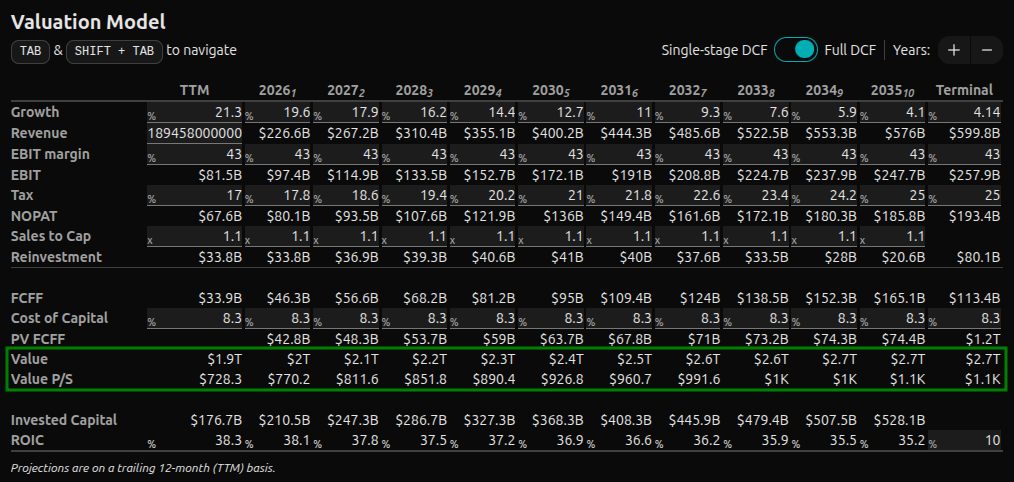
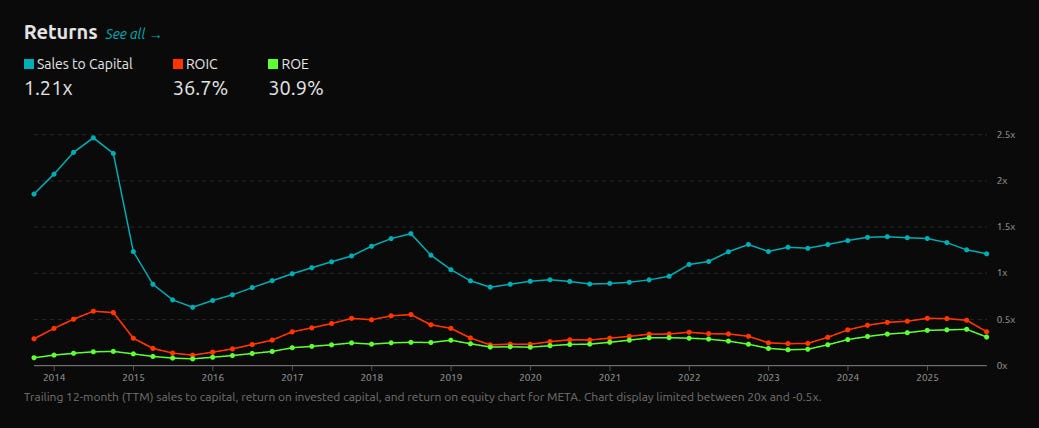
The first analysis is the returns over time section including: ROE, ROIC, and Sales to Capital. The goal of this analysis is to help with the reinvestment estimate when creating a valuation model.
The corresponding drill-down section also includes return on assets (ROA), and compares every metric with their average equivalent.
The second analysis is the dividends and buybacks section where you can see how much a company is returning cash to investors and compare it to the market cap in order to see the yield.
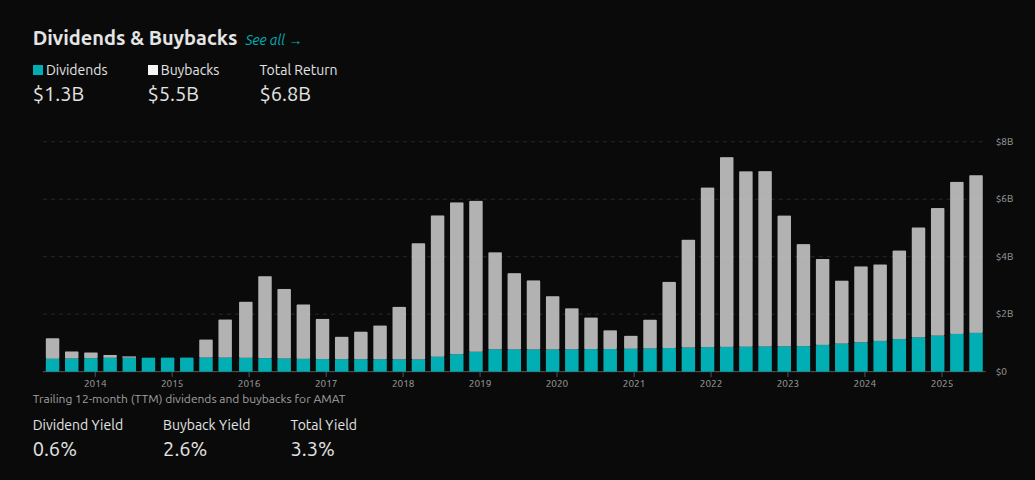
The goal of this analysis is to see if the yield matches the required return for mature stocks, as well as gain a baseline for understanding if the company can afford the returns from business operation. To see this we pair the section with the free cash flows section. Additionally, pairing with the balance sheet allows use to see if the company is taking on more debt in order to cover dividends, and how much cash margin of safety it has after paying out dividends.
Feedback and suggestions are welcome!
No posts
Comments
Nothing yet. Say the first thing.
Sign in to join the conversation.