
Welcome to Chapter Five, Part Two. Now that we've mapped the bones of your site—its climate, contours, and human context—it's time to feel its pulse. In this second part of Chapter Five, we'll survey the living systems that sustain your land: the water that moves through it, the biodiversity that calls it home, and the soil that holds it all together.
In case you are joining the course for the first time and/or missed Part one, you can find the preceding course material over in the Bloom Room here.

The purpose of the water survey is to gain an impression of the existing water sources on the site, to understand how much precipitation the site receives, and to learn how that precipitation interacts with the land. Whether you have too much water or too little, a thorough water survey will reveal critical information to guide your design decisions.
Begin by mapping out all existing water sources and assessing their availability—both on your property and within reasonable access. You may be fortunate enough to have ponds, rivers, streams, wells, or mains irrigation already in place.
However, in hot, dry climates, such sources often flow abundantly in winter, spring, and autumn, only to run dry in summer when you need them most—so verify this carefully. Speaking with long-time local growers is one of the best ways to determine whether a water source is perennial and to learn about the extremes of drought the area has experienced. Wells can also empty during dry periods, especially in regions surrounded by high-water-demand agriculture. Mains irrigation, while convenient, can be expensive at scale and may become restricted—or even prohibited—during peak demand periods when water is most critical.
Other key questions to address:
What are the sources? (Rivers, streams, springs, ponds, wells, mains?)
What is the water quality?
What are the costs associated with using that water?
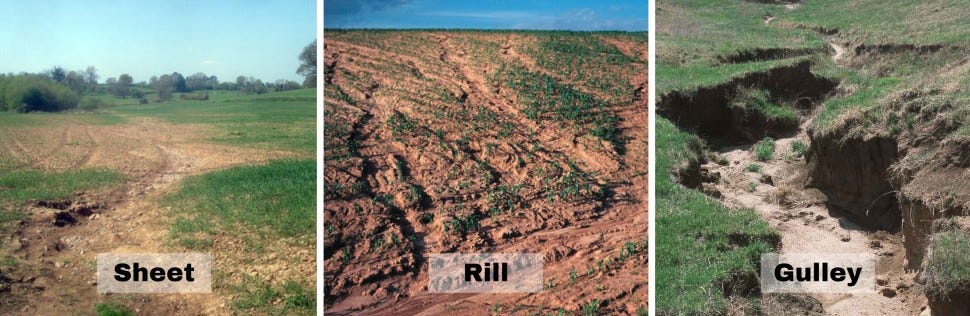
Every sloping surface presents an opportunity to direct water where you want it to go. To understand how rainwater moves across your site, start at the highest point and walk the area, looking for signs of water movement. If it’s not raining, look for evidence of erosion: sheet erosion, rill erosion, or gully erosion. The images below show dramatic examples—hopefully yours won’t be so severe—but if you do find erosion, track it to its source and end point.
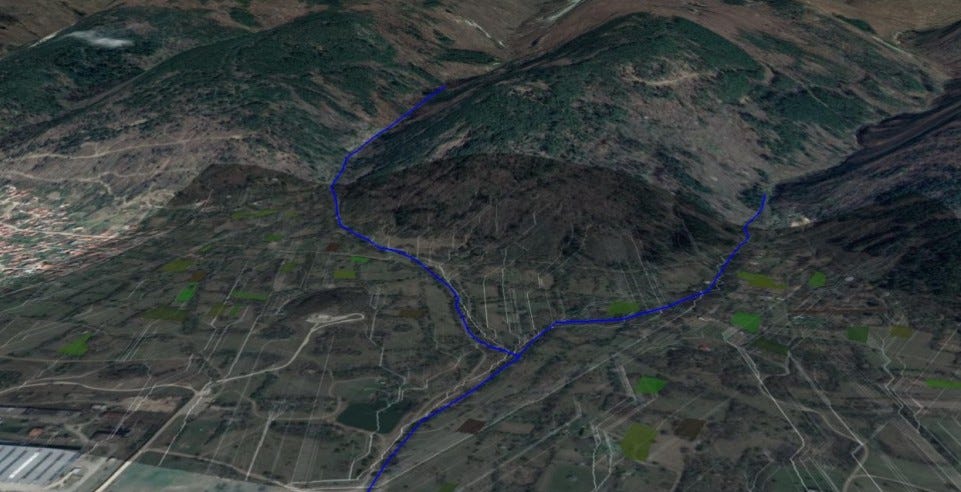
I use a GPS with geo-located photo and track-creation capabilities to mark areas of interest. These observations can then be uploaded to Google Earth for later analysis.
Look for patches of vegetation that stand out—unusually dry or lush—and explore them for clues. Mark them on your map. The aim is to build a picture of how rainfall moves across the land: where it settles, where it could be intercepted or slowed, and where it could be stored. If excess water is your problem, you’re looking for the most appropriate places to drain it away. The best time to make these observations is during periods of heavy rain, so you can witness the process in action.
For larger sites, a DTM can generate water flow maps. These are never as accurate as on-the-ground observations, but they highlight areas worth closer inspection.
You may be in a region that receives more water than you or your plants need, or you may be perched on a dry, windswept hill with scorching summers. In either case, it’s vital to understand both the total annual rainfall and its seasonal distribution.
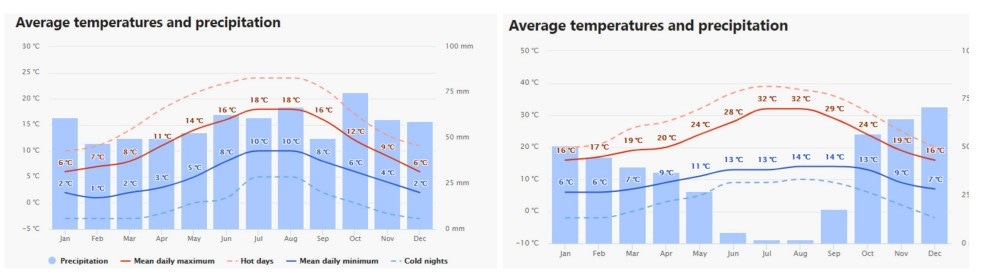
At our location, we receive the most rainfall during May and June, with a significant drop through the summer months when we need water most. Our water harvesting strategy, therefore, is to store the surplus from May and June for use during July, August, September, and October.

As the following comparison shows, rainfall patterns vary enormously. Edinburgh (left) receives 709 mm annually, more or less evenly distributed across the year—allowing a great diversity of plants to grow with little irrigation. Lisbon (right) receives 691 mm—just 18 mm less—but almost all of it falls in the early months and the last three months, with virtually no rain in summer. Without irrigation, growing productive plants in Lisbon would be extremely difficult. However, there is an excellent opportunity to store rainfall during the wet months to meet summer irrigation demands.
To calculate this, you first need to identify your site’s watershed—any surface that contributes to surface water flow during rainfall events. This could be a nearby mountainside, a driveway, a lawn, or the roof of a house or other building.
You will need:
The area of the watershed
Average annual rainfall data for the site
A runoff coefficient—a simple number that accounts for water loss before harvest (e.g., absorption into the ground, retention on clay roof tiles, etc.)
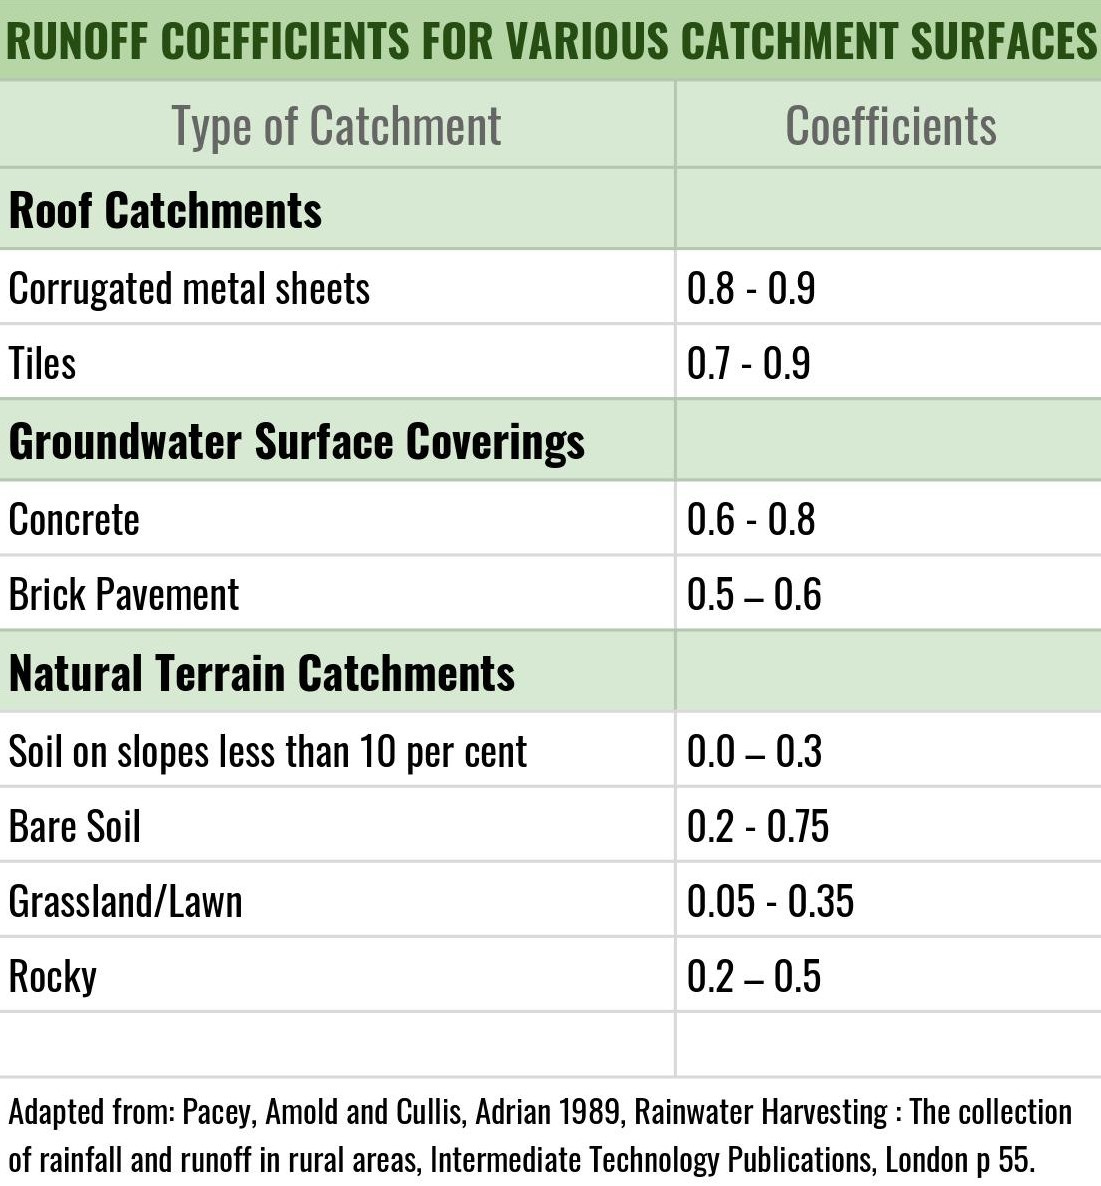
The calculation is straightforward:
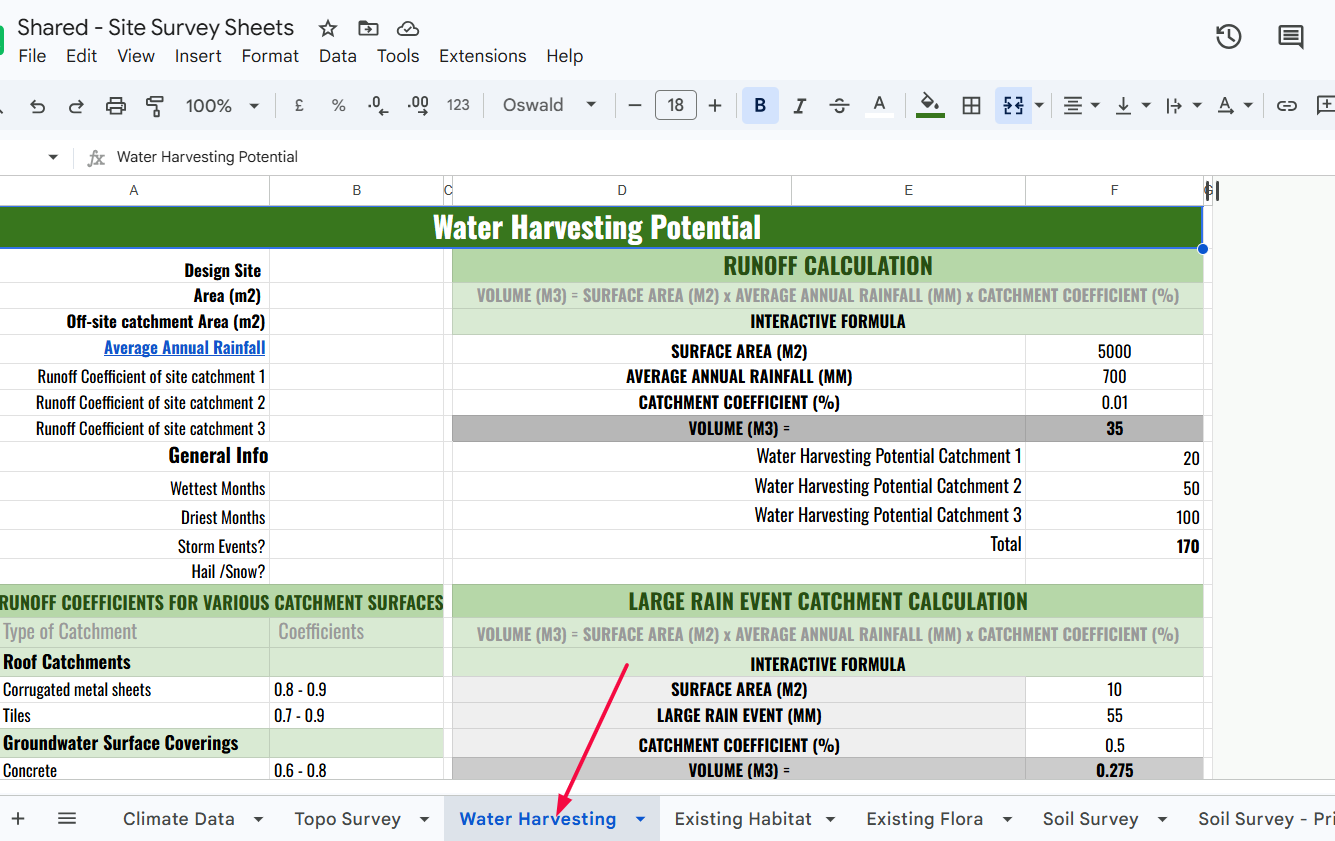
Volume of water (m³) = Surface area (m²) × Average annual rainfall (mm) × Catchment coefficient (%)
You’ll find a water harvesting calculator in the Site Survey Sheet - ‘Water Harvesting’ page here.
If you live in a snowy climate, it’s worth knowing where snow accumulates. Wind-driven snow can form drifts that damage plants—breaking branches or flattening entire specimens—and can also block access paths or building entrances. Most winters at our location, we have to dig a path through the snow to feed the animals, and on rare occasions drifts exceed 1.5 metres, blocking our front door.
Snow also serves as an insulator. A heavy snowfall before the ground freezes can keep soils warm enough for root growth to continue deep into winter. Conversely, snow that falls after the soil has frozen insulates that freeze. Even extremely hardy plants can die in soils that remain frozen for prolonged periods—not from cold itself, but from dehydration, as they cannot access water locked in ice.
Hailstorms can also cause significant damage, particularly to annuals with large leaves. It’s worth noting when hail is most severe in your area. In our gardens, we’re almost guaranteed at least one severe late-spring hailstorm—sometimes with hail the size of walnuts. The damage is mainly to broadleaved annuals like squash and sunflowers, and to our foxglove trees (Paulownia tomentosa), which end up with holes punched through their leaves. Since these events are usually one-off, the plants recover quickly.
Following your water survey, you should have a clear understanding of:
How much water you have potential access to
When rainfall is expected
How much rainfall you can expect
How rainwater and other precipitation move across and settle on your site
We’ll explore how to use this data to create your basic site layout, assess which cultures can be supported by rainfall alone, and design water-harvesting earthworks and ponds in Chapters 13–15.
You can find a Water Survey Case Study here, based on a survey I conducted for a client’s 12-hectare polyculture orchard.
The goal of a polyculture designer is to meet our needs while enhancing biodiversity. The purpose of the biodiversity survey is to establish what is already present on the site—to understand its role in the ecosystem and to ensure that our development efforts do not diminish what is already settled there. In most cases, existing biodiversity plays a vital role, and your task is to discover what that is and how it might support your production goals.
The range of biodiversity on some sites can be overwhelming—you could spend a lifetime (or ten!) uncovering it all. A more manageable approach is to focus on identifying habitats and the micro-habitats within them. Habitat can be defined as the home or environment of an animal, plant, or other organism. You’ll find a Habitat Type sheet below with a list of common broad habitats you may encounter.
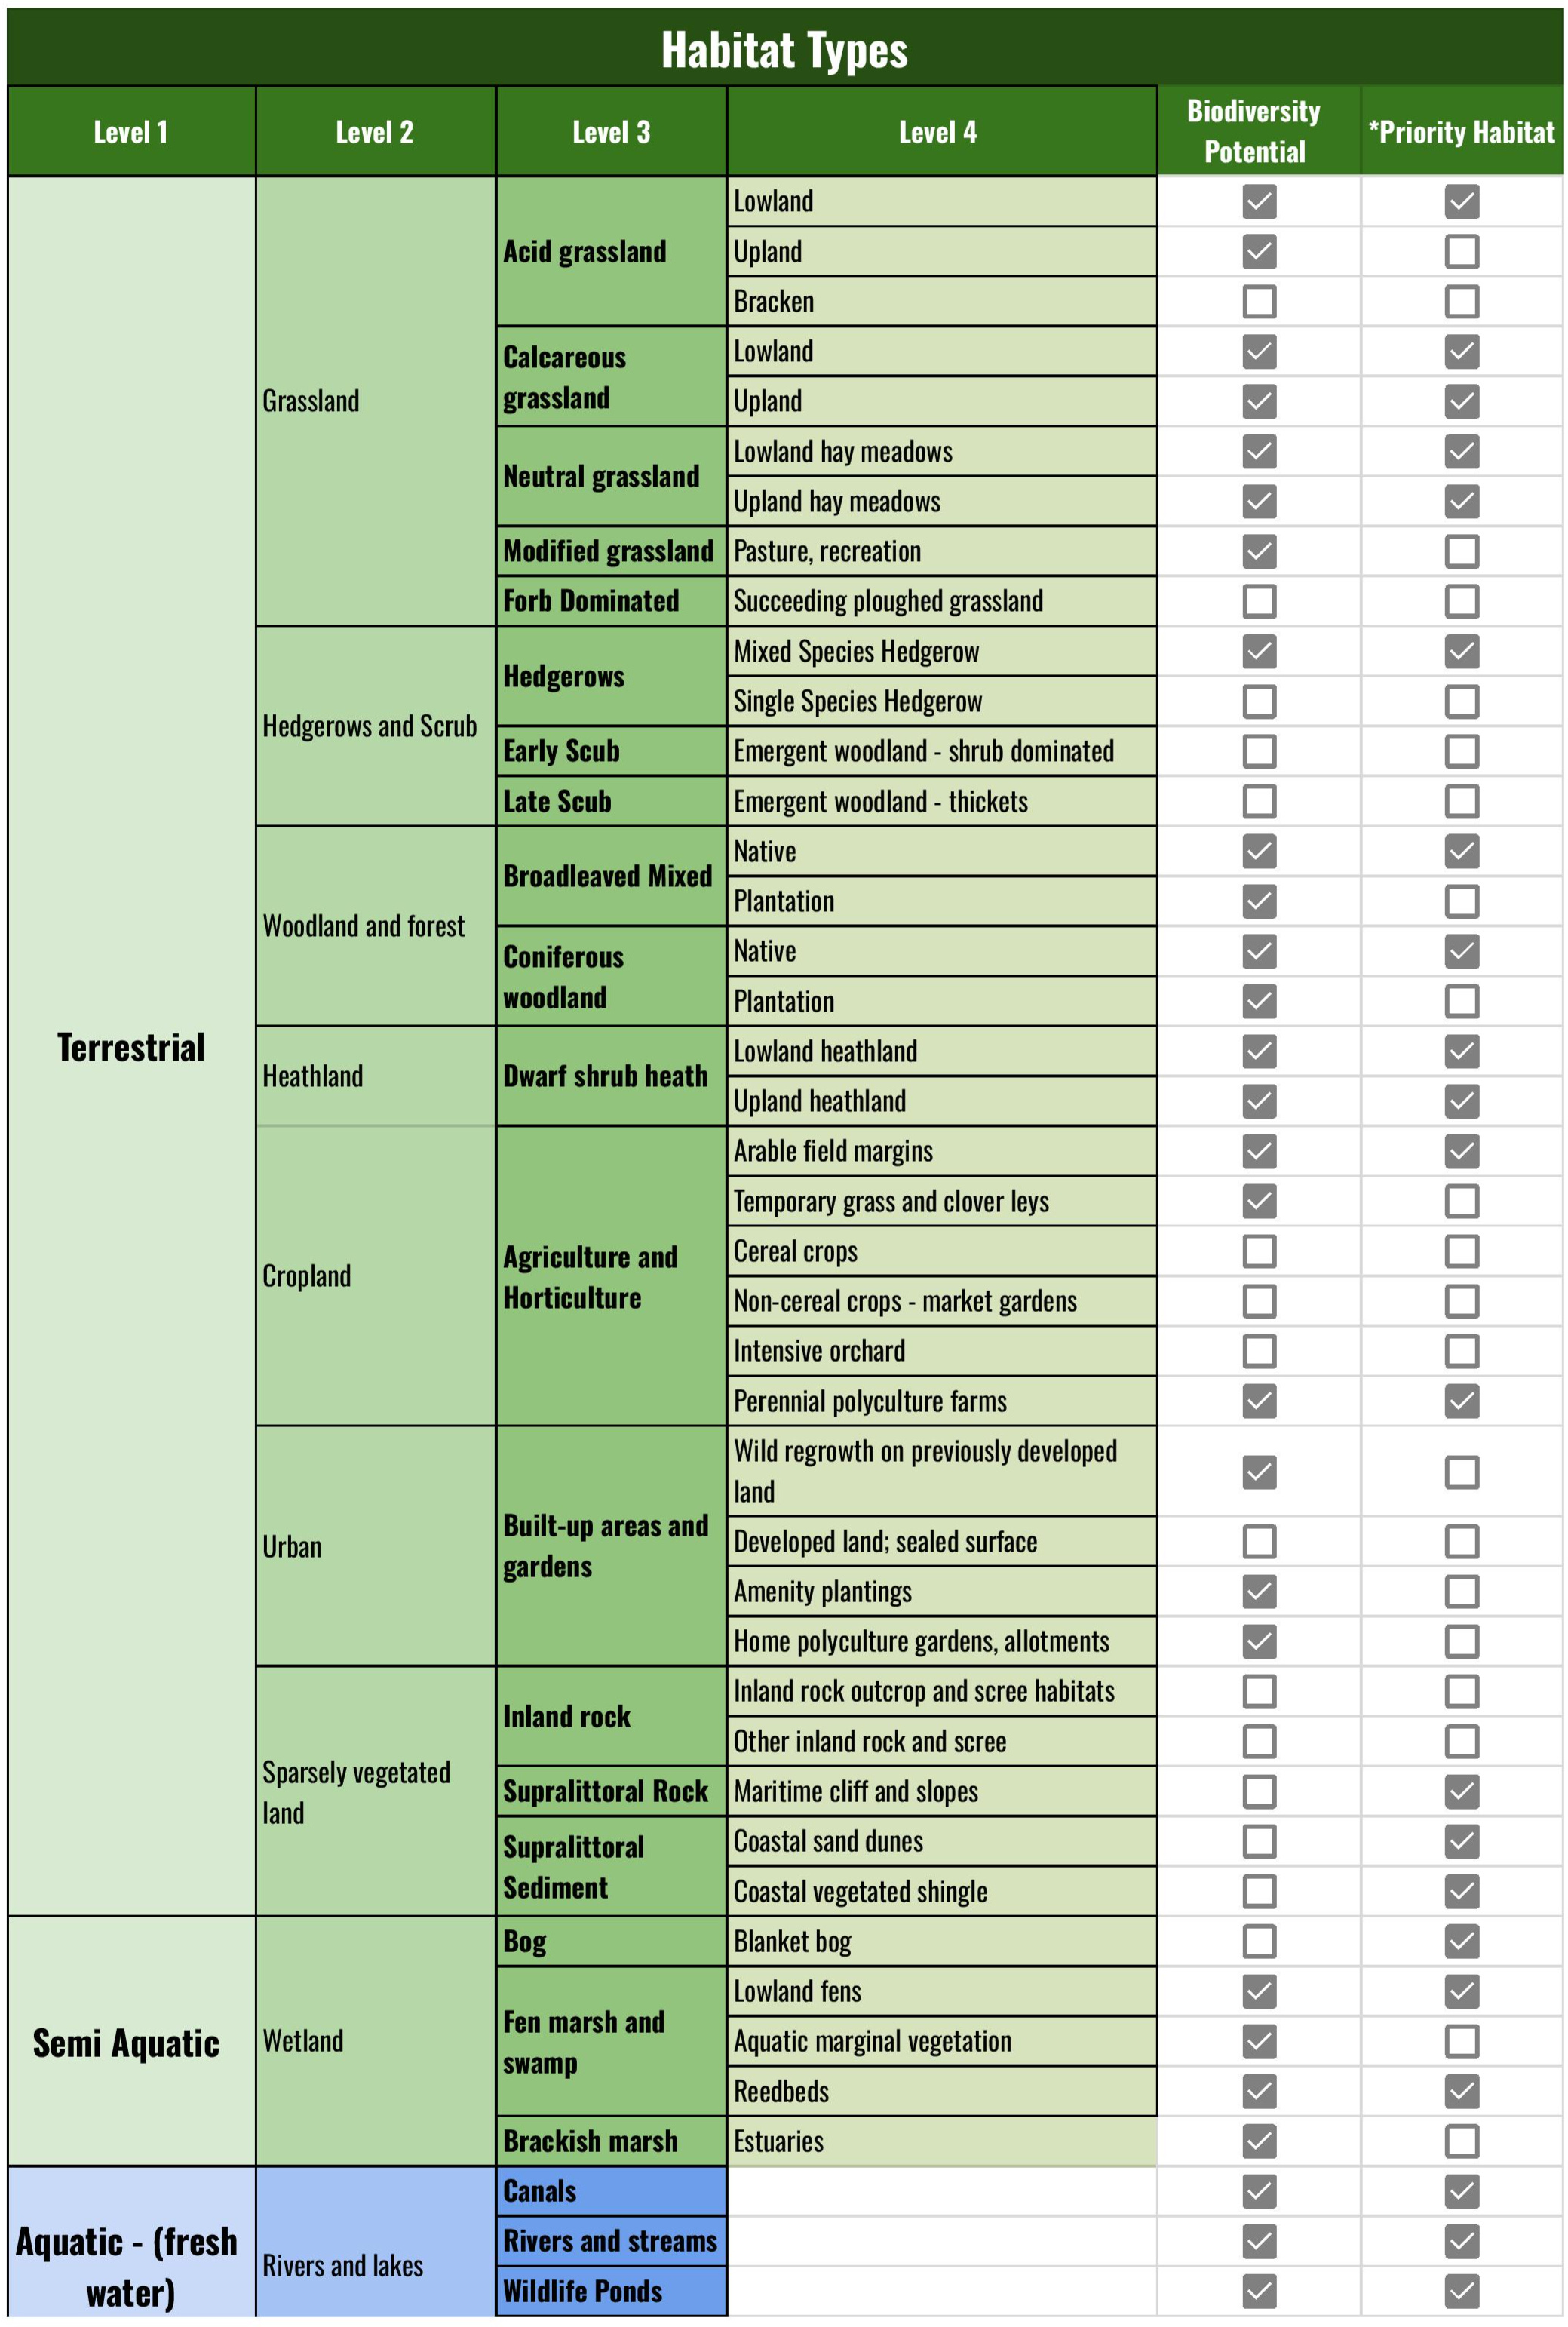
You may come across the following habitats, each with its own unique biodiversity:
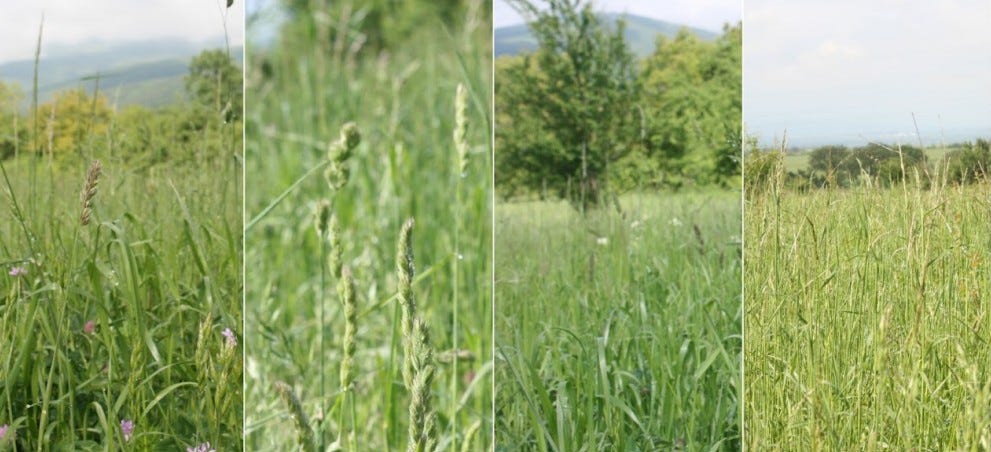
Grassland – The best grasslands (”unimproved grasslands”) contain many species of wild plants—predominantly grasses but also herbs, with 25 or more species per square metre not uncommon. These are highly valuable habitats for a range of organisms, including many pollinators. In many parts of the world, unimproved grasslands are among the most threatened habitat types. Forb is a variation dominated by herbaceous plants other than grasses.
Woodland and Forest – Areas dominated by tall trees. Woodlands and forests composed of a mixture of native species of various ages, with plenty of “gaps and rides” (openings and edges that allow light to reach lower layers), generally provide the highest levels of biodiversity. Monoculture woodlands of uniform age provide the least. That said, mixed-species plantations and regularly managed coppice woodlands are excellent examples of how we can meet our needs while enhancing biodiversity.
Scrub – Often found on woodland edges and during successional phases following disturbance. Scrub is dominated by shrubs (e.g., brambles, sloes) and small trees (e.g., hawthorn, wild plum). Some species may reach 3–4.5 metres in height, and mature scrub can resemble woodland. Many scrub plants are fast-growing pioneers that colonise open habitats rapidly, often spreading by suckers (rhizomes) and protected by thorns or spines against mammalian herbivory.
Hedgerows – Originally planted to divide land into fields and pens and to mark property boundaries. Mixed-species hedgerows—typically composed of native trees, shrubs, and herbaceous plants—provide excellent habitat for birds, voles, mice, shrews, and a range of invertebrates. More recent single-species hedgerows provide far less habitat value.
Heathland – Found mainly on free-draining, infertile, acidic soils, characterised by open, low-growing woody vegetation such as heathers, gorse, and heathland grasses, with occasional scattered trees.
Wetland – Land dominated by reeds, rushes, sedges, willows (Salix spp.), and common alder (Alnus glutinosa) is a clear sign of wetland or semi-wetland conditions. These are highly productive ecosystems in terms of biomass and often support high biodiversity.
Aquatic – Water bodies such as streams, ponds, and rivers should already have been identified during the water survey. These are probably the single most beneficial habitats you can have on a site for attracting and sustaining biodiversity.
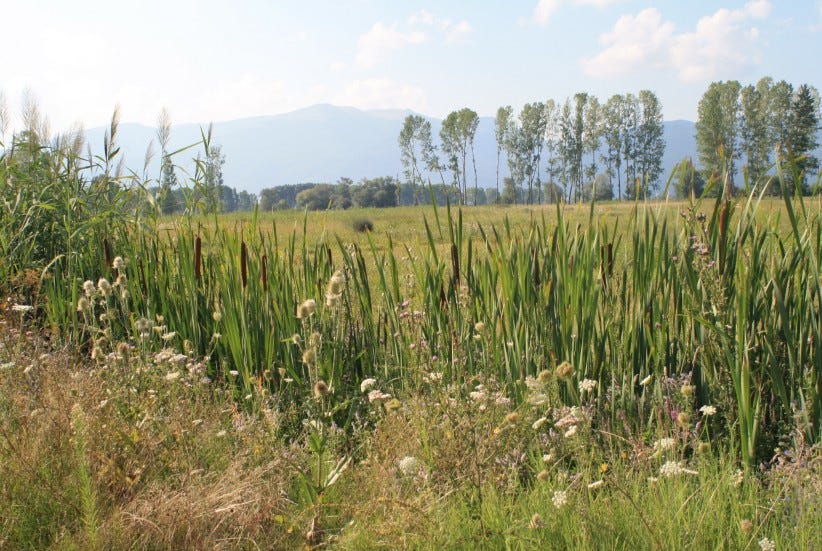
For practical survey purposes, it may not always be clear where one habitat ends and another begins, or at what size a habitat should be considered. Any obvious vegetation differences that fit the habitat descriptions will suffice. For example, in the photo below you could identify grassland (between the reeds and trees), forb (herbs in the foreground), wetland (reeds), aquatic (the stream below the reeds), hedgerow (in the distance), and woodland (far back). By observing each of these habitats across the seasons, you should notice clear differences in the organisms they attract and the plant species they comprise.
If your site lacks multiple habitats, it’s still worth learning about the habitats of your wider region. This will help you understand how your site fits into the surrounding landscape and may suggest what you could include to attract specific organisms.
In addition to broad habitat types, you can identify micro-habitats—particularly valuable on smaller sites where these may be the only distinctions to make.
Examples include:
Rotting stumps – Essential for species like the endangered European stag beetle (Lucanus cervus), whose larvae feed on rotting wood for three to five years below ground before emerging as adults.
Dying trees with hollows – Often support more life than living trees, providing nesting sites for birds and mammals.
Walls with missing mortar or holes – Excellent nesting habitat for many winged invertebrates that assist with pest control and pollination.
Patches of bare earth – Characterised by a lack of vegetation (e.g., tilled areas, gravel patches). While easily restored, it’s worth leaving some areas bare, as ground-nesting bees and other invertebrates use them.
Boulders and rock piles – Provide nesting sites for invertebrates, basking territory for reptiles and amphibians, and escape cover.
Brush/log piles – Nesting sites for small mammals; if large enough, suitable for winter hibernation (e.g., European hedgehog, Erinaceus europaeus).
Ground sheets – Old fence panels or tarps are often used by reptiles, ground beetles, and other invertebrates for nesting and shelter.
Eaves of buildings – Nesting sites for birds and bats.
Fence Posts - Bird perch

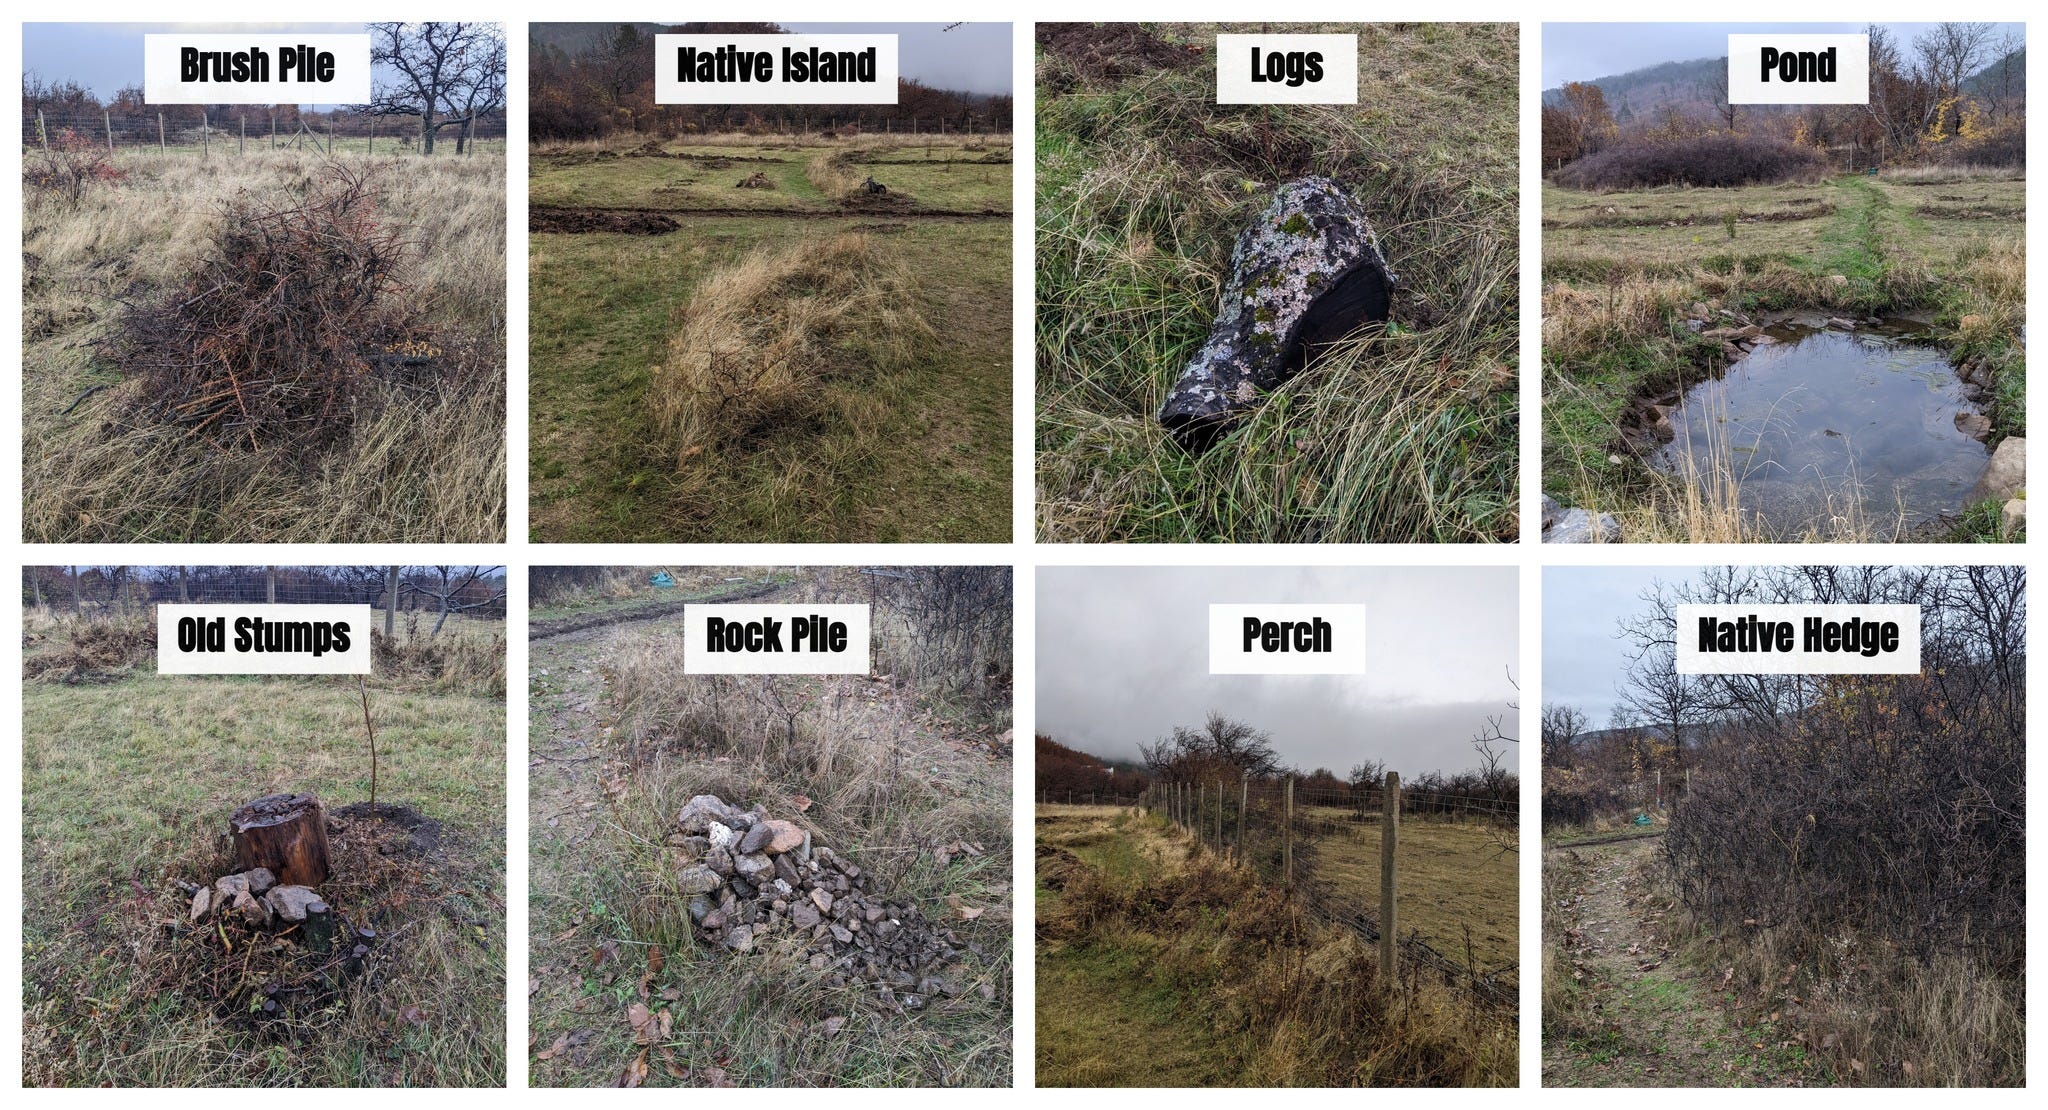
We’ll explore micro-habitat creation and management in more detail in Chapter 10.
Getting to know the botany of a site is hugely valuable. Identifying plants is one of the best ways to become personally acquainted with the land. If you’re new to plant identification, there are now excellent plant ID apps available, and they will only improve with time. My personal favourite is PlantNet. If you have the budget but lack the time, consider hiring a botanist—preferably a local one.
It’s best to survey across all four seasons, though in cold-winter regions there may be little to observe during winter. A survey in early spring, summer, and autumn will give you a strong impression of the plant life. You will undoubtedly find an array of plants emerging at different times, each with a role in the ecosystem—and many of them useful for incorporation into your designs.
I generally start from the tree layer and work my way down. Trees and shrubs are usually the easiest to identify, with distinguishable features year-round—though flowers and fruits remain the most reliable identifiers. On a new site, I photograph plants in flower every two weeks, store them in monthly folders, and then review them during the winter to identify unknowns.
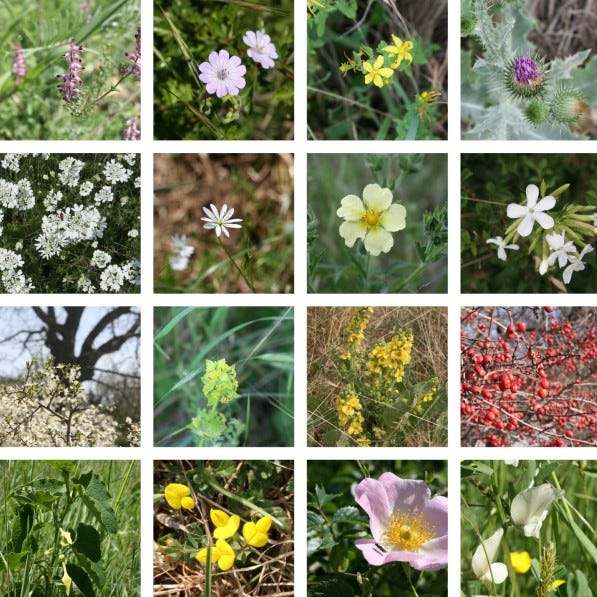
Here you’ll find a Plant Species Recording Template. This template allows you to build a comprehensive picture of each plant’s needs, behaviour, and function. There’s also an Existing Flora template in the Site Survey Sheet - ‘Existing Flora’ Page for recording plant layers, habits, root types, and functions.
Birds, mammals, reptiles, amphibians, fungi, and invertebrates are all relevant to a biodiversity survey, but they can be difficult to observe and—especially in the case of invertebrates—challenging to identify.
Fortunately, the birds, mammals, reptiles, amphibians, and fungi of your area are likely well documented. Local research will often tell you what to expect. For mammals, look for signs: trails and droppings. For birds, listen for calls, which can aid identification. Fungi most often fruit during warm, wet spells in spring and summer, with autumn being the peak season for most species.
For invertebrates, we’re talking about molluscs (snails, slugs), annelids (worms), and arthropods (insects and spiders). This is a vast group, but you can learn much from their various orders. Many regions have local, regional, or national guides to insects and spiders—excellent resources for familiarising yourself with resident species. The internet also offers many identification keys that can at least help you narrow down to order level.
A book I thoroughly enjoyed—and one that got me thinking more deeply about garden invertebrates—is The Natural History of the Garden by Michael Chinery. The Collins Field Guide series also provides excellent information on European invertebrates.
There are also social network sites dedicated to recording observations of organisms worldwide, many of which can assist with identification—such as www.ispotnature.org. For birds, eBird is the world’s largest biodiversity-related citizen science project, with over 100 million bird sightings contributed annually. For example, here you can find the bird list for our area, compiled by my brother Peter during his visits.
It’s not essential—nor often possible—to record every species on your site. But it is a wonderful way to get to know your residents and their relationships with each other and with you. It’s remarkable what you see when you look carefully, and without doubt, you will learn plenty.
Welcome to our Online Store where you can find Forest Garden/ Permaculture plants, seeds, bulbs, and Polyculture multi-packs along with digital goods and services such as Online Courses, Webinars and eBooks. We hope you enjoy the store and find something you like. It’s your purchases that keep our Project going.
You can also find our full list of trees. shrubs and herbs for forest gardens on our nursery website.
The purpose of the soil survey is to discover the condition of your soil—to guide plant selection and to plan any amendments needed before planting. Soils can vary tremendously within a single site, so identifying and mapping these variations is a great starting point. Areas with different vegetation, past cultivation, or positions at the top and bottom of slopes will often require separate analysis.
Understanding the historical use of your soils can reveal what may grow well there, what nutrients may be lacking, and—critically—whether any harmful contaminants are present. These may include pesticides, petroleum products, radon, asbestos, lead, chromated copper arsenate, or creosote.
Soil texture describes the proportion of sand, silt, and clay in a given sample. This basic characteristic affects how easily soil can be cultivated, how much water and air it retains, and how quickly water drains through it. There are many straightforward methods to determining texture, and for our purposes, the minute details aren’t important.
Here are three accessible tools to help you explore soil texture:
LandPKS Soil ID App – This free mobile app is ideal for hands-on, field-based learning. It walks you through the texture identification process using real-time observations, making it a practical way to apply what you’ve learned in the field.
“Soil Puzzle” Interactive Game – If you’re a tactile or visual learner, this free online game offers a fun challenge: drag and drop different soil types onto the correct position on the soil texture triangle. It’s an engaging way to memorize soil classes and their compositions.
USDA Soil Texture Calculator (Excel) – For those who prefer a data-driven approach, the NRCS offers an Excel-based tool that calculates the textural class once you input your sand, silt, and clay percentages—perfect for more analytical minds.
Digging test pits is labour-intensive but well worth the effort if soil depth is unknown and you’re planning to plant deep-rooted species like trees. Test pits are especially valuable on clay soils to check for a hard pan—a compacted layer that can cause endless problems for most plants.
Ideally, a test pit should reveal the full soil profile, from topsoil to parent material or bedrock (or to the layer of root obstacles). For healthy tree growth, a minimum depth of 1 metre (3 feet) of topsoil and subsoil is generally recommended. Shallow soil restricts root growth and significantly increases irrigation requirements. Identifying the parent rock is also useful, as different rocks have different chemical compositions that may affect pH and fertility. Test pits will also help assess a site’s suitability for pond construction, as we’ll see later.
An excellent tool for gaining an overview of soil health is the Soil Health Card from Northern Rivers. It’s a simple set of tests using equipment you likely already have on hand. It’s both a great educational tool and a practical assessment of soil structure, drainage, fertility, organic matter, and soil life.
I’ve added the test cards to the Site Survey Sheet for easy recording, you can find the details in the last three pages of the sheet.
In addition to physical analysis, it’s wise to send samples to a laboratory for accurate pH readings and measurement of available macro- and micronutrients.
Soil pH – A pH test will tell you whether your soil is suitable for good plant growth or whether treatment is needed. For most plants, the optimum pH range is 5.5 to 7.0, though some species tolerate more acidic or more alkaline conditions.
Soil pH is measured on a scale of 0 to 14: 7 is neutral, below 7 is acidic, and above 7 is alkaline. pH is important because it influences several soil factors affecting plant growth: soil organisms, nutrient leaching, nutrient availability, toxic elements, and soil structure. For example:
Bacterial activity that releases nitrogen from organic matter operates best in the 5.5–7.0 range.
Earthworms, vital to fertility, prefer pH 6.0–7.0 and dislike acid soils (though they can tolerate up to 8.0).
Plant nutrients leach much more rapidly from soils below pH 5.0 than from soils between 5.0 and 7.5.
Nutrient availability is generally highest in the 5.5–7.0 range.
Aluminium can become toxic to plant growth in soils with pH below 5.0.
Plant-Available Nutrients – Beyond pH, it’s useful to measure phosphorus, potassium, sulfur, calcium, magnesium, and possibly micronutrients if deficiencies are known in your area. Usually, micronutrients are in good supply in most soils.
To take a soil sample for the lab, I take a core from the top 20 cm from 10 random locations within the area, mix them together in a bucket, and send 400 g “bagged and tagged” to the lab the same day. See the end of the chapter for a detailed guide. We send our samples to the NAAS of the Ministry of Agriculture and Food here in Bulgaria.
You can make composite samples for each distinct area (based on vegetation differences) that you may want to grow in. Each composite should include 10 cores from 0–20 cm. You can also take a separate sample from 20–40 cm if the subsoil differs markedly. Be sure to label everything clearly.
We’ll cover how to interpret soil analysis results and make necessary amendments in Chapter 16.
You may be able to access online soil survey data for your region. In the USA, you can download a KMZ/KML file from the SoilWeb Earth tool by the UC Davis California Soil Resource Lab. Open this file in Google Earth to view high-resolution USDA-NRCS soil survey data mapped directly in a 3D view.
European maps are available from this website While not a substitute for physical on-site analysis, these maps are improving in detail and can provide useful information.
The good news: whatever the condition of your soil, it is probably the easiest thing to improve—simply by mimicking soil formation processes from healthy ecosystems. (Clay soils do require some extra initial effort.) Across large areas, amending soils can be costly and disruptive; in such cases, it may be better to select polycultures that match the soil conditions. For example, if you have boggy, acidic soil with a pH of 4.5, you’re probably better off growing cranberries, blueberries, and other acid-lovers than undertaking broad-scale drainage and pH amendment.
Throughout this course, we’ll discover how to build and maintain fertile soils within our productive polycultures.
That’s all for now, next lesson, we'll round out our site analysis by turning to the finer details: microclimates, access, and infrastructure—the final pieces that will complete your picture of the land you're learning to design with.
If you want to access the full course immediately and take advantage of 20 hours of direct, private consultancy, mentoring, and guidance focused entirely on your specific design project, you can register for the course here.
Why this is a major benefit for you:
Your project, your pace – We’ll move at the speed that works for your learning and design process.
Deep, tailored feedback – Every lesson can be directly related to your site, your challenges, your goals.
Live sessions on your demand – You don’t have to follow a fixed schedule. Whenever you feel you need a live session — to unblock a problem, review progress, or dive deeper into a topic — you simply request one, and we’ll find a convenient time.
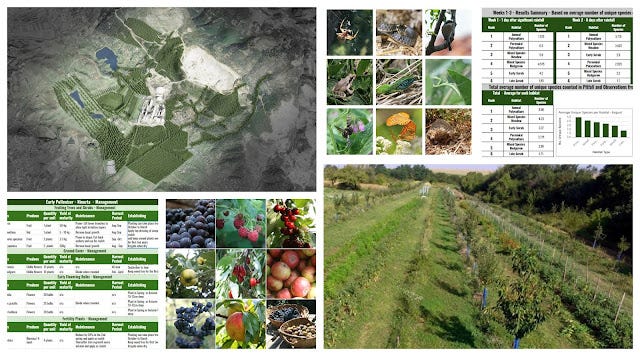
You’ll learn how to complete a professional regenerative landscape design and how to build and manage that design for yourself or for your design clients.
The payment structure includes a four-installment plan of 398 EUR per installment, as well as the option of a single payment of 1500 EUR.
When you enroll with a single payment (1500 EUR), we’ll reserve your place, you’ll receive the full course content, and you are free to book your 20 hours of one-to-one sessions at any time.
When you enroll with the installment plan, following payment we’ll reserve your place and send you the first quarter (5 lessons) of the course, and will release the next quarter following each subsequent installment payment. As soon as you get the material, you are welcome to request your 5 hours of one-to-one sessions.
You can register for the course here
If you appreciate the work we are doing you can show your support in several ways.
Become a member of the Bloom Room with a $70 annual subscription to our Substack where you can access the content in our Regenerative Landscape Design Course , a member forum and more.
Make a purchase of plants or seeds from our Nursery or Online Store
Join us for one of our Onsite or Online Courses
Comment, like, and share our content. Sharing is caring !

We offer a diversity of plants and seeds for permaculture, forest gardens, and regenerative landscapes including a range of fruit and nut cultivars. We Deliver all over Europe from Nov - March. - Give a happy plant a happy home :)
The Polyculture Project is a reader-supported publication. To receive new posts and support my work, consider becoming a free or paid subscriber.
No posts
Comments
Nothing yet. Say the first thing.
Sign in to join the conversation.