
In my last post, using historical QQQ data, I predicted that July is usually a positive month after a green April and May and a red June. So far July is slightly red and coiling in a tight pennant, waiting for big tech earnings to decide its fate.
The market isn’t cooperating with the seasonality script yet, but my account just hit a new all-time high. This past Friday I closed the NQ puts I’d rolled on 6/5 in profit. The spreadsheet is updated, and I’m very proud of these stats:
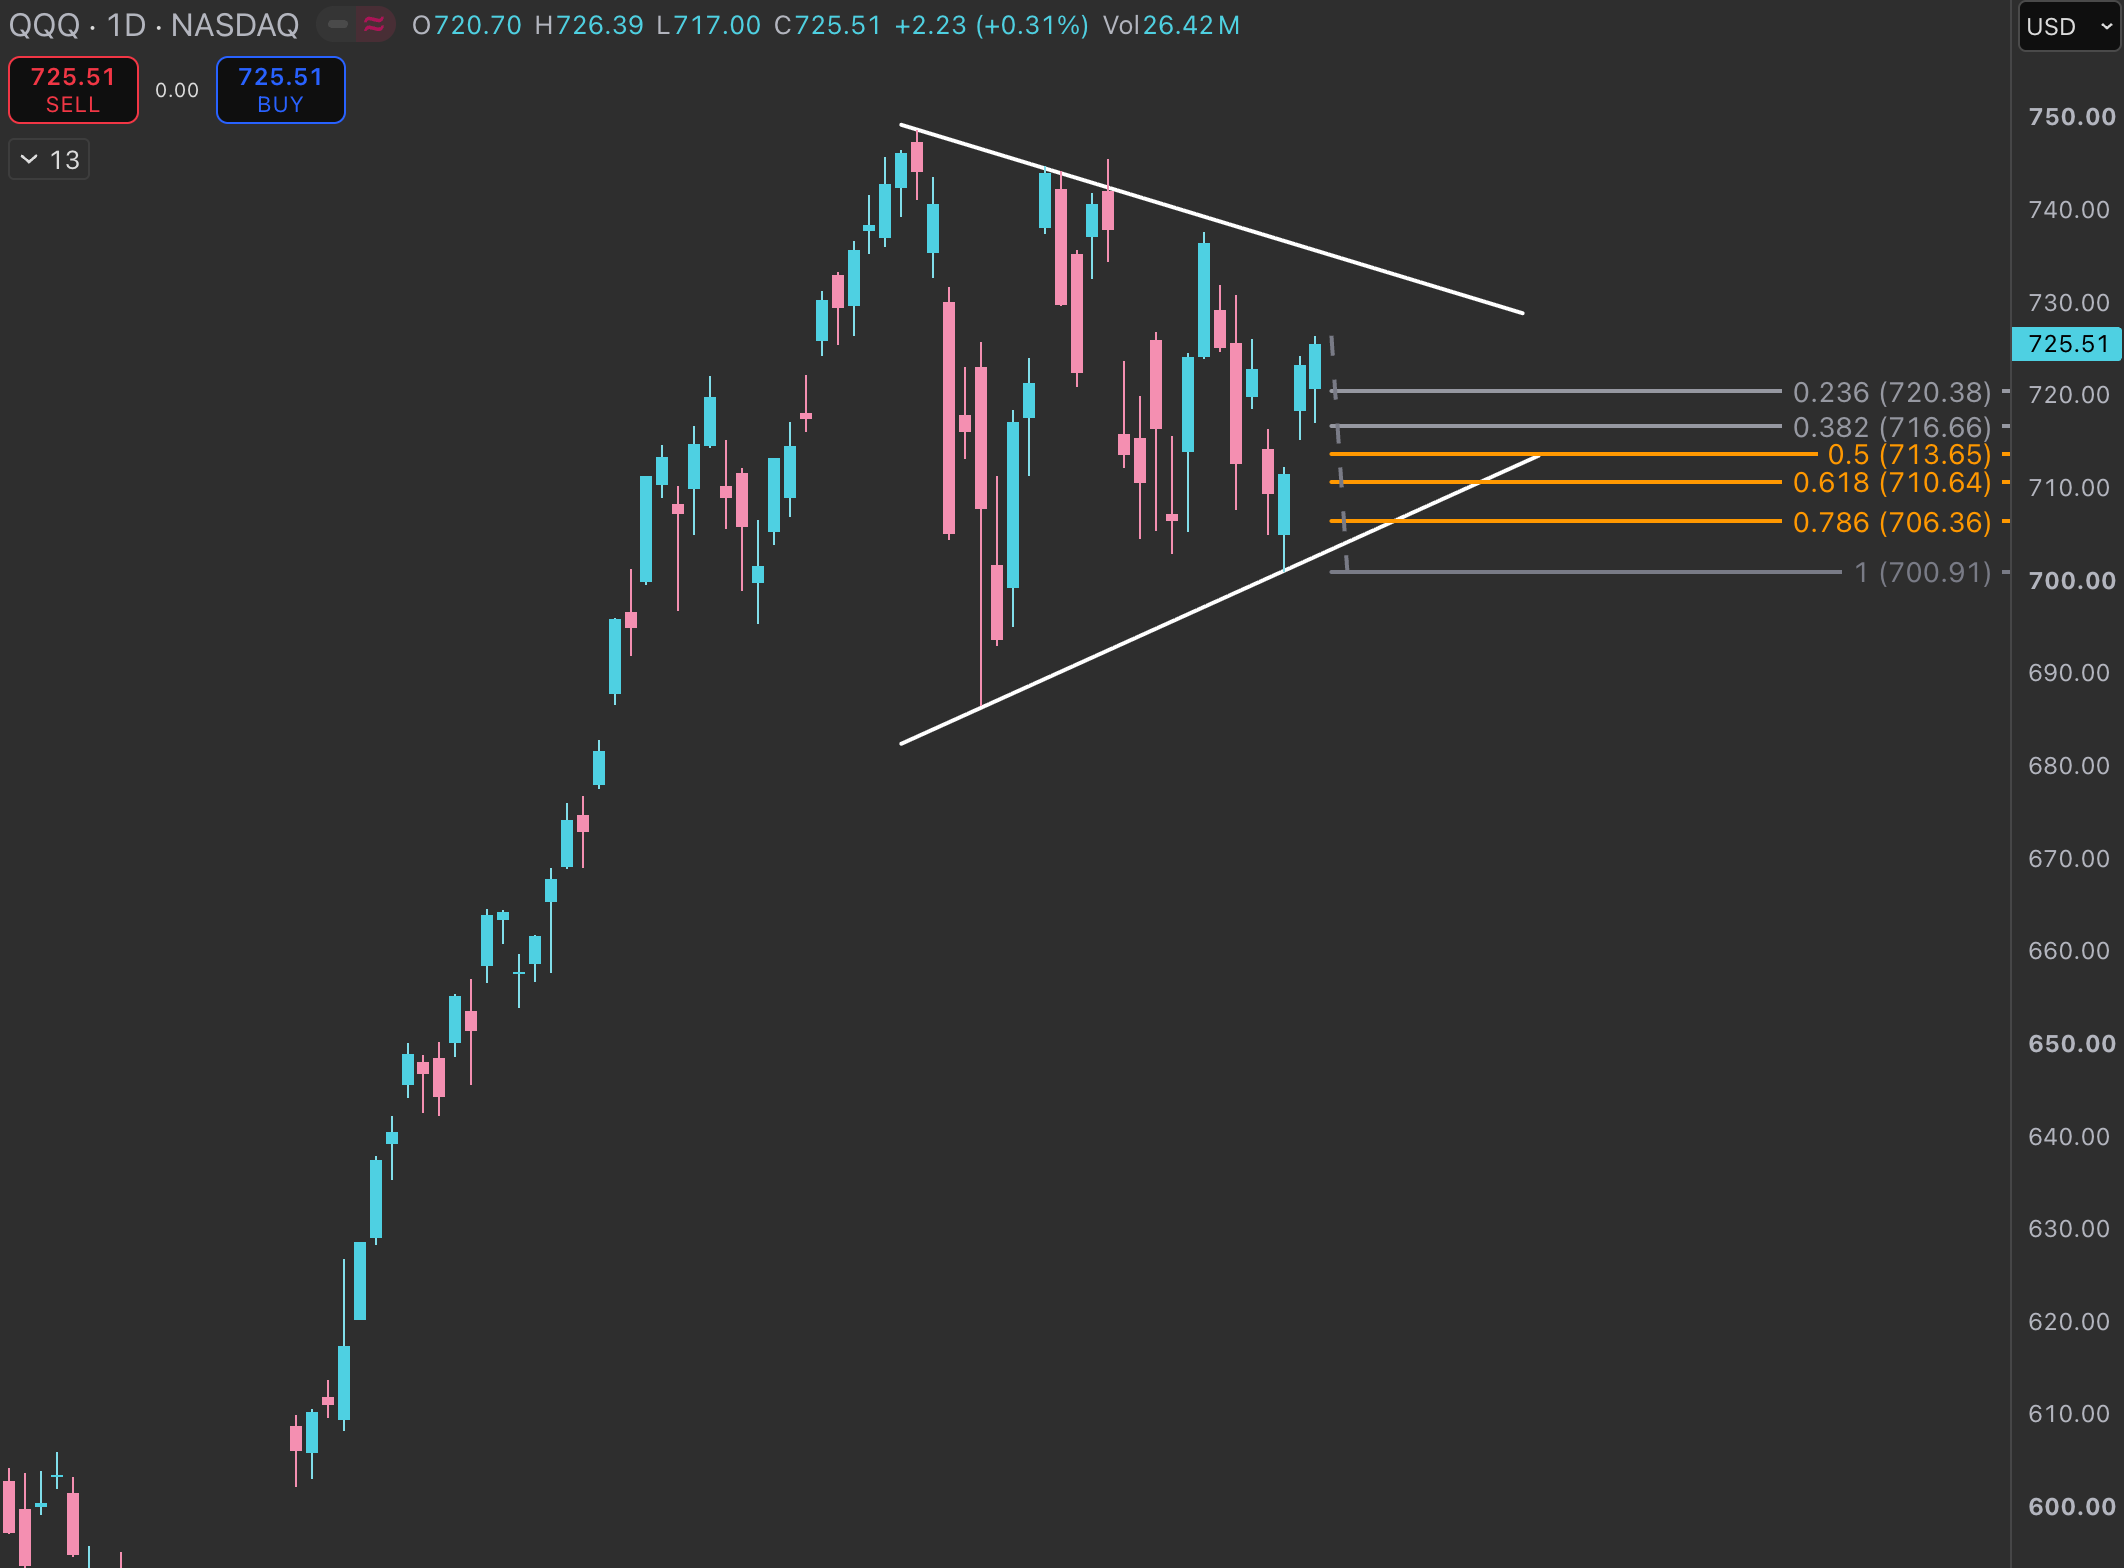
Let’s take a look at the QQQ 0.00%↑ daily chart. Price is consolidating in an increasingly tighter range, a classic pennant, after the huge run up in April and May. The volatility might feel dramatic if you’re daytrading, but zoom out and it’s just compression. The range keeps tightening because the real catalysts land at the end of the month: big tech earnings.
We’ve had three straight days of impulse up since Wednesday, so some retracement makes sense here. I’ve drawn the fib levels on the chart. I’m interested in selling puts when price gets into the 716-713 area.
Comments
Nothing yet. Say the first thing.
Sign in to join the conversation.