Mike Thornton | The Multiplier · The Multiplier | Retirement Income with Options
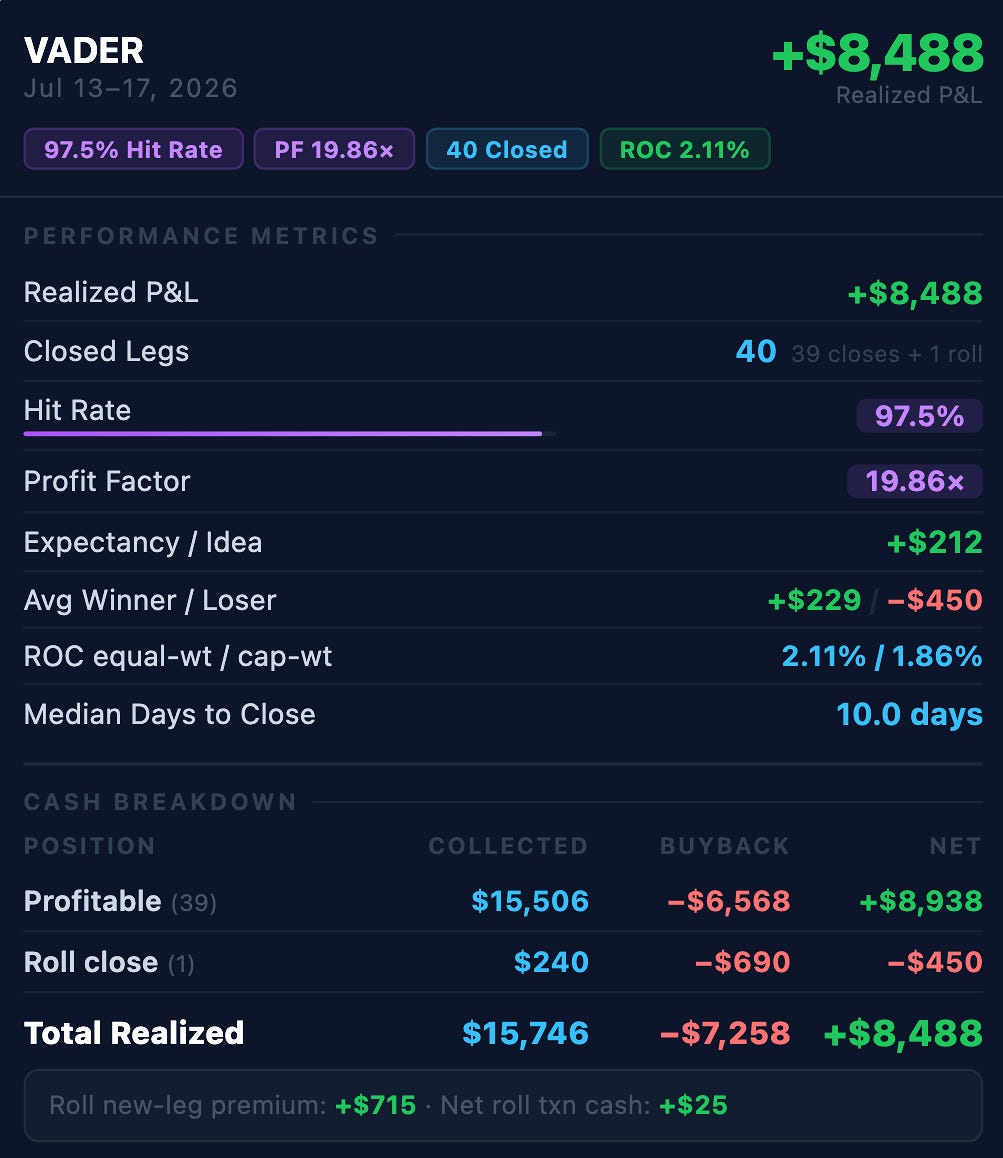
We closed this week with $8,488 in realized profit across 39 winning positions.
In this report, we will go through the week together: the performance numbers, the trades that stood out, and the trade-management patterns they reveal.
I want to give you the reads, the frameworks, and the logic behind my management decisions so that you can apply the same thinking to your own positions and build the muscle memory that makes trade management feel automatic.
(If you read these Sunday reviews regularly, feel free to skip ahead.)
In The Multiplier, we use options as a retirement income tool.
That means we sell options.We don’t buy them. We use cash-secured puts and covered calls only. No leverage. No speculation.
This sits inside a broader income portfolio alongside dividends and T-Bills, with one goal: reliable cash flow without selling shares or draining principal.
Why the skill of selling options matters for your retirement
Most retirees have one plan: save enough, then sell shares slowly to live on. That plan worked when bonds paid 5% and lifespans were shorter. It does not work as well now.
Selling options gives you a second income stream from the same portfolio. You keep the shares. You keep the dividends. And you get paid premium on top.
If you’re new to this approach, I explain the reasoning in detail here:
Every Sunday, I publish the same type of review.
What we closed and how much income was actually locked in. What we rolled, and whether it was done for credit or debit, and why. What we held, and what we’re watching going into the next week.
Because if you strip it down, selling options comes down to three decisions you repeat over and over: hold, close, or roll.
Learning when to do each using rules is skill we learn here.
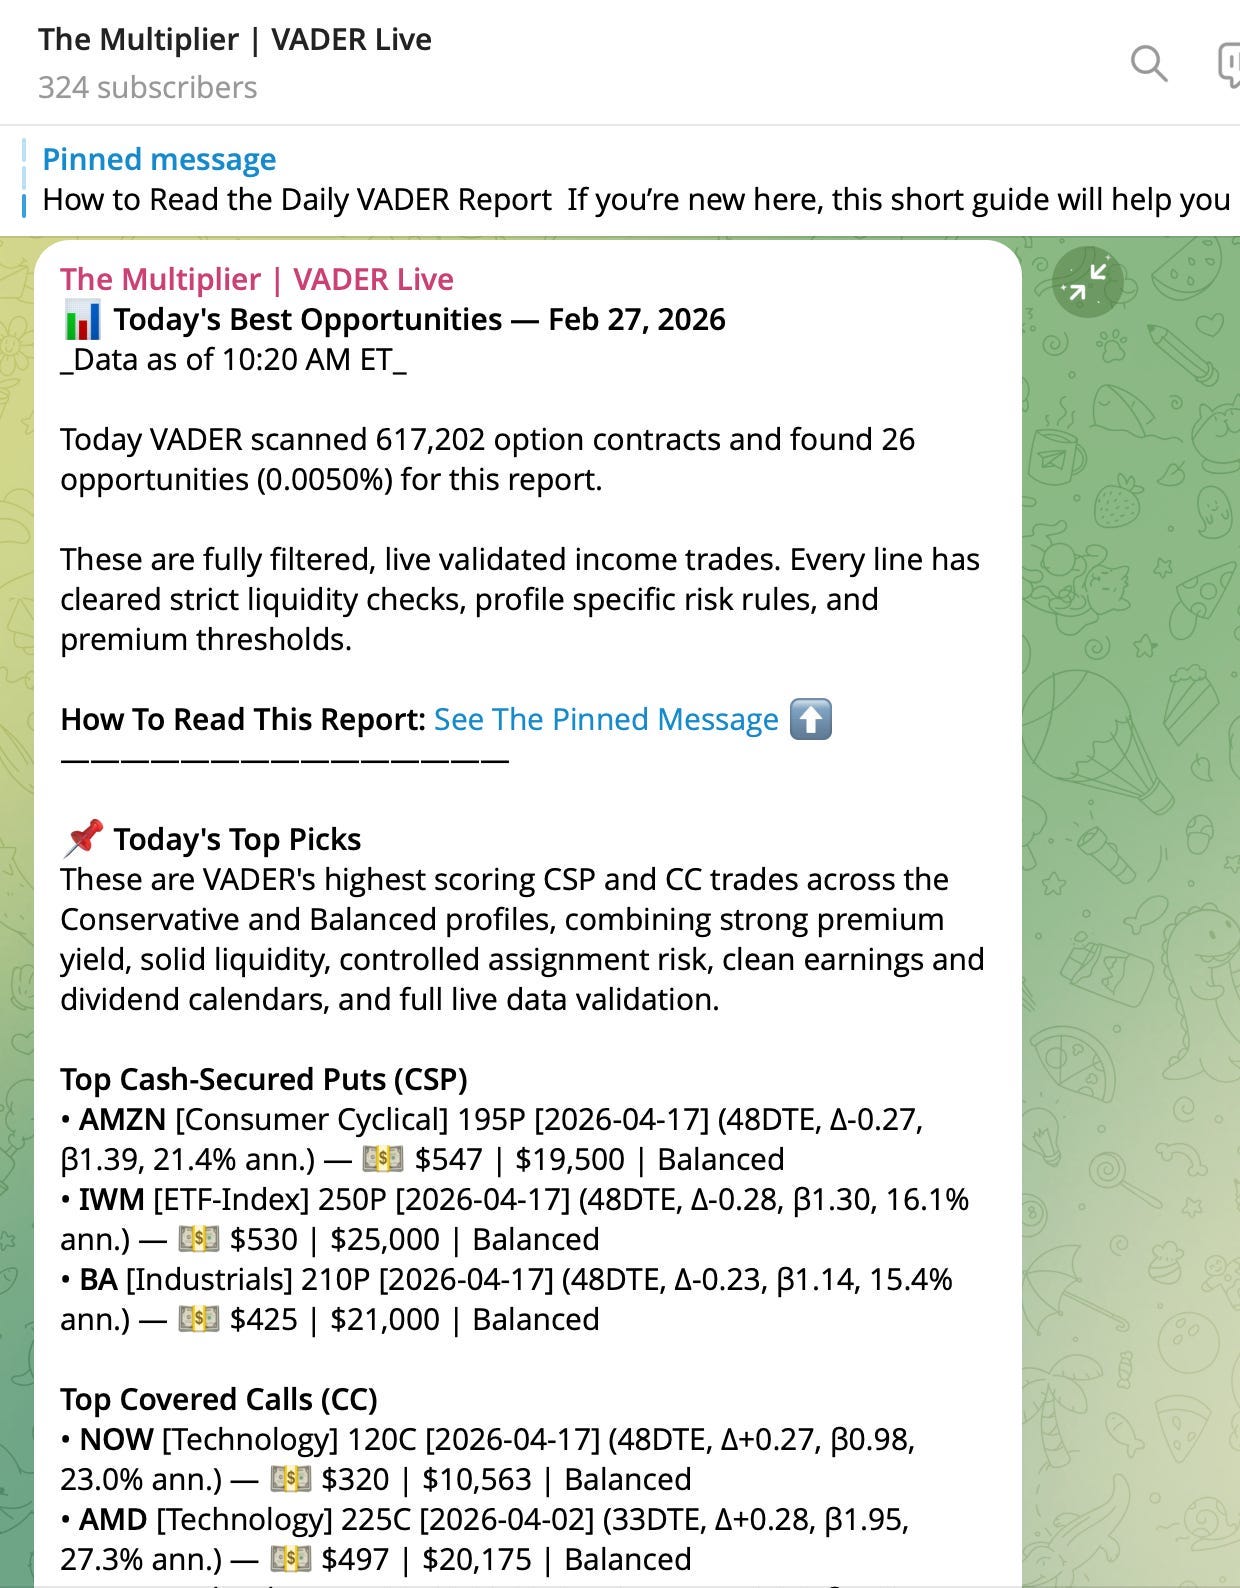
This week, the system generated $8,488 in realized profit from 39 closed positions - all picked by VADER, my proprietary algorithm that scans 500,000+ option contracts daily and surfaces only the top 0.005% of income setups.
Premium members receive those setups in real time, Monday through Friday, in the private Telegram channel.
This is what it looks like:
And then on Sunday, we review the results of VADER trades, explain the decisions, and map out what to do next with open positions.
There is no risk in giving it a try. Join today and use the full system for 60 days.
You can cancel the subscription anytime.
If at any point during those 60 days you decide it’s not right for you, email ‘refund’ to mike@themultiplier.co. I’ll process it within 24 hours, no questions asked. You keep everything you’ve learned.
The Multiplier is a Substack Bestseller. 410+ people have already upgraded, and you can read their feedback below.
Chip stocks fell into a bear market territory this week. You saw the headlines.
The press spent Friday debating whether the AI boom is over.
And if you sold puts anywhere near technology, you probably have red on your screen right now.
But here is the part that might surprise you - my book still made $8,488 in profit this week.
That is not a contradiction, and it is not luck.
It comes down to two things.
My book went into this selloff with zero puts on chip stocks. No AMD, no NVDA, no Intel.
Not because I predicted the crash. Because VADER, the screening filter behind every trade we do here, had already rejected those trades weeks earlier.
It reads over 500,000 option contracts a day and keeps only the best 0.005%, the ones that pay enough for the risk they carry.
Chip puts stopped clearing that bar before the crash even started. The sector that broke was already a sector my process had walked away from.
Each position already had a plan set weeks ago: let the shares go if a covered call finished in the money, or accept the stock if a put did.
Those plans carried themselves out.
And while the market was scared, I was not staring at a screen trying to decide what to do.
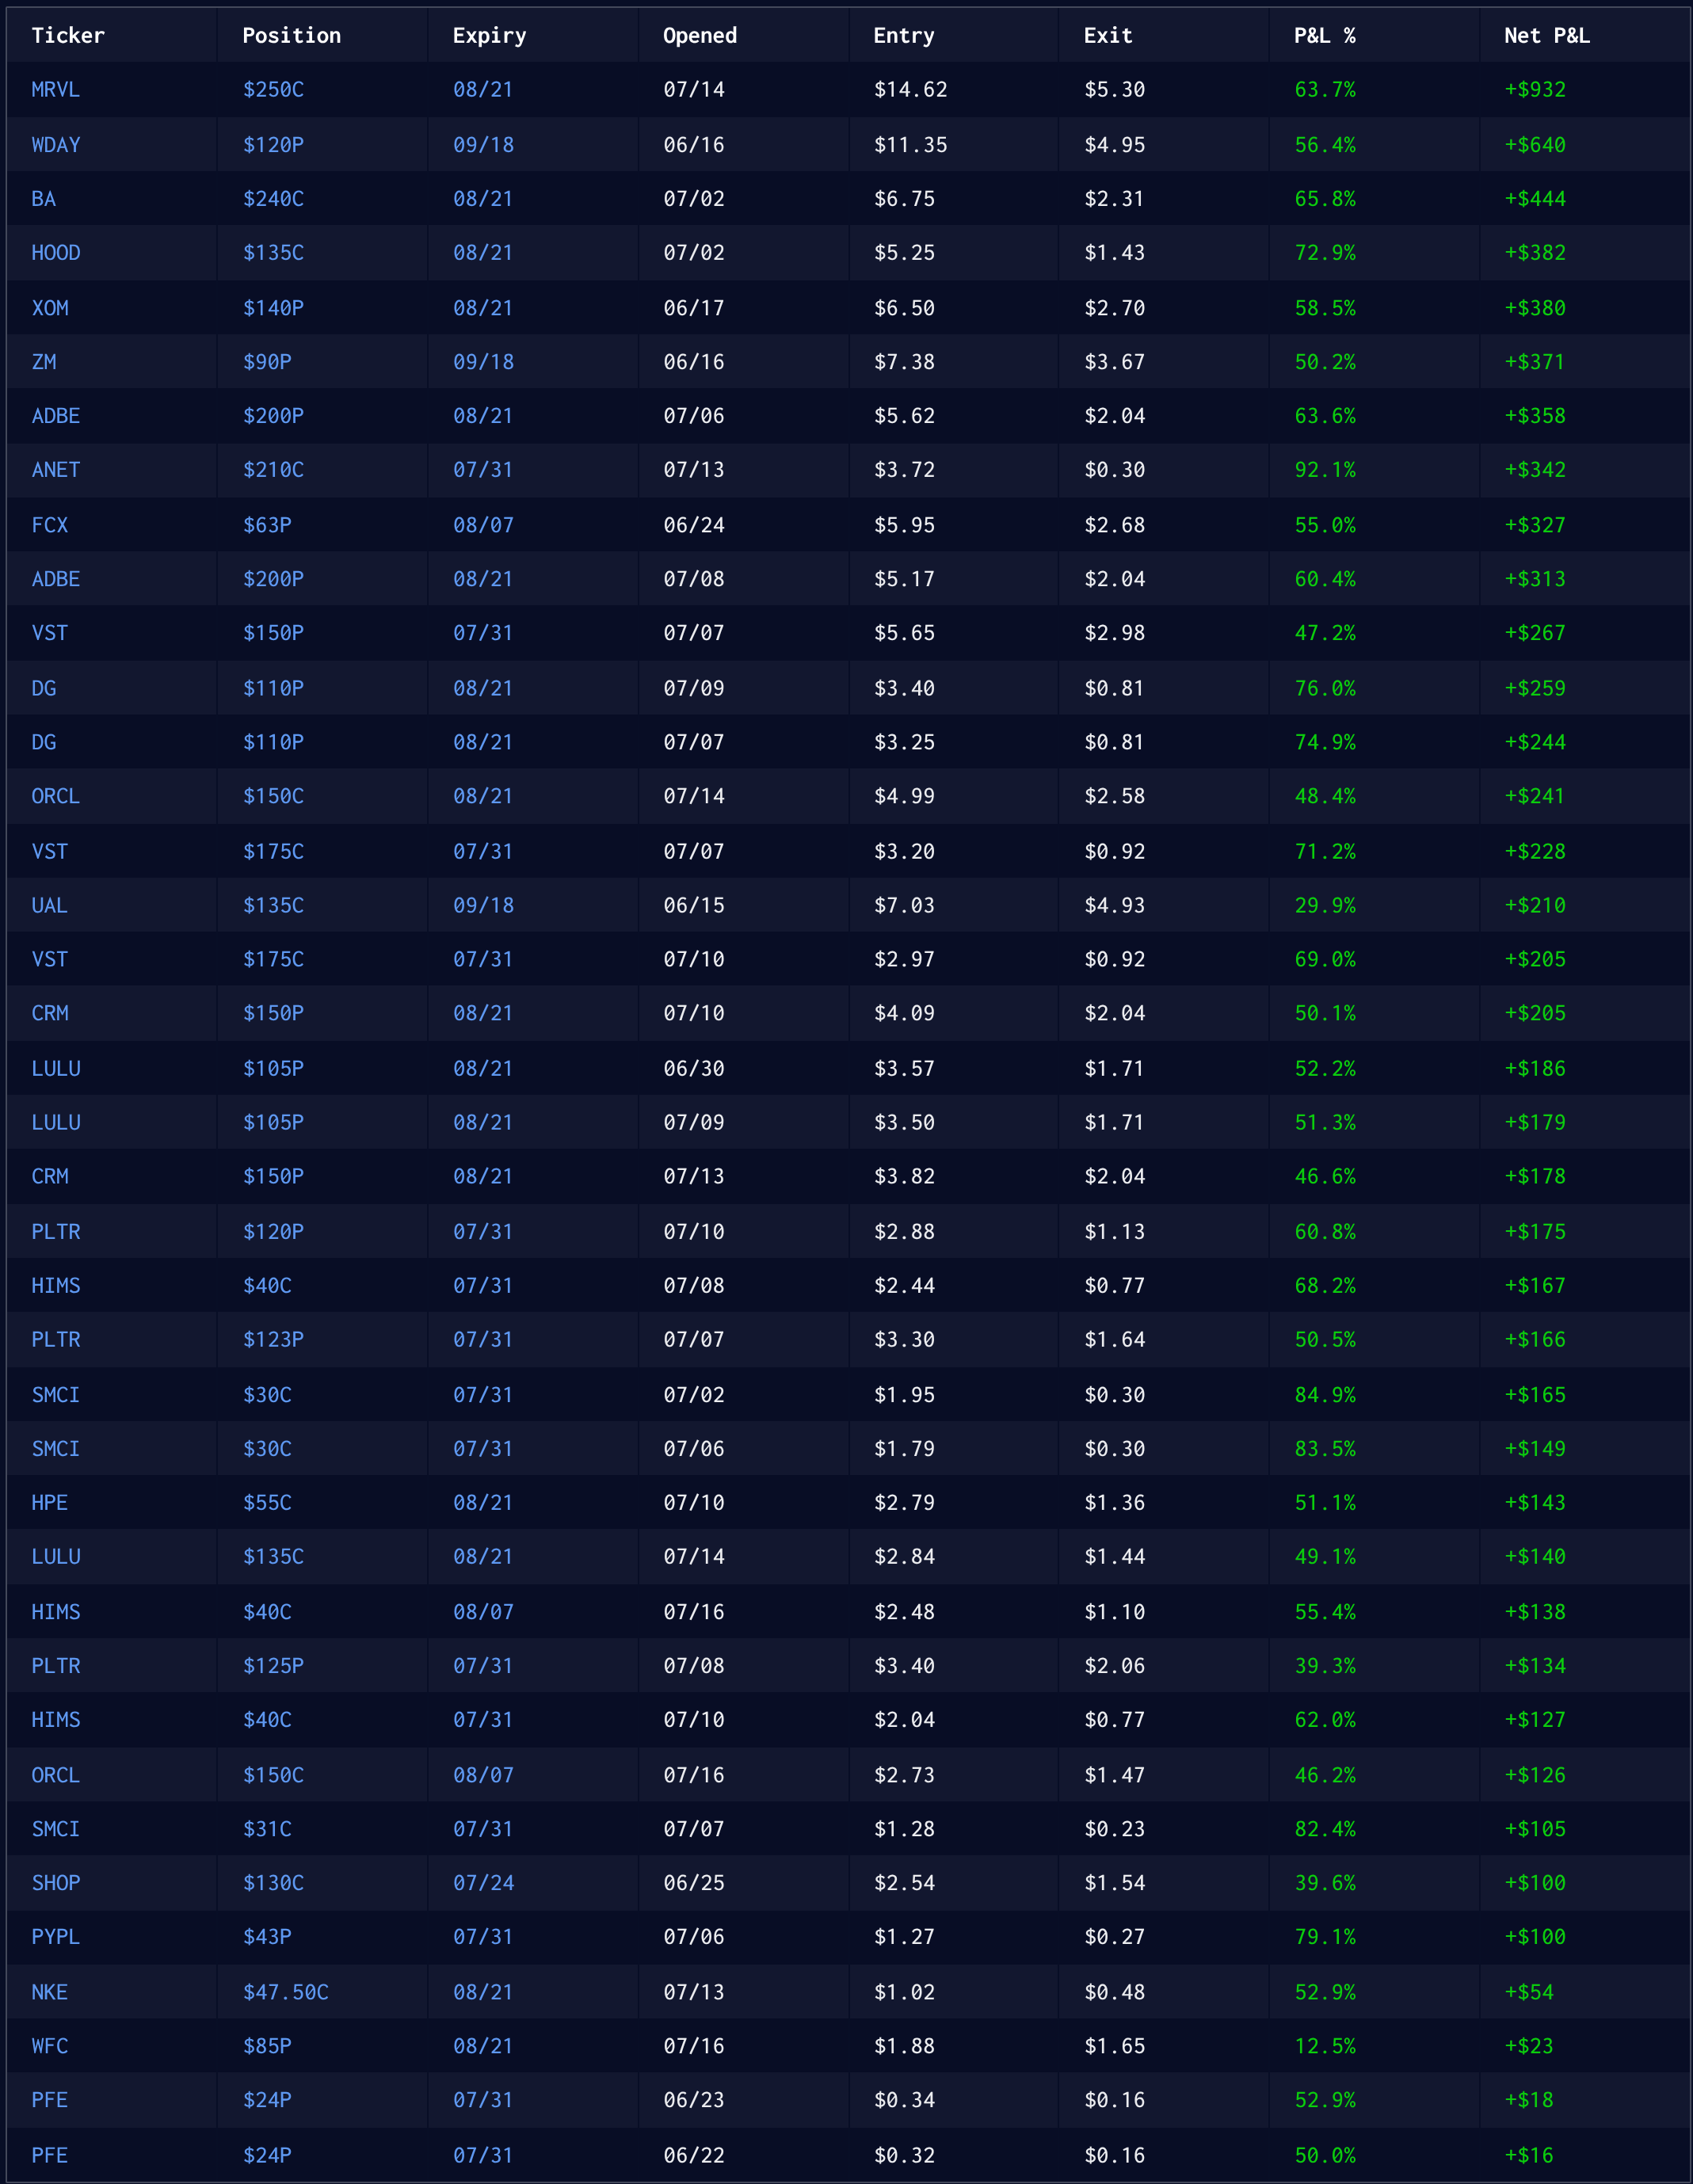
We will look at how the VADER trades did this week
I will explain the three things that can happen to a red put, and give you the one question that tells you which one yours is heading for.
I will walk you through exactly what happens when you get assigned, step by step, so it stops being something to fear.
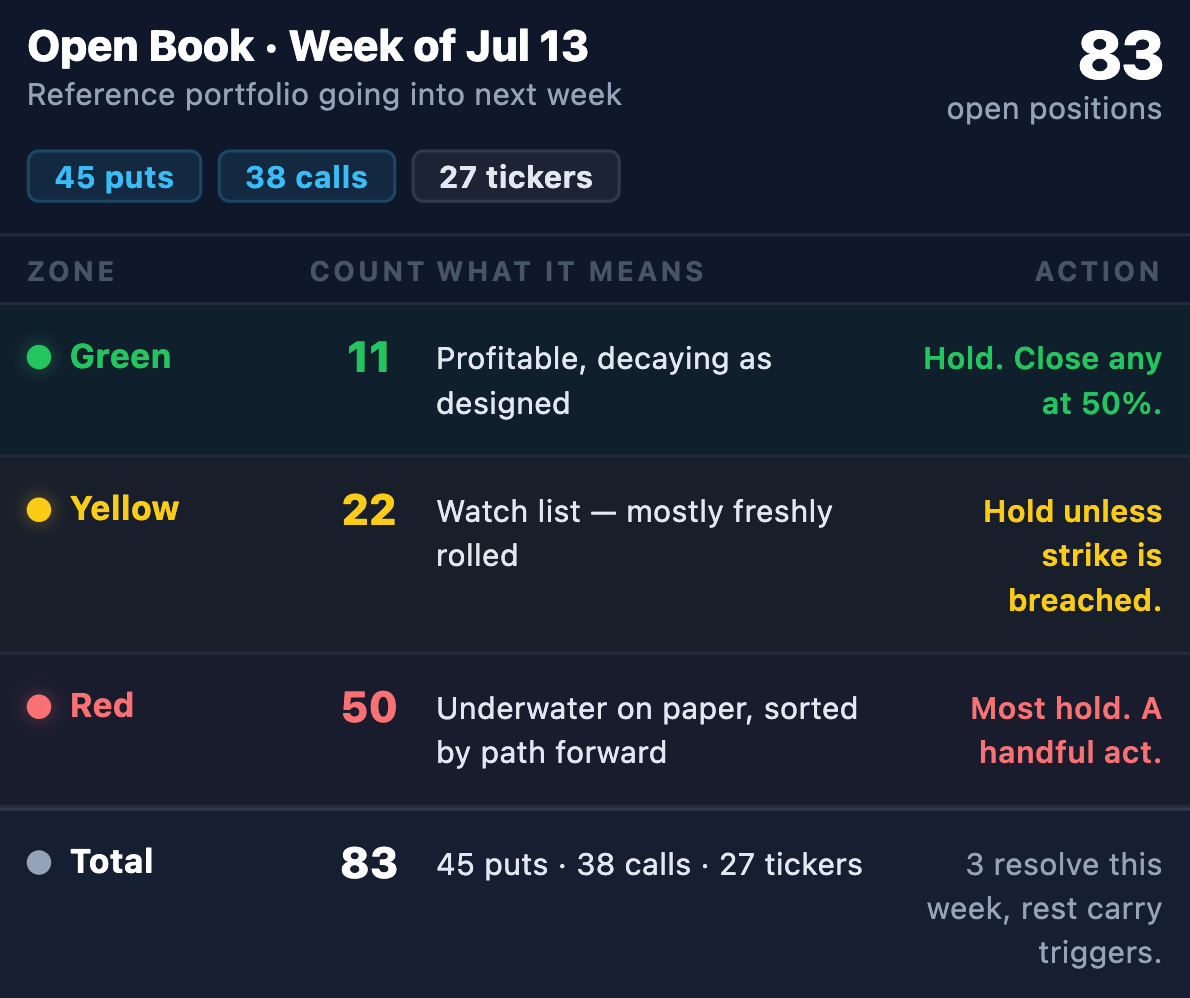
I will hand you my full plan for every open position next week, sorted by zone, with the exact trigger on each one.
So that by Monday morning, you can open your own account and know exactly what to do with every position on your screen.
Before you look at my numbers, here’s a quick way to read your own.
This week split cleanly in two, and where you landed depends on what you were holding, not on anything you did right or wrong.
If you had covered calls on any of the tech or chip names that fell, this was probably one of your better weeks. The stock dropped, the call premium shrank fast, and if you had a take-profit order sitting there, it likely filled on its own.
If you had puts anywhere outside of that selling, energy, retail, healthcare, banks, they probably held up fine, or even improved, because those sectors were untouched by the rotation, or benefited from it.
If you have real pain this week, it is probably concentrated in one place: puts underneath stocks that were part of the falling sector itself.
That is exactly what a sector rotation does. It does not spread pain evenly. It splits a book into a side that gets paid and a side that gets squeezed, and which side you land on depends entirely on what you were holding going in.
Here is how that split played out in my own book:
A sector in a bear market and a 97.5% hit rate can indeed happen in the same week. That is what a book spread across sectors and across both position types looks like during a rotation.
1. Your hit rate. Of everything you closed this week, how many came out as winners, including any roll you executed. A roll close-leg counts as a loss on that leg, even when the full roll made sense. Mine landed at 39 of 40, or 97.5%.
2. Your median days to close. How fast your capital is actually turning over. Mine was about ten days, which means most of that collateral was already back to work by Friday.
3. Your net number. Total cash in from closes and premium, minus whatever you paid to close or roll anything. Mine was $8,488: $8,938 from winners, minus $450 on the one roll I ran.
Your own three numbers will not look like mine, and they should not.
What matters is whether they make sense against what you were holding.
Turn Your Retirement Accounts Into a Real Income Plan
Consider becoming a premium member for $299/year or $49/month.
Every morning, VADER (a proprietary, multi-step screening system) scans ~500,000 option contracts and filters down to the top 0.005%.
You get the best covered call and cash-secured put setups daily (Mon–Fri).
Read more here:
If your account balance is lower this week, and you keep reading me say it was a profitable week, you might think one of us is wrong. Neither is.
Your balance includes the market price of every share you hold, and share prices fell this week for the sector that sold off. That part is the market talking, not the options.
Your trading results are the cash your options actually produced. Premium collected, positions closed, money in. That part is what this report tracks.
Both numbers are true at the same time.
The balance tells you what your assets are worth today. The trading results tell you whether your income process did its job this week.
If your balance is down but your results are positive, your process worked exactly as designed. The shares cost you on paper while the options paid you in cash.
The position is red, it might get redder, and you do not know whether to act or wait.
I was in that exact spot this week, on more than one name.
So instead of telling you not to worry, let me show you the only three things that can actually happen to a put like that, because all three are sitting right here in this week’s results.
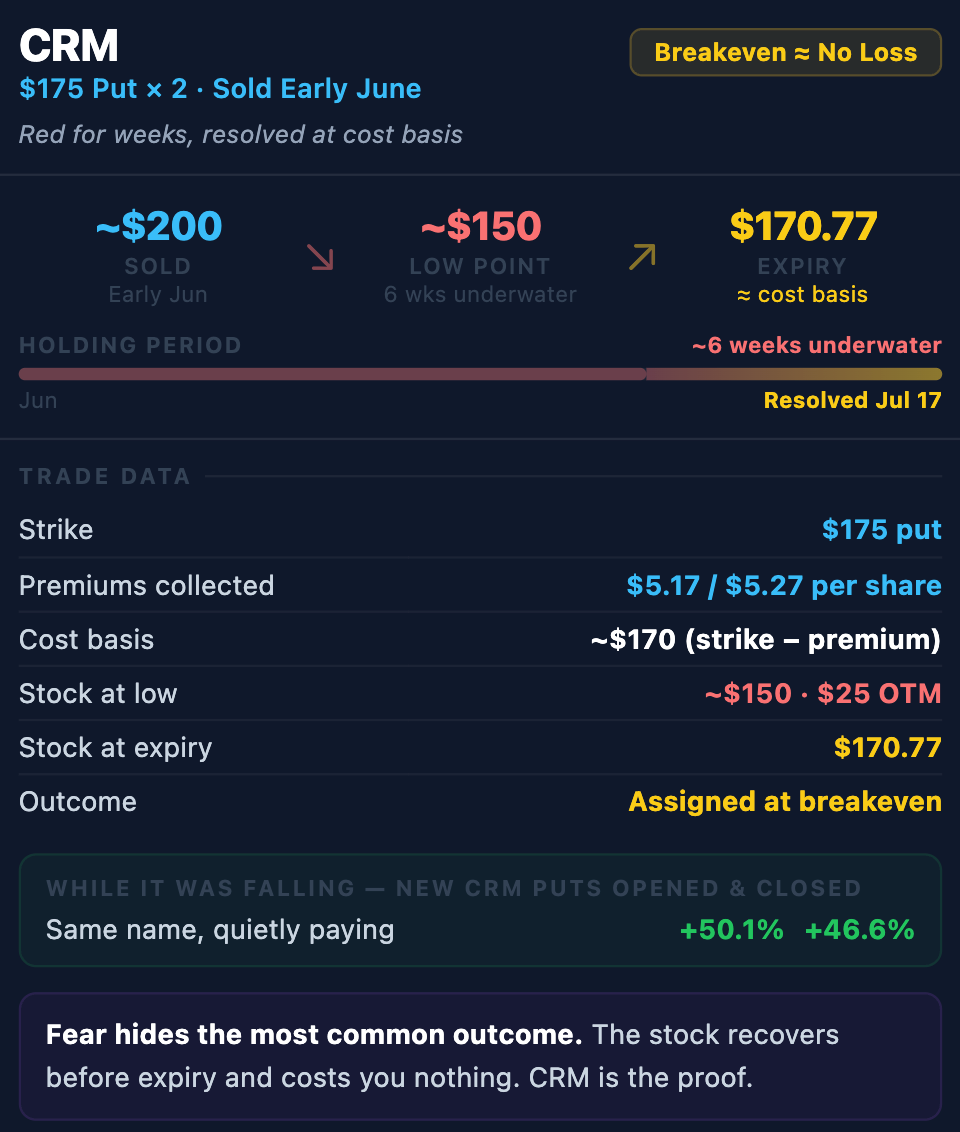
Most common outcome, and it is the one fear hides from you.
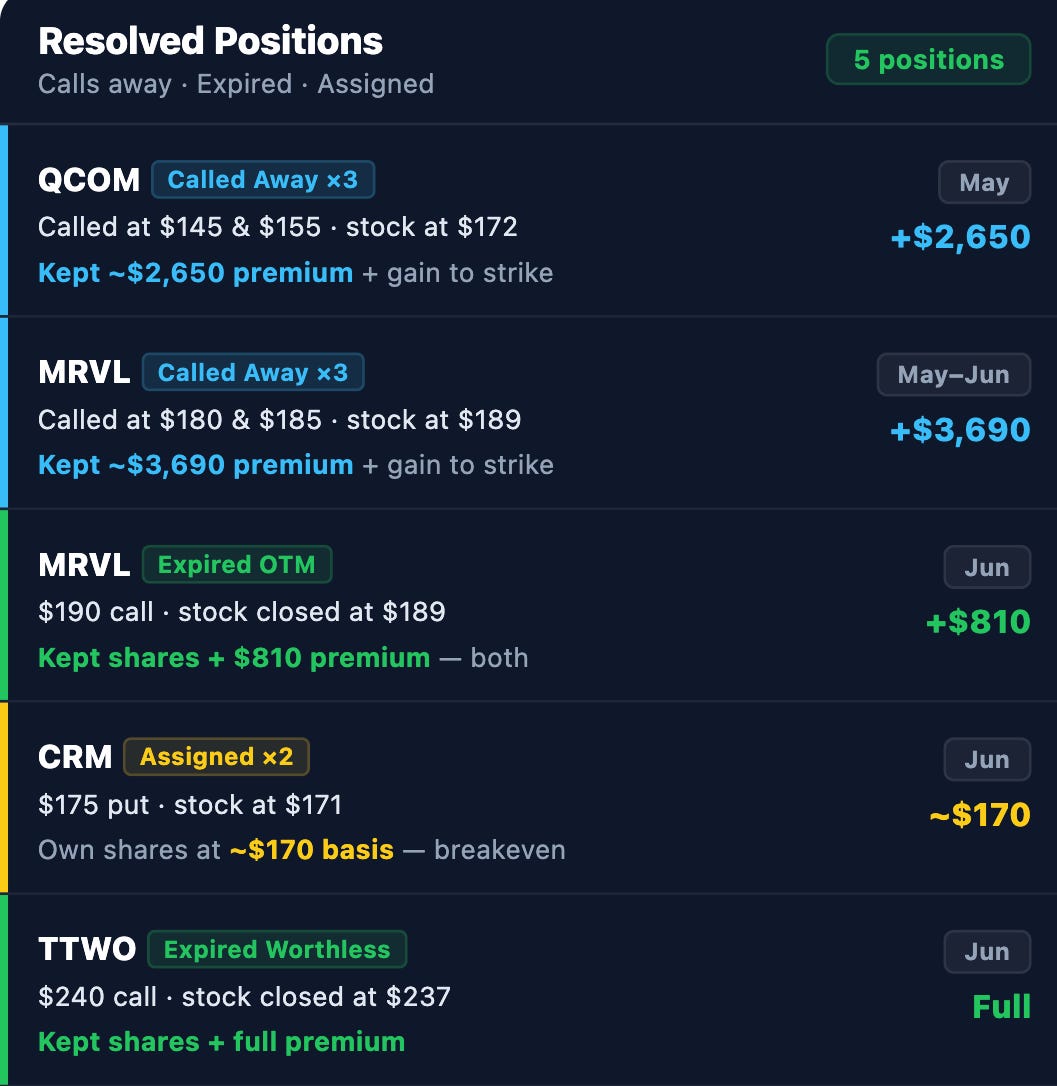
CRM is the proof.
I sold CRM $175 puts back in June with the stock near $200. It then fell to about $150. For weeks it was the ugliest red in the book.
This week it climbed back to about $171, and the puts resolved right at my cost basis of about $170, no loss taken.
And while the stock was falling, I kept selling new CRM puts at lower strikes. Two of those are in the winners table above, closed at 50.1% and 46.6% this week.
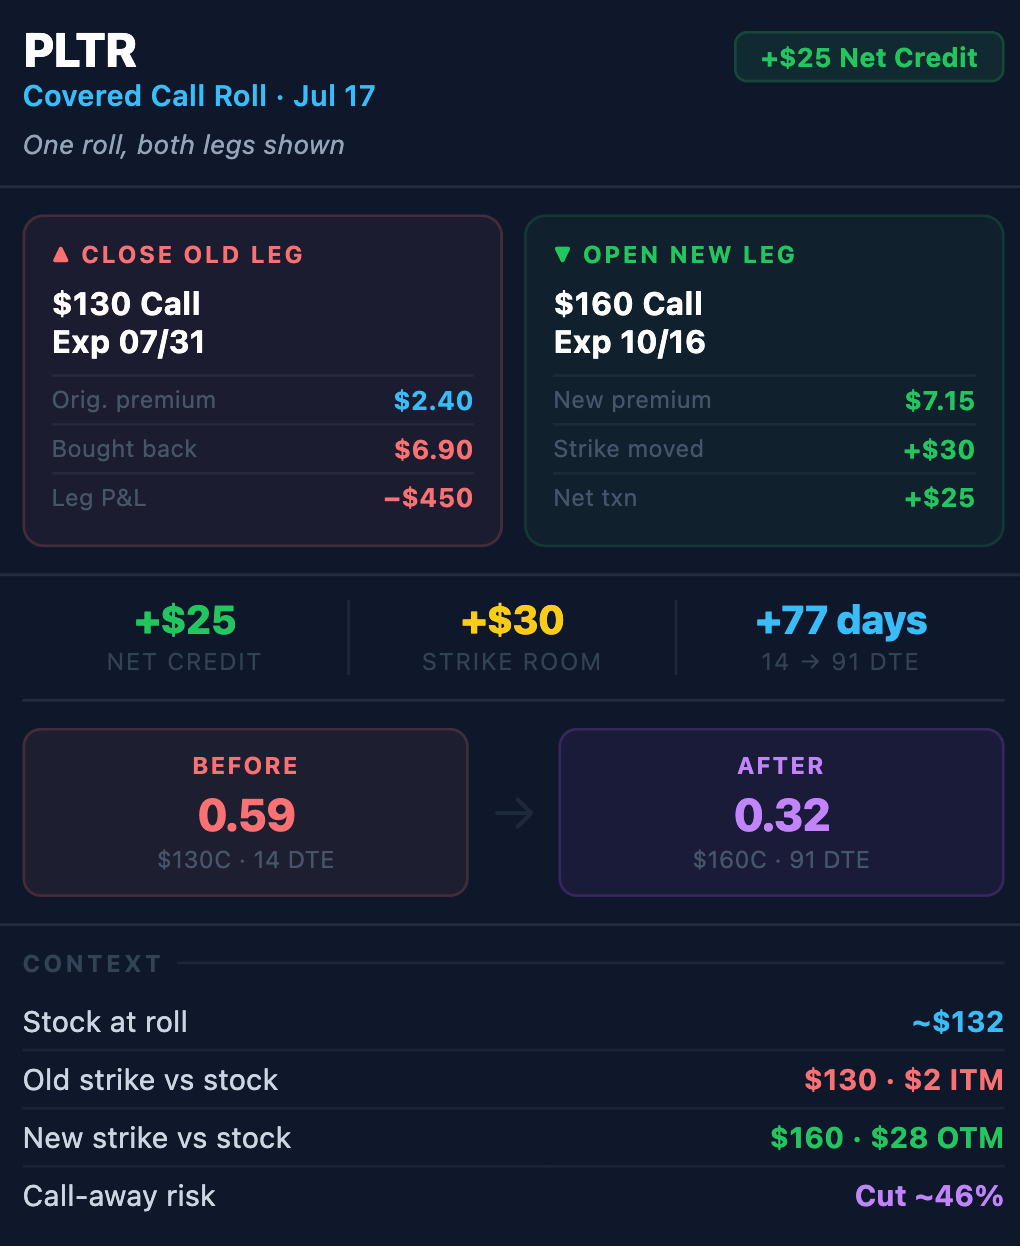
If a position moves against you and you would rather act than wait, you reset it: buy back the current option and sell a new one further out in time, at a strike that gives the stock more room, usually for a credit.
That converts a tense position into a calmer one. My one roll this week was on a PLTR call rather than a put, but the logic is identical.
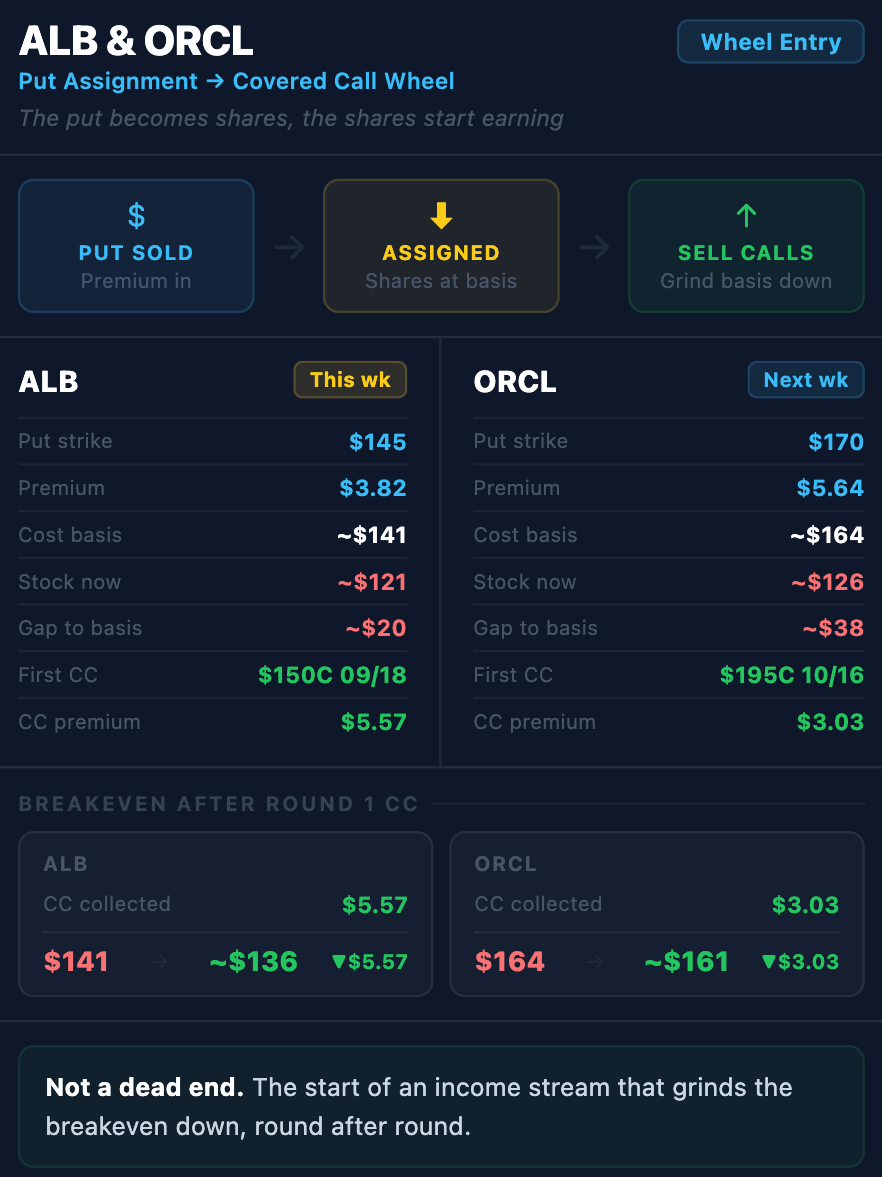
If the stock is still below your strike at expiration and you would be happy owning it there, you take the shares at your cost basis and start selling covered calls against them to bring that cost down.
It is not a dead end, it is the start of an income stream. I have two positions, ALB and ORCL, that are headed here next week
So the question is not “how red is it.”
The question is which of these three futures your position is pointed at.
But for now, the point is simply this: a put being red is not the same as a put being a loss. Almost every red position in my book this week was pointed at one of those three futures, and none of those three is a catastrophe.
Now here is how to look at one of your own red puts and know, in about ten seconds, which one it is headed for.
Two numbers you already have on your broker screen decide it: the delta, and the days left to expiration.
Delta is in your option chain, usually labeled “Delta” or “Δ” next to the bid and ask. For a put it shows as a negative number. Ignore the sign and read the size. Delta tells you how much pressure the position is under right now. Days to expiration tell you how much time it has left to fix itself.
Run each of your red puts through these three checks, in order.
The stock dropped, but the position still has room and time, and time decay is working for you even while the screen is red.
This is where most of my red positions sit, and it is almost certainly where most of yours sit too. The whole plan is a written trigger and patience.
The one real mistake here is the panic-roll: locking in a loss on a trade that was going to recover on its own, the way the CRM card above did.
Do not manufacture a loss out of a position that just needs time.
What to do: Write down the strike as your alert level. Do not look at the position again until the alert fires or a week passes. Checking it every hour does not change the math. It only wears you down.
Real pressure, time getting short.
A roll might be right, but it has to earn its way in.
Before you roll anything, run it through four quick checks:
Find the new position. A lower strike (for a put) or higher strike (for a call), further out in time, that gives the stock real room.
Check the transaction cost. Compare what it costs to buy back the old option against what the new one pays. A credit is best. A small debit can be fine. A large debit is a warning.
Check the delta improvement. The new delta should be meaningfully lower than the old one. If it barely moves, you are paying to push the problem forward without reducing the risk.
Check the close-leg loss in dollars. You are buying back the old option at a loss. Look at that number in real dollars and decide if you can accept it.
If any one of the four fails, hold instead. A bad roll is worse than no roll.
If you have never rolled before, my complete guides walk the mechanics step by step:
What to do:Run those four checks on the candidate before you touch it. Pass all four, roll. Fail one, wait.
The stock is well below your strike and the clock has run out.
A roll here usually costs more than it is worth, so the practical path is to take the shares and put them to work, the way the ALB and ORCL card lays out.
The number that matters is not the gap on your screen. It is your cost basis, strike minus premium collected, and what the first covered call above that basis would pay.
What to do:Before you panic at a deep-red put, do the basis math: strike minus premium collected. Then check what a covered call just above that basis would bring in. That number, not the scary gap on your screen, tells you how bad it actually is. Usually it is a lot less bad.
Sort first. Act second.
The red count does not tell you how much trouble you are in.
The delta and the date do.
And once each position has its future and its trigger written down, there is nothing left to stare at.
Of the three possible futures, assignment is the one that scares people most.
The stock keeps falling, the put goes deep against you, and one Friday you get handed the shares at a price well above where the stock is trading.
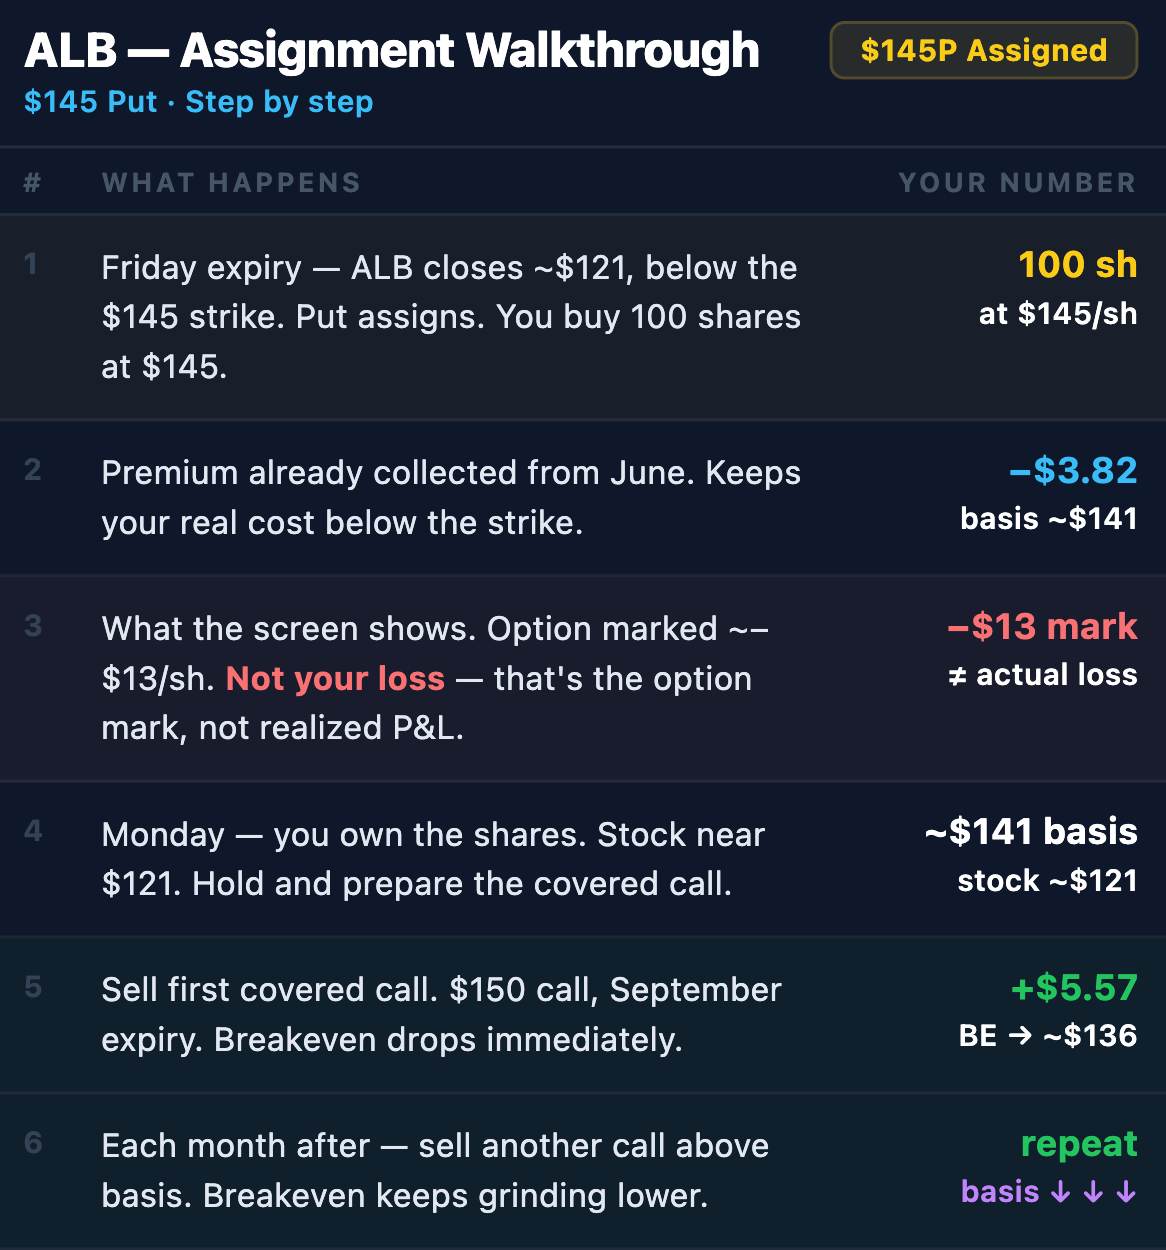
So let me take the scariest one in my book right now and walk it start to finish. By the end there is no mystery left in it.
The position is ALB.
I sold the $145 put in June with the stock around $157. The materials sector then rolled over, ALB fell hard, and by expiration Friday it closed near $121. My put finished deep in the money, showing a loss of about $13 a share if I closed it.
I am not closing it. I am taking the shares.
Three steps:
When a put you sold finishes in the money, your broker converts it to stock. You buy 100 shares per contract at the strike. No margin call, no scramble, no penalty. For ALB, I buy 100 shares at $145, automatically, over the weekend. Nothing to do.
I collected $3.82 a share in June and keep every cent. So my real cost is not $145. It is $145 minus $3.82, about $141. That is the number that matters, already better than the strike on your screen.
The moment I own the shares I sell a call against them. For ALB, the $150 call in September pays about $5.57, which drops my breakeven from $141 toward $136. Next month I sell another, and it drops again.
This is not magic, though.
If ALB keeps falling faster than the calls bring my basis down, I stay underwater on the shares for a while. Assignment does not erase a decline. It turns a falling position you are just sitting in into a structured one that pays you every month and lowers your cost the whole way.
That is a very different thing from owning a sinking stock with no income.
I wrote the full step-by-step, including how to pick the strike and when to let the shares go, etc. If assignment is the part that has always worried you, start there:
And this Friday, a batch of my positions resolved at once, assignments and call-aways both, and not one needed a decision from me:
Every one of those was decided weeks ago, in a calm market, so the plans just ran.
That is what I meant at the top by not managing anything under pressure. Not because the week was easy, but because the deciding was already done.
The reference portfolio goes into next week with 83 open positions: 45 puts, 38 calls, across 27 tickers.
I will be back tomorrow with the Monday Options-Selling Plan, covering the setups I am watching for the week ahead and how I plan to put the freed collateral to work.


Comments
Nothing yet. Say the first thing.
Sign in to join the conversation.