Mike Thornton | The Multiplier · The Multiplier | Retirement Income with Options
The Multiplier is an educational approach to building retirement income by selling covered calls and cash-secured puts on quality stocks you own or want to own, alongside dividends and short-term Treasuries, with the goal of funding retirement spending from income rather than by selling down your principal.
If those two terms are new to you, here is the whole idea in plain English.
A covered call means you collect a cash fee today for agreeing to sell shares you already own at a higher price than today’s.
A cash-secured put means you collect a cash fee today for agreeing to buy a stock you want at a lower price than today’s.
Every obligation here is fully covered from the start. No margin, no borrowing, no naked positions. That is what makes selling options the conservative side of the options market, and it is a real distinction.
Why the skill of selling options matters for your retirement
Most retirees have one plan: save enough, then sell shares slowly to live on. That plan worked when bonds paid 5% and lifespans were shorter. It does not work as well now.
Selling options gives you a second income stream from the same portfolio. You keep the shares. You keep the dividends. And you get paid premium on top.
If you’re new to this approach, I explain the reasoning in detail here:
Every Sunday, I publish the same type of review.
What we closed and how much income was actually locked in. What we rolled, and whether it was done for credit or debit, and why. What we held, and what we’re watching going into the next week.
Because if you strip it down, selling options comes down to three decisions you repeat over and over: hold, close, or roll.
Learning when to do each using rules is skill we learn here.
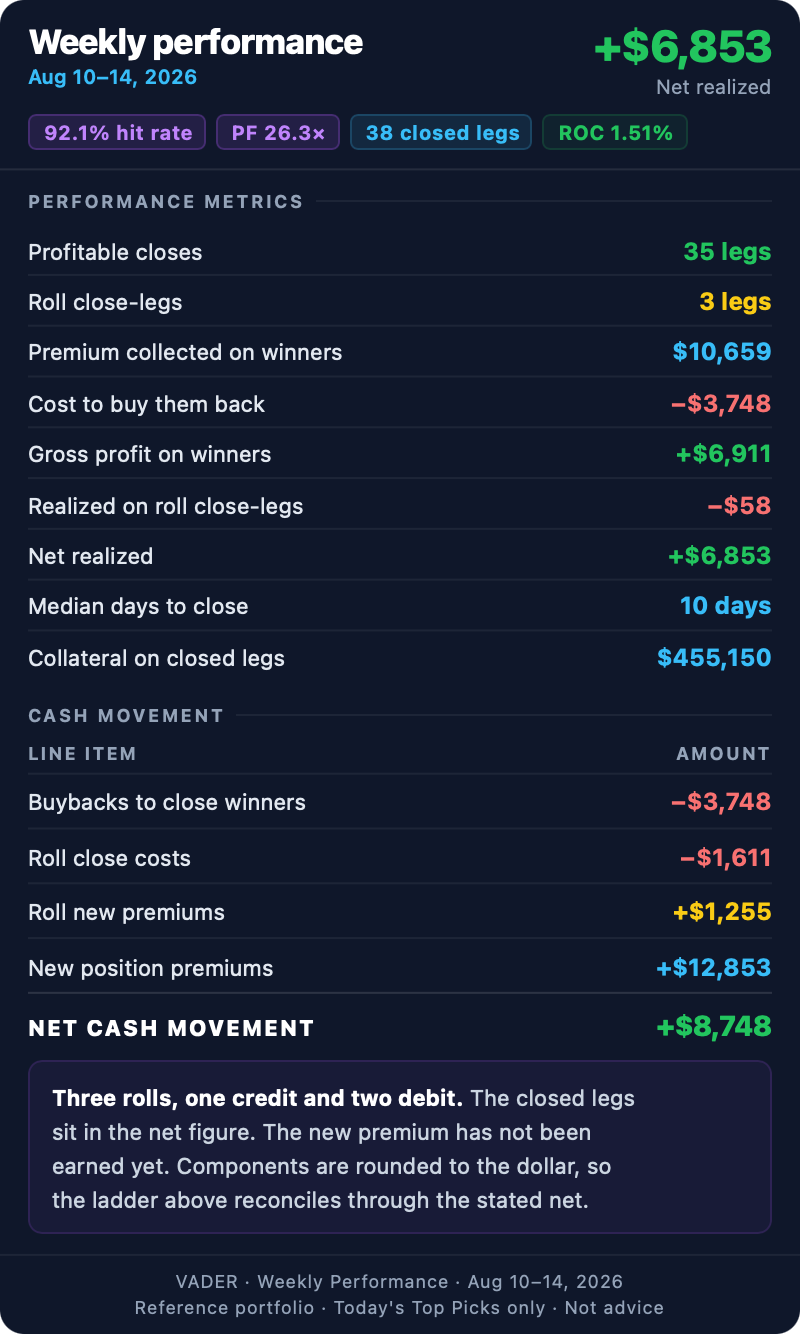
This week, my VADER setups produced $6,853 in realized profit across 38 closed legs. That came from 35 profitable closes and three roll close-legs, plus one covered call that went to expiry and had its shares called away.
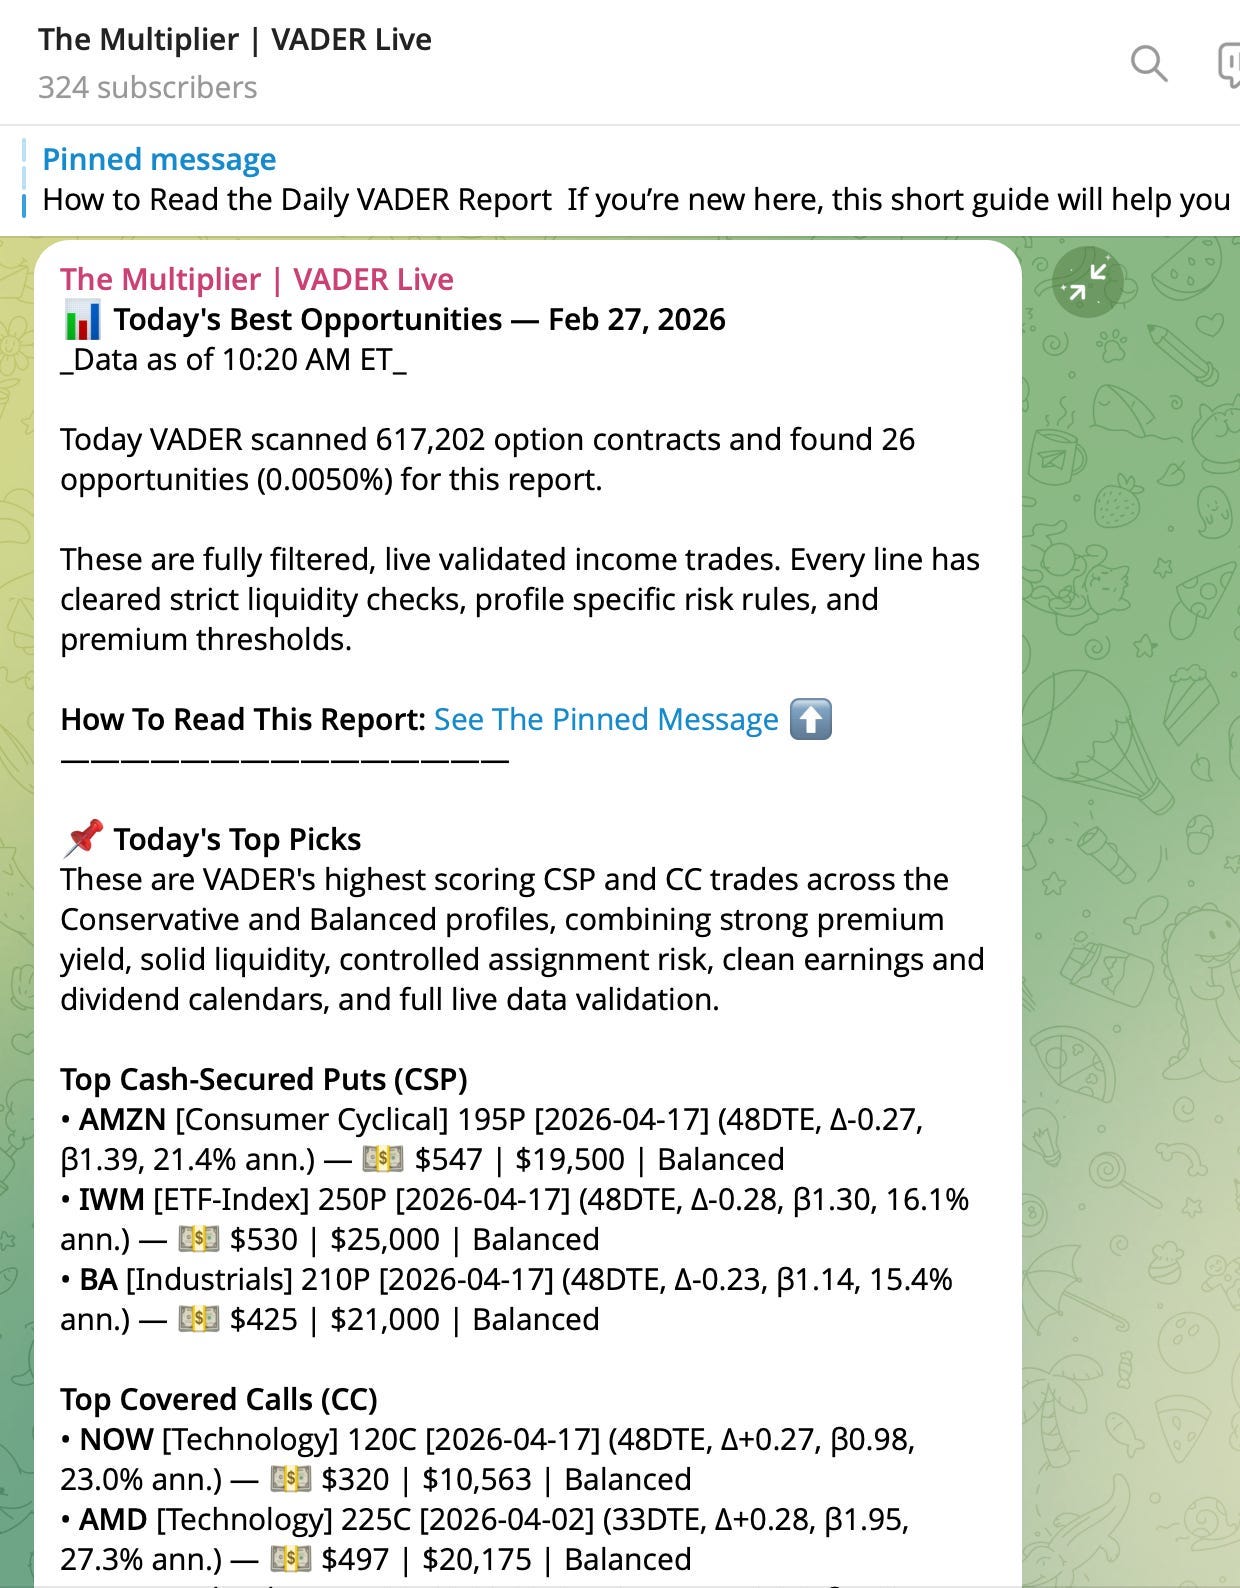
VADER is my screening algorithm. It reads more than 500,000 option contracts every day and keeps the top 0.005%, the handful where the premium being paid is actually worth the obligation you take on.
Premium members receive those setups in real time, Monday through Friday, in the private Telegram channel.
This is what it looks like:
And then on Sunday, we review the results of VADER trades, explain the decisions, and map out what to do next with open positions.
There is no risk in giving it a try. Join today and use the full system for 60 days.
You can cancel the subscription anytime.
If at any point during those 60 days you decide it’s not right for you, email ‘refund’ to mike@themultiplier.co. I’ll process it within 24 hours, no questions asked. You keep everything you’ve learned.
The Multiplier is a Substack Bestseller. 420+ people have already upgraded, and you can read their feedback below.
Reply to this email if you have any questions. If you are reading this on the web, you can reach out to me in DMs or at mike@themultiplier.co
How to tell whether to roll a losing position again or finally stop. Three numbers, all of them already on your screen: the hole against the new credit, the strike against the stock, and every leg against its stop line. This is the whole issue.
What a roll chain looks like when it ends well. A put that walked its strike from $135 down to $116 while the stock fell, then finished this week keeping 97% of its premium.
A roll that did everything right and still booked a $263 loss. Both of those things are true at once, and the scorecard shows why.
What happens the day your shares actually get called away. ORCL settled at $150.52 against a $135 strike. What that outcome is really worth.
Every open position with an action and a trigger next to it. All 87 trades, one row each, in a spreadsheet you can download and search by ticker.
Let’s start with the numbers.
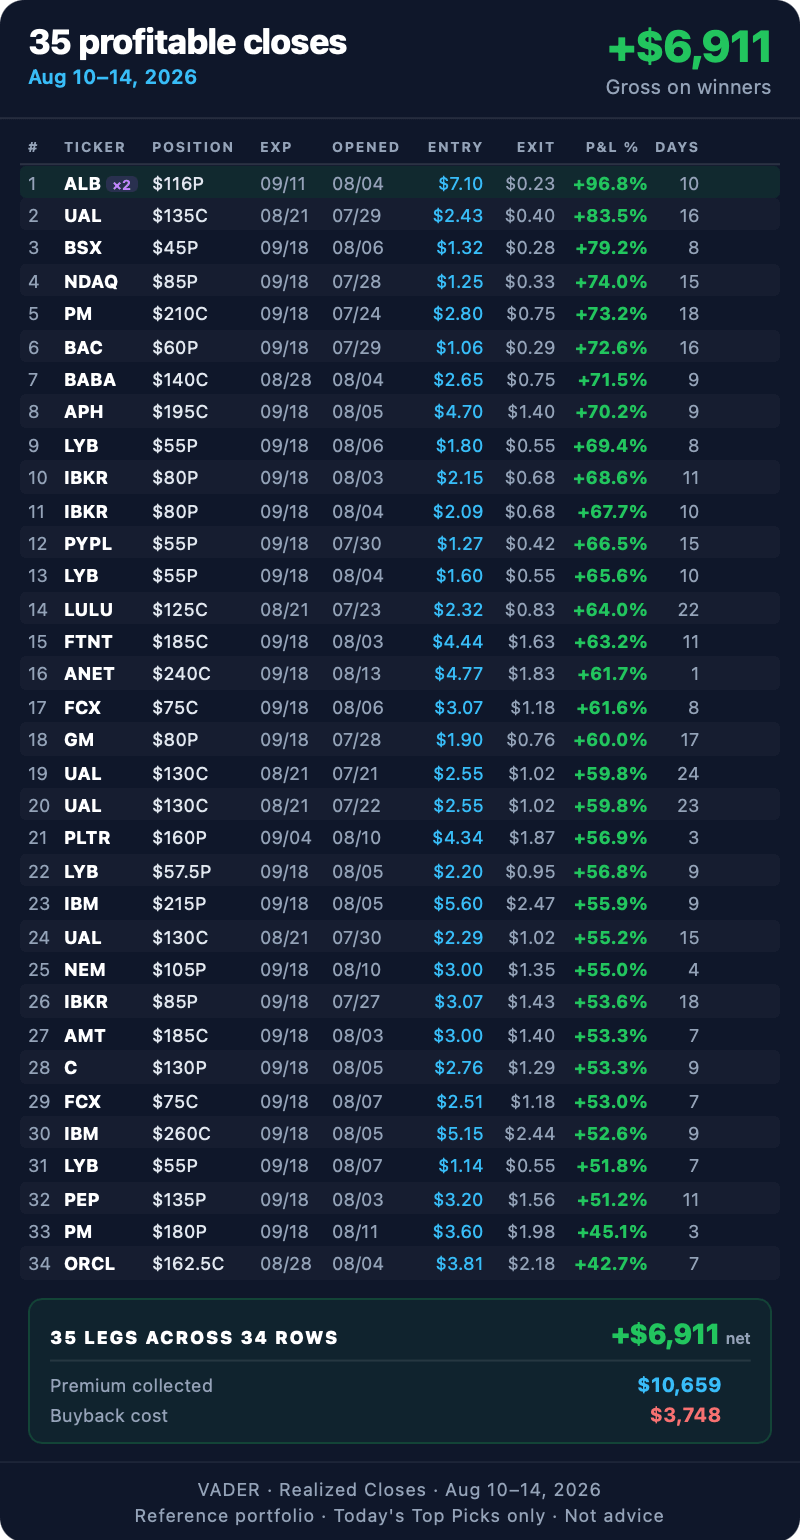
Almost everything closed this week made money. Thirty-five of the 38 legs we closed were profit-target closes, which is a 92.1% hit rate. The other three were roll close-legs, and those count against us regardless of what they printed.
The winners brought in $6,911. The roll close-legs cost $58. That leaves $6,853 net, which is the headline number and the only one I quote.
Most positions closed in about a week and a half, a median of 10 days. Collateral that comes back that fast can be put to work again the same month, which is where the compounding comes from.
For every dollar lost on the one leg that closed down, roughly $26 came in from the winners. Those 38 closed legs had $455,150 of collateral tied up against them and returned 1.51% on it in a week.
How I count this
A close for a profit counts as a win.
A roll close leg counts as a loss, and it sits in the denominator. That is why the hit rate is never 100% in a week with rolls.
An assignment counts as neither. It is a transition, and the shares carry their own basis forward from there.
The headline number is net of all of the above.
We also opened 38 new positions and collected $12,853 in fresh premium against them, which is why the account saw net cash of about $8,748 come in across the week.
One piece of market context matters here, and only because it explains the pattern in the closures. Volatility fell all week. The VIX opened Monday at 15.46 and closed Friday at 14.25, the lowest reading of the period. When implied volatility drops, every option you have already sold gets cheaper to buy back, even on a day the stock does not move at all. That is why so many positions came home in the same few sessions.
New to this? Implied volatility is the market’s estimate of how much a stock will move before the option expires. It is baked into the option’s price. When it falls, option prices fall with it, which is good news if you are the one who sold the option and bad news if you are looking to sell a new one.
Here is the pattern in one line: about two-thirds of that table closed inside two weeks, and it closed because the standing orders were already sitting there when the prices came to them.
The position worth studying is near the top, and it took two months to get there.
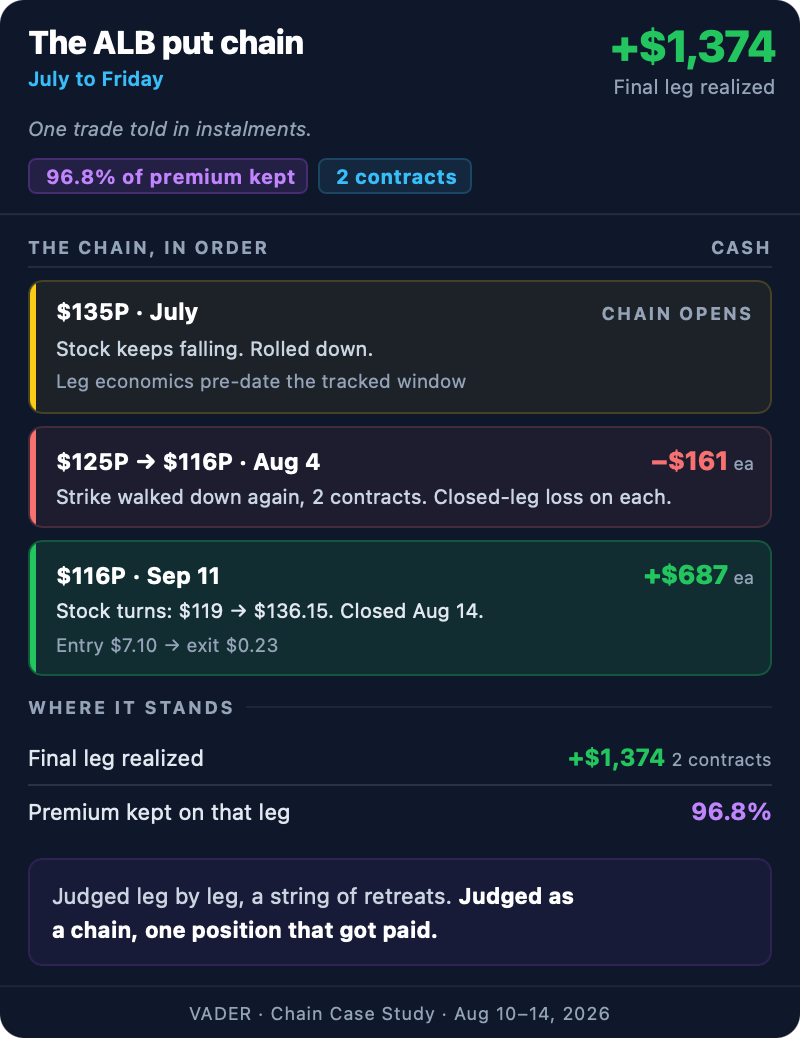
ALB $116 put, expiring September 11, closed Friday keeping roughly 97% of its premium. On its own, just a good trade. What makes it worth studying is where it came from.
This position is the last leg of a chain that opened at a $135 strike in July. ALB kept falling, so the chain walked down with it: first to $125, then on the fourth of August to $116, each step paid for by closing the old leg and selling a new one. The step down from $125 gave back about $320 in closed-leg losses across the two contracts, the earlier step carried its own cost, and both sit in the record where they belong.
Then the stock turned. ALB ran from around $119 at the start of August to just over $136 by Friday, the $116 puts collapsed to about $0.23, and we closed both contracts keeping about $6.87 a share, roughly $1,370 on the final leg.
A roll chain is one trade told in installments. Judged leg by leg it was a string of retreats. Judged as a chain it was one position that kept lowering its obligation until the stock found its footing, and then got paid. That is the standard a chain should be held to, and the next section is the test for the chains that stop meeting it.
Turn Your Retirement Accounts Into a Real Income Plan
Consider becoming a premium member for $299/year or $49/month.
Every morning, VADER (a proprietary, multi-step screening system) scans ~500,000 option contracts and filters down to the top 0.005%.
You get the best covered call and cash-secured put setups daily (Mon–Fri).
Read more here:
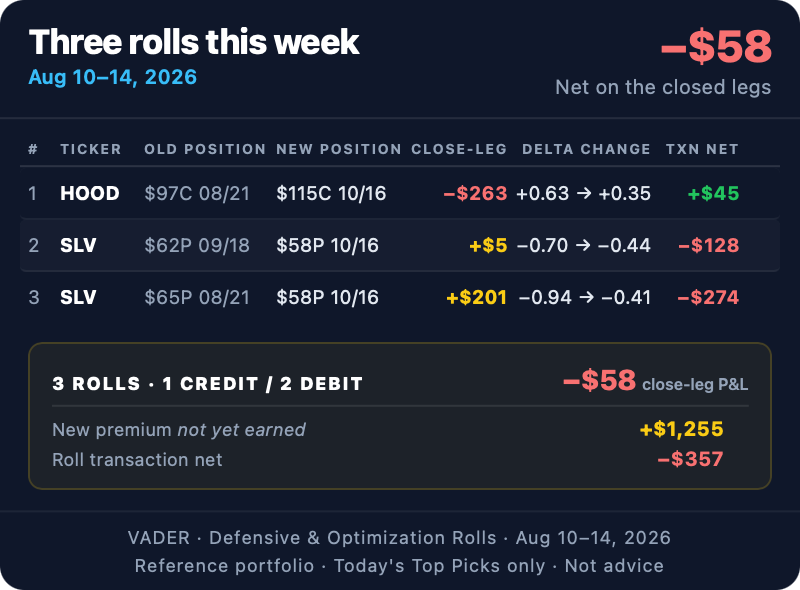
Three rolls this week, and they show the two very different jobs a roll does.
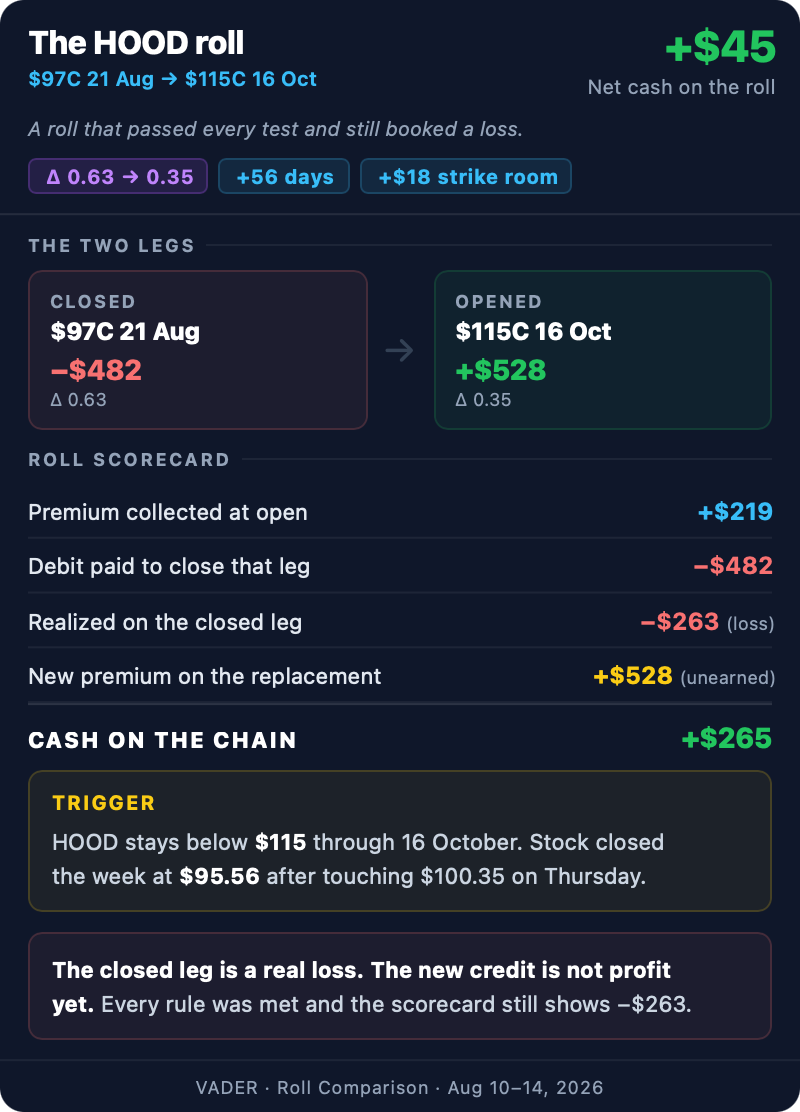
HOOD $97 call, expiring August 21, rolled out to a $115 call expiring October 16. HOOD ran to about $100 on Thursday. The call went into the money and its delta pushed past 0.60, which is the level where a covered call stops being a covered call and starts being a short stock position with a cap on it.
We rolled it out and up, for a net credit.
How this roll is scored
Premium collected when the position opened: $219
Debit paid to close that leg: $482
Realized on the closed leg: a loss of $263
New premium collected on the replacement leg: $528, not yet earned. It has to decay before it becomes profit.
Cash on the chain so far: $265. What has to happen from here: HOOD needs to stay below $115 through October 16.
That roll passed every test a defensive roll should pass. It collected a credit rather than paying one. It moved the strike from $97 up to $115, giving back about 18% of room. It cut delta from roughly 0.63 down to about 0.35. And it still booked a $263 loss on the leg that was closed.
Both of those are true at the same time, and that is the thing readers keep getting stuck on. The loss on the closed leg is real and it goes in the record. The credit on the new leg is not profit yet, it is an obligation you have been paid to take on again.
The other two rolls are the opposite case, and they are the reason this issue exists.
Both were SLV puts, one at $62 and one at $65, rolled down to a single $58 strike in October. Both cost money to do, about $128 and $274 in net cash. And both sit on chains that have been rolling since May.
Each chain has collected four figures in premium across three legs and given a chunk of it back in closed-leg losses, every loss stated rather than netted away.
A roll moves a loss forward in time. Only the next leg’s premium can make it smaller.
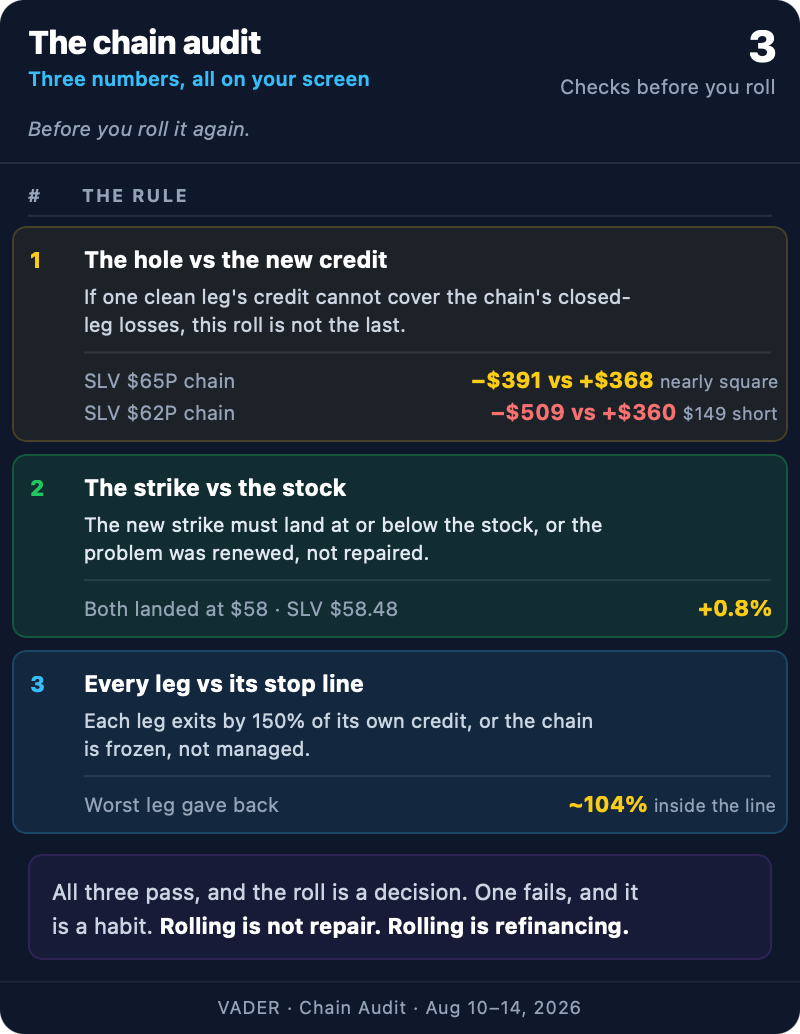
Before any chain gets rolled again, it takes the same three-number audit. You can run it on any losing short option you hold, using nothing but your fill history and your broker screen.
One: the hole against the new credit. Add up what the chain has lost on closed legs, then look at the credit the new leg collects. The $65 chain is down $391 and its new leg collected $368, so one clean leg nearly squares it. The $62 chain is down $509 against a new credit of $360, so even a perfect leg leaves it $149 short. When the hole grows faster than one leg’s credit can fill it, each roll is borrowing from the next.
Two: the strike against the stock. A repair has to get the strike back to the right side of the price. Both rolls moved down to $58 with SLV at $58.48, a cushion of less than one percent. Thin, but on the correct side. A roll that leaves the strike still through the stock has not repaired anything. It has renewed the same problem at a later date.
Three: every leg against its stop line. Each leg in this book carries a maximum loss of 150% of its own credit, and a chain is only a managed retreat while every leg exits inside that line. Across both silver chains the worst single leg gave back about 104% of its credit before it was closed. Painful, but inside the line. A chain holding a leg past its stop is not being managed. It is being avoided.
The audit’s reading this week: the $65 chain is one clean leg from square, and the $62 chain needs that leg plus part of another. Both new legs sit just out of the money with take-profit orders already working at half their credit. The audit does not close either chain today. It puts a number on how much more each one has to earn, which is the difference between rolling with a plan and rolling to avoid a decision.
Rolling is not repair. Rolling is refinancing. Run the three numbers before every roll. When they stop working, taking the shares or taking the loss is not the strategy failing. It is the audit doing its job.
One position resolved this week, and one is almost certain to resolve on Friday.
ORCL $135 call. This call was written on July 24 for about $3.00 a share. ORCL closed Friday at $150.52, well above the strike, and the shares were called away at $135 at expiry. The premium stays, $297 on the leg.
A covered call that finishes in the money is the trade working as designed: you agreed to sell the shares at the strike, you were paid to agree, and the buyer took you up on it. The number that decides whether it was a good trade is the strike plus every premium collected, measured against what the shares cost you. Not the red figure on the option line.
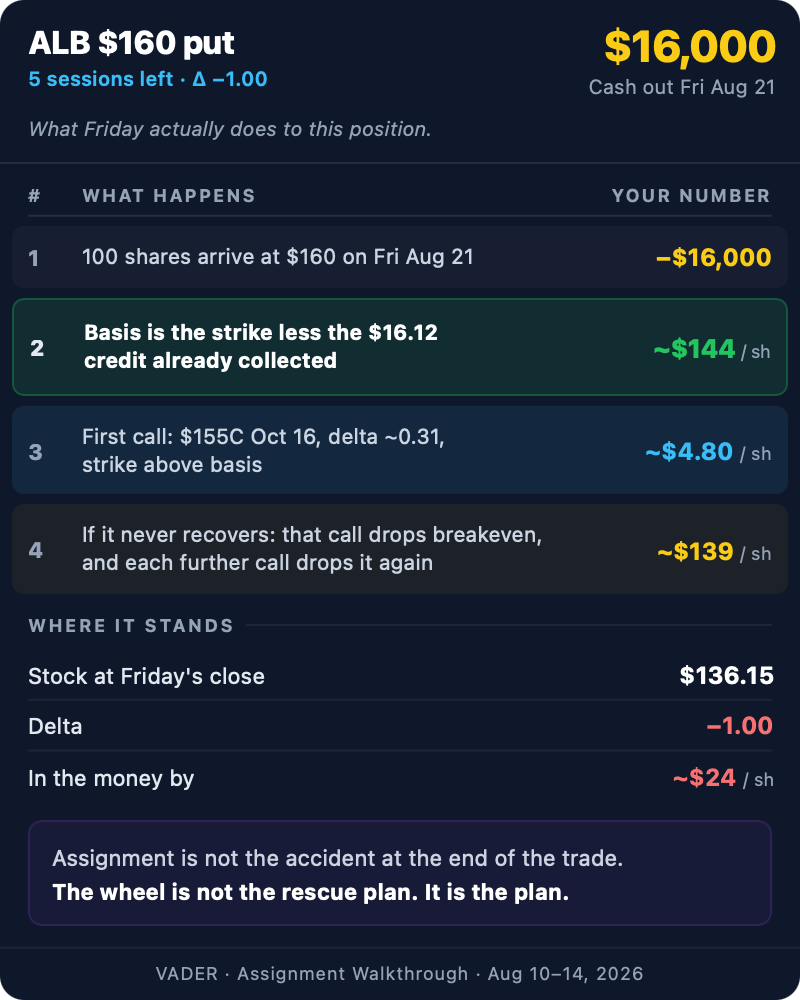
ALB $160 put, expiring August 21. ALB closed Friday at $136.15, so this put is roughly $24 in the money with five sessions left and a delta of -1.00. There is no realistic roll and no reason to pay to escape it. It will be assigned. Here is the whole path.
The shares arrive. 100 shares of ALB at $160 on Friday, August 21. $16,000 of cash leaves the account and comes back as stock.
The basis after premium. The credit collected on that leg was $16.12 a share. Strike minus premium puts the cost basis at about $144 a share. That figure is why the credit was so large in the first place: this position was rolled down from a $190 strike in June, and deep rolls collect big credits.
The first call. Against those shares we would write a $155 call for October 16, worth about $4.80 a share at Friday’s prices, delta around 0.31. Note where that strike sits. It is above the $144 basis, which means a call-away at $155 is a gain of about $11 a share on top of the premium. Never write a call below your basis to chase premium. That is how a manageable position becomes a locked-in loss.
If ALB never recovers. ALB sits around $136 today, below the basis. That is a paper loss, and it stays a paper loss until you sell. Meanwhile the $4.80 from that first call drops the breakeven to about $139. Write another call after October and it drops again. The position stops being underwater when the basis falls below the price, and the calls are the mechanism that gets it there. Slowly, and only if you keep writing them.
Assignment is not the strategy failing. It is the strategy doing the other thing it does. You sell a put because you are willing to own the stock at that price. When the market takes you up on it, you own the stock at that price, and you switch from collecting put premium to collecting call premium on the same capital. The wheel is not a rescue plan. It is the plan.
Every position in these tables came from the Today’s Top Picks section of a daily report. If you took a setup from further down the daily list, it will not be here, and that is by design rather than an oversight.
87 open positions going into the week. 55 covered calls and 32 cash-secured puts. Green 23, yellow 24, red 40. That red count is mostly one thing: 33 of the 40 are covered calls the rally pushed into the money, which are capped positions rather than damaged ones.
Two dates shape the week. Wednesday brings the minutes from the July Fed meeting, where three officials voted for a rate hike, and that is the one scheduled event capable of moving volatility off its lows. Friday is monthly expiration, and 14 positions resolve on it: 13 covered calls heading for call-away and the ALB put above. If that put assigns, about $16,000 of cash needs to be sitting there on Friday.
Everything expiring Friday gets decided by Wednesday, not on Friday afternoon. The rest of the book runs to September 18, where 46 positions are clustered.
The full position-level plan is in the attached workbook. One row per trade, every row carrying this week’s action and the exact trigger that changes it, sorted red, yellow, green.
That file is open to everyone, subscriber or not. If you hold none of these positions, download it anyway and read the red section. Eighty-seven live positions with a written decision beside each one is what managing a full book actually looks like.
Almost every position we closed came home this week, and none of that came from being clever about direction. It came from selling into higher volatility a week or two earlier and then having orders that fired without anyone watching.
Your fills are a report on the market, not a report on you. A week where everything closes early is a week where volatility fell. A week where nothing fills is a week where it rose, and the answer then is patience, not a change of plan.
Premium available on Monday will be thinner than it was a week ago, for the same strike and the same days to expiry. That is a reason to be pickier, not a reason to sell more contracts to make up the difference.
And if you have not sold anything yet, you can still practice the part that matters. Pick one stock you would be happy to own, find the put you would sell on it, and write down the three prices that would make you act: where you take the profit, where you roll, and where you walk away. No money, no order. Four weeks of that builds the habit everything above depends on.
Disclaimer: This content is for educational purposes only and is not financial, investment, or tax advice. I am not your personal financial advisor or tax professional, and nothing here is a recommendation to buy, sell, or hold any investment, or to take any specific tax-related action. Past performance is not a guarantee of future results. You are responsible for your own financial and tax decisions, so always do your own due diligence or consult a qualified professional before acting.


Comments
Nothing yet. Say the first thing.
Sign in to join the conversation.