Mike Thornton | The Multiplier · The Multiplier | Retirement Income with Options
A reader wrote to me months ago asking how high delta gets before it changes what you are supposed to do.
His words were “how high is too high?” I didn’t have a clean answer for him then.
This week the book produced one. Fifty-nine legs closed and every decision sorted itself by that single number, with nobody arranging it. Five levels, and at each one the single thing to do.
If you are holding something right now that looks safe because it is out of the money, this is the issue to read.
(If you read these Sunday reviews regularly, feel free to skip ahead.)
A lot of you joined this week, so let me tell you what you’ve walked into and why it matters.
In The Multiplier, we use options as a retirement income tool.
That means we sell options.We don’t buy them. We use cash-secured puts and covered calls only. No leverage. No speculation.
This sits inside a broader income portfolio alongside dividends and T-Bills, with one goal: reliable cash flow without selling shares or draining principal.
Why the skill of selling options matters for your retirement
Most retirees have one plan: save enough, then sell shares slowly to live on. That plan worked when bonds paid 5% and lifespans were shorter. It does not work as well now.
Selling options gives you a second income stream from the same portfolio. You keep the shares. You keep the dividends. And you get paid premium on top.
If you’re new to this approach, I explain the reasoning in detail here:
Every Sunday, I publish the same type of review.
What we closed and how much income was actually locked in. What we rolled, and whether it was done for credit or debit, and why. What we held, and what we’re watching going into the next week.
Because if you strip it down, selling options comes down to three decisions you repeat over and over: hold, close, or roll.
Learning when to do each using rules is skill we learn here.
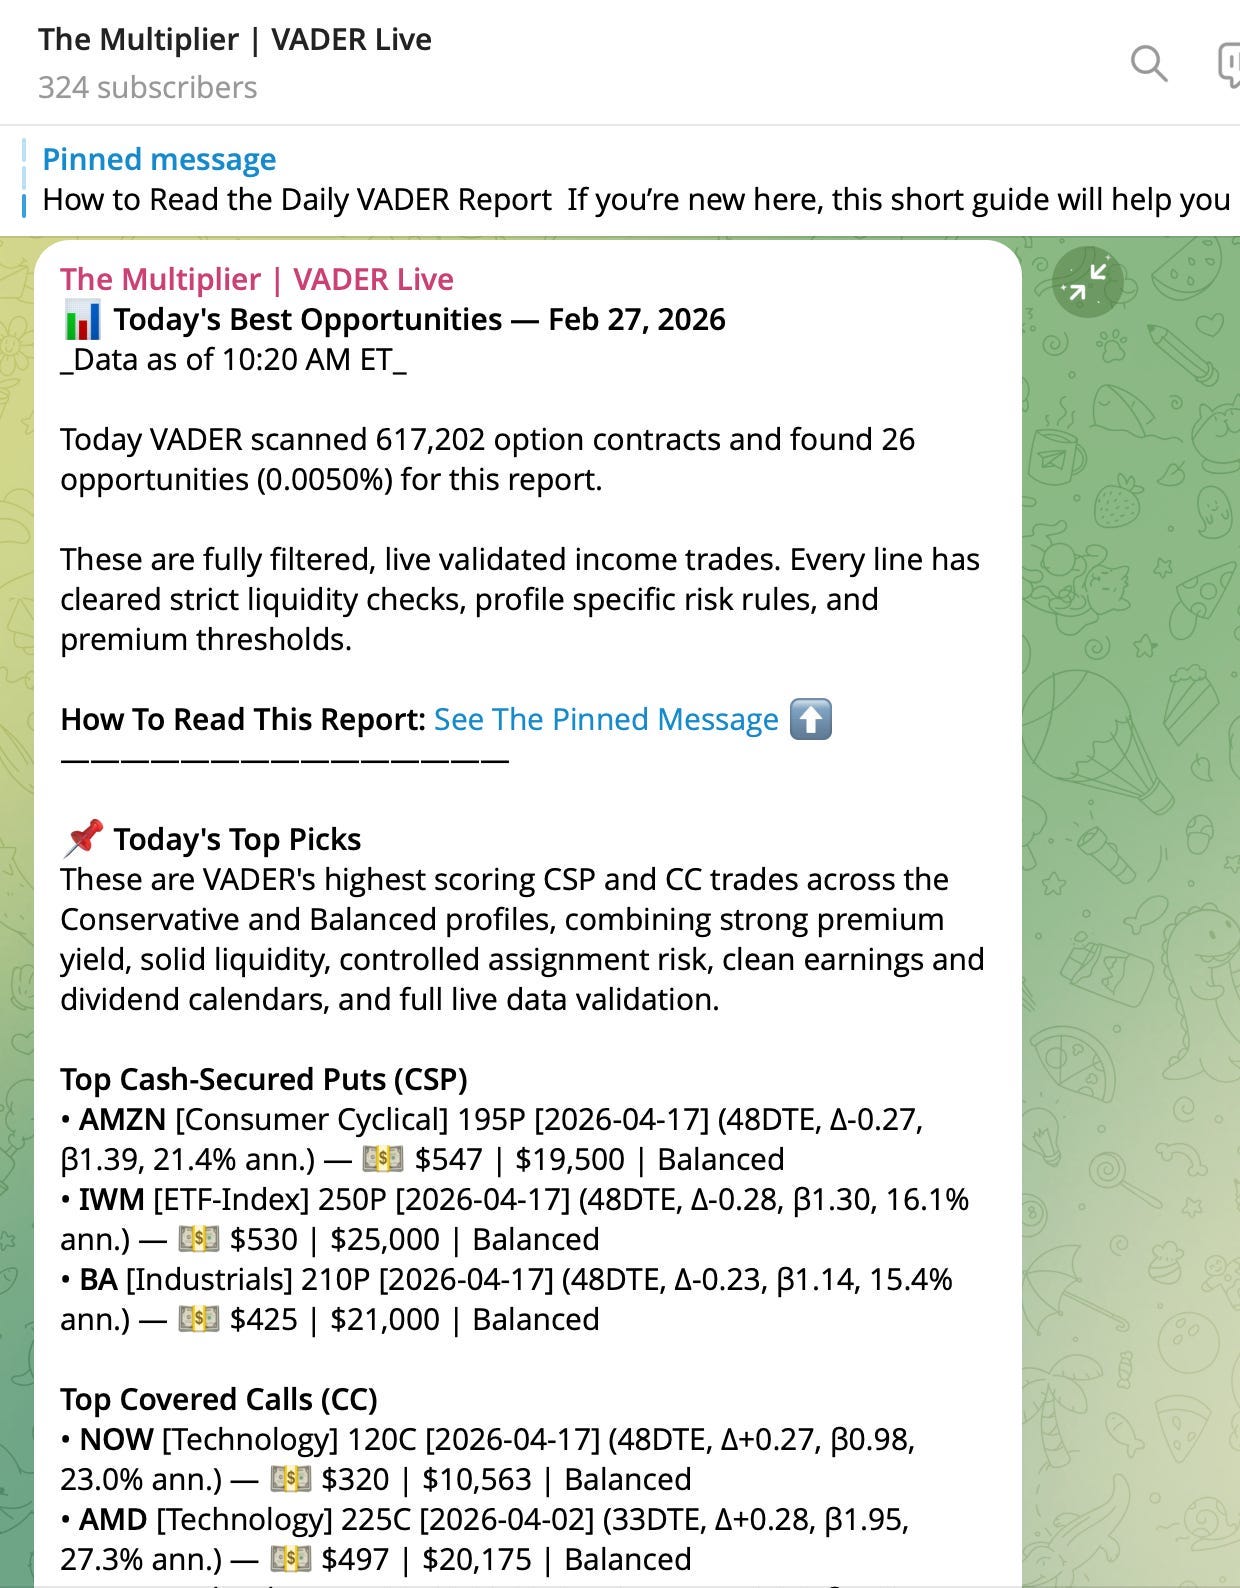
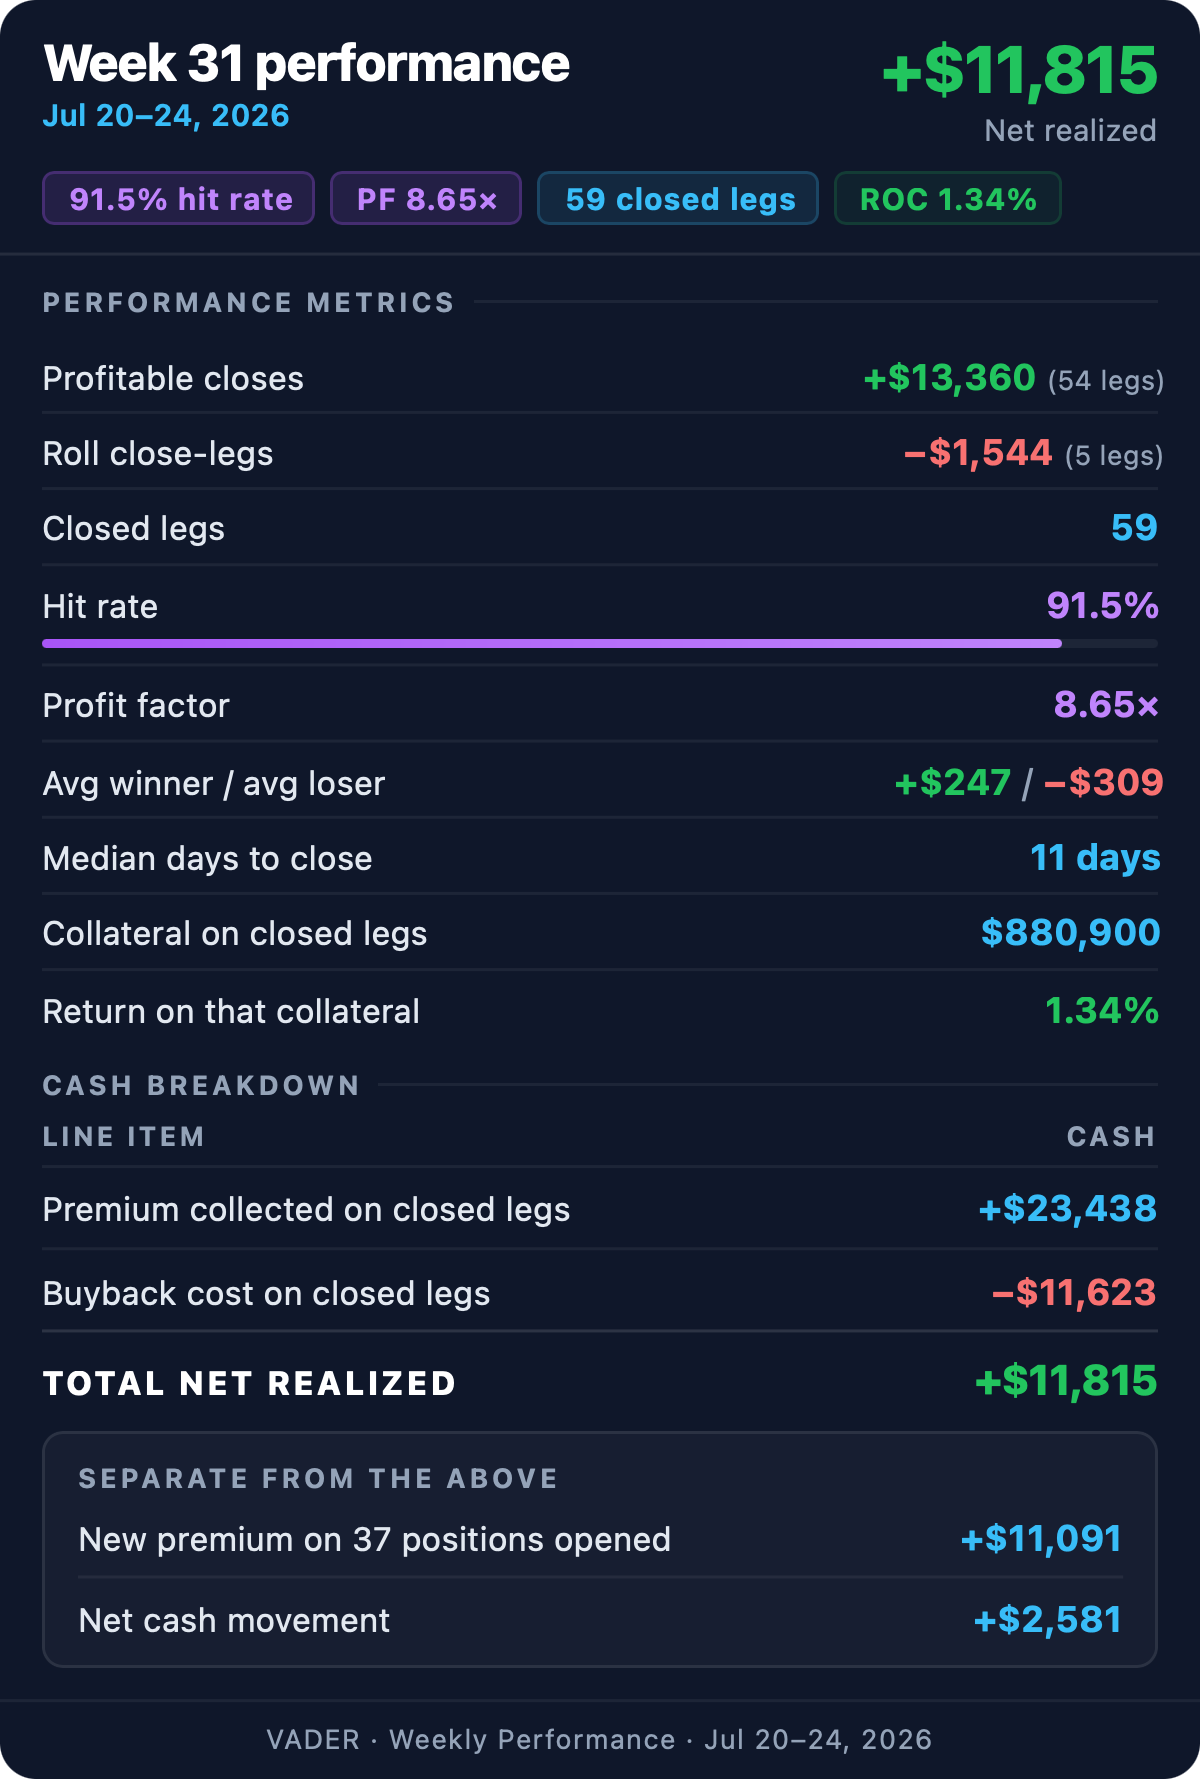
This week, the system generated $11,815 in realized profit from 59 closed positions - all picked by VADER, my proprietary algorithm that scans 500,000+ option contracts daily and surfaces only the top 0.005% of income setups.
Premium members receive those setups in real time, Monday through Friday, in the private Telegram channel.
This is what it looks like:
And then on Sunday, we review the results of VADER trades, explain the decisions, and map out what to do next with open positions.
There is no risk in giving it a try. Join today and use the full system for 60 days.
You can cancel the subscription anytime.
If at any point during those 60 days you decide it’s not right for you, email ‘refund’ to mike@themultiplier.co. I’ll process it within 24 hours, no questions asked. You keep everything you’ve learned.
The Multiplier is a Substack Bestseller. 410+ people have already upgraded, and you can read their feedback below.
How to tell whether a position you already own is still safe. One number on your broker screen, five levels, and the single thing to do at each. This is the whole issue.
Why “out of the money” does not mean safe. A covered call sitting below its strike that the market still prices as a coin flip.
What actually happens when a put goes badly wrong. ORCL fell to $115 against a $170 strike. Where the shares land, what they really cost you, and the one call you must never write afterwards.
When it is worth paying money to fix a trade. A roll that cost $55, the three questions it had to pass first, and an honest admission that it may not have been needed at all.
This week, my VADER setups produced $11,815 in realized profit across 59 closed legs.
Nine out of ten closed legs made money, and the median came off in eleven days. Collateral that comes back sooner goes to work again sooner.
The headline is net, and the two halves are worth seeing apart. Profitable closes brought in $21,984 against $8,625 to buy them back, so +$13,360. The five roll close-legs cost −$1,544.
New to this? Delta is the number your broker shows next to each option (between 0 and 1). Treat it as the market’s own estimate of the odds that the option finishes in the money, so 0.20 is roughly a one-in-five chance and 0.90 is nearly settled. It moves as the stock moves, which makes it a live reading rather than a fixed property of the trade.
Your positions will not be in my tables. Here is how to place any of them in the same three zones I use.
Is the stock above or below your strike?
How many days until expiry?
What is the delta now?
Green means profitable and low delta. Yellow means roughly flat, or the delta has started climbing. Red means the stock has crossed your strike, or the delta is high enough that crossing is more likely than not.
Then the third question does the real work.
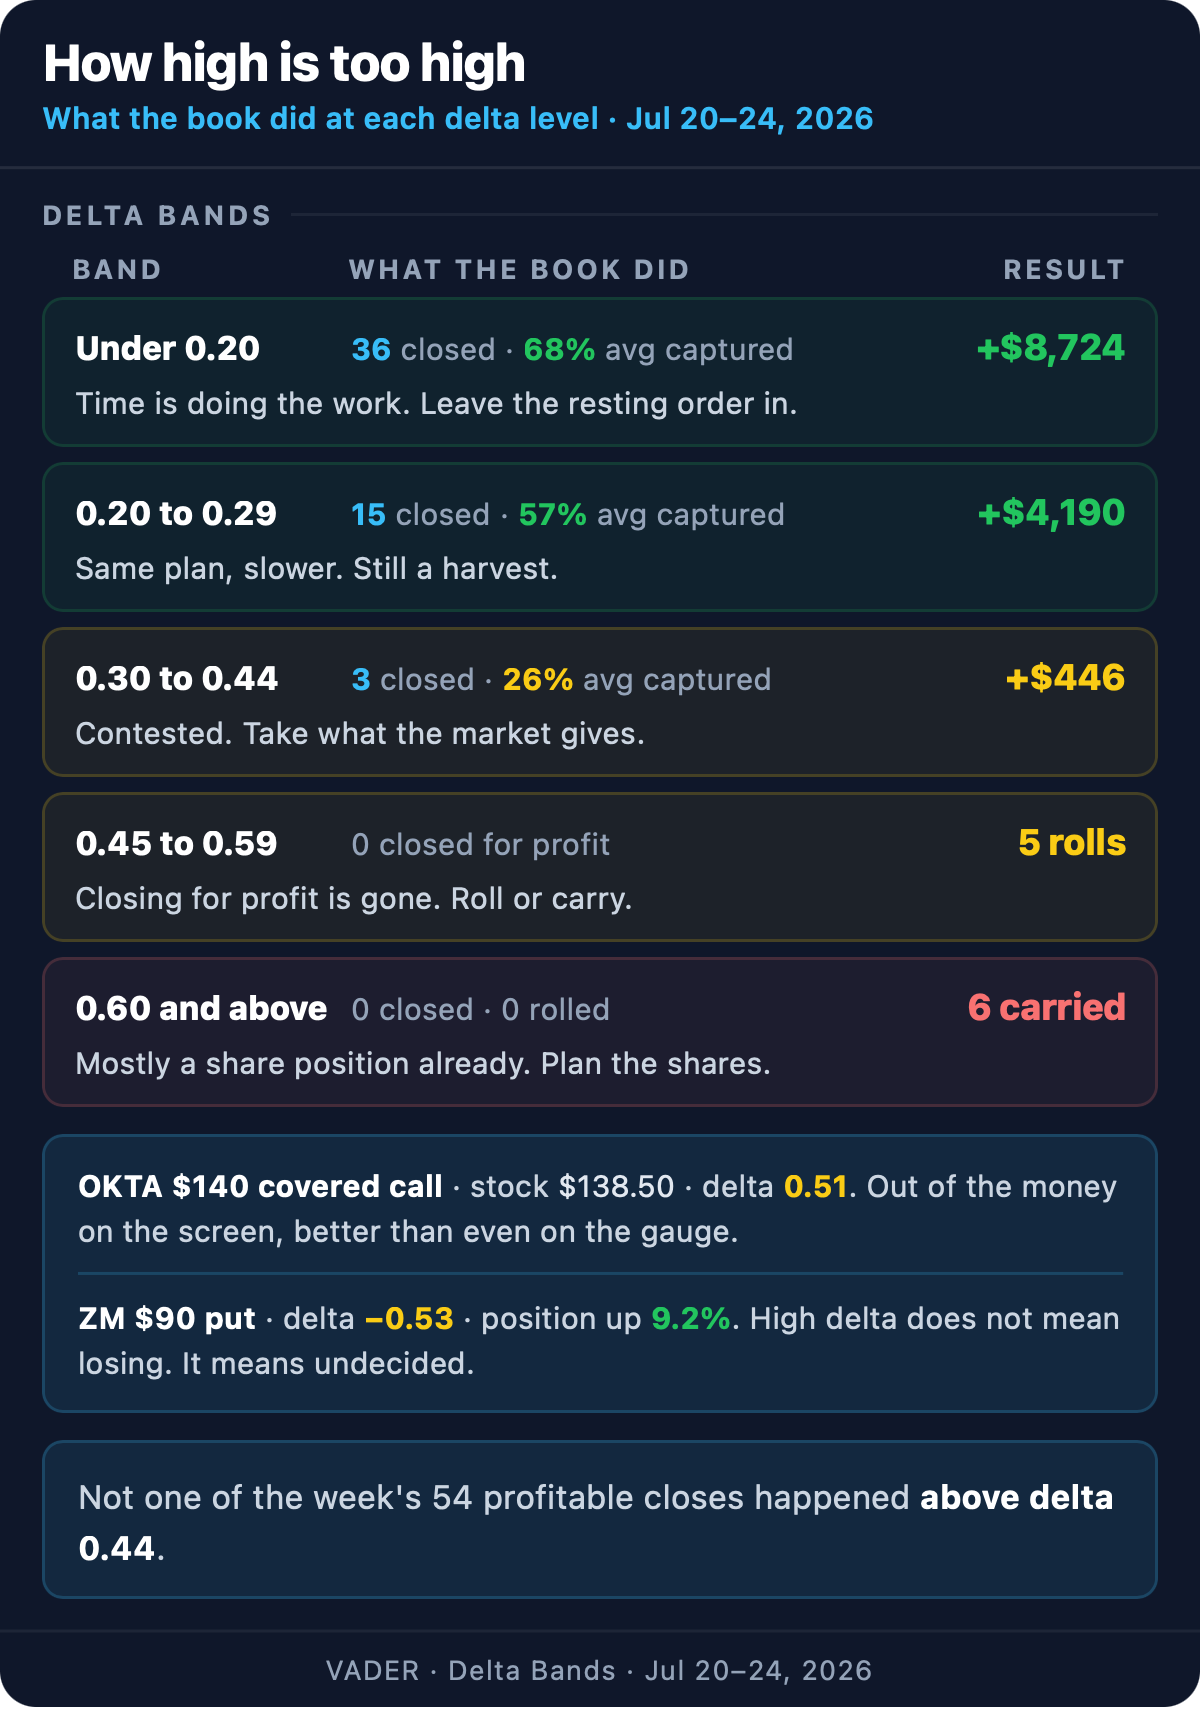
Not one of the 54 profitable closes happened above a delta of 0.44. The highest was a NEM $95 put at −0.44, and even that gave up only 29.7% of its premium. Delta worked as a one-way gate all week.
So the question has a numeric answer. Around 0.45, closing for a profit stops being one of your options. Above that, whatever you do next costs something. Delta is not distance from the strike, it is the odds of getting there.
One thing breaks the obvious reading. A ZM $90 put on this book sits at delta −0.53 and the position is up 9.2%. High delta does not mean losing. It means undecided.
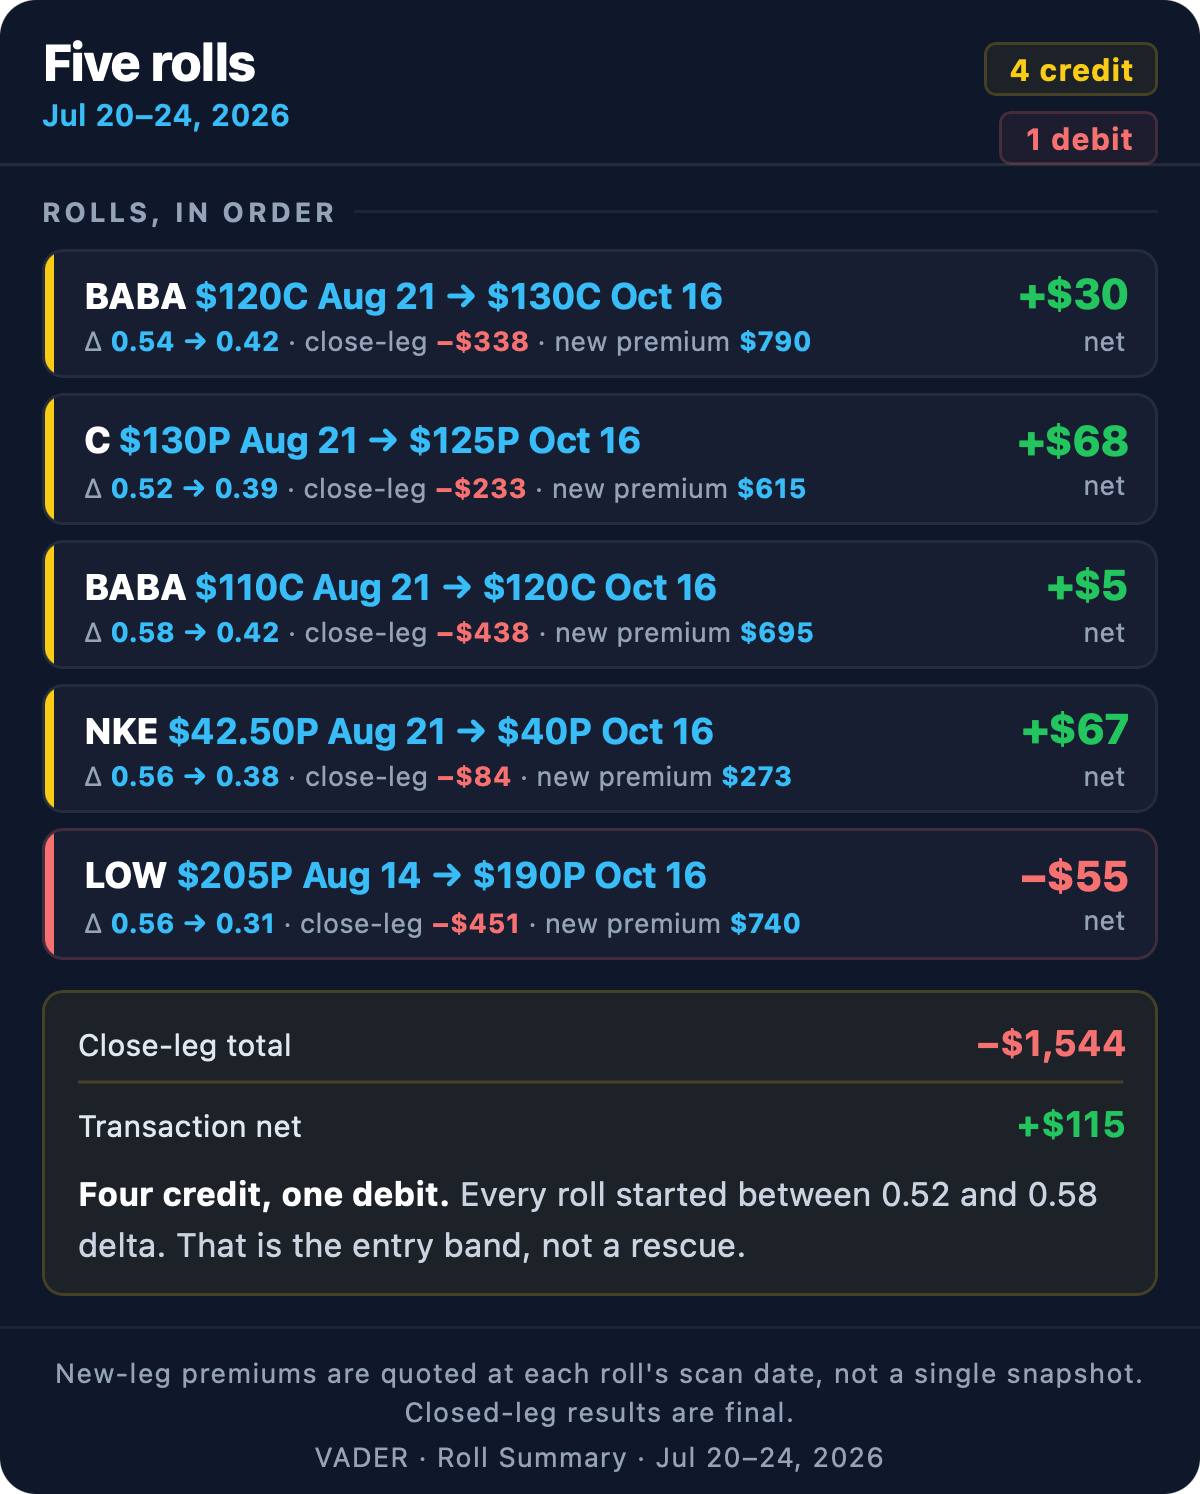
Five positions were rolled. Four brought in a credit and one cost money.
Look at the left column: every roll started between 0.52 and 0.58 and finished between 0.31 and 0.42.
That band is where a roll is still worth doing because the option has enough value left that someone will pay you to take a further-out strike.
And there is a cost curve inside it... The roll that reached furthest was the only one that had to be paid for.
The one that cost money.
How this roll is scored
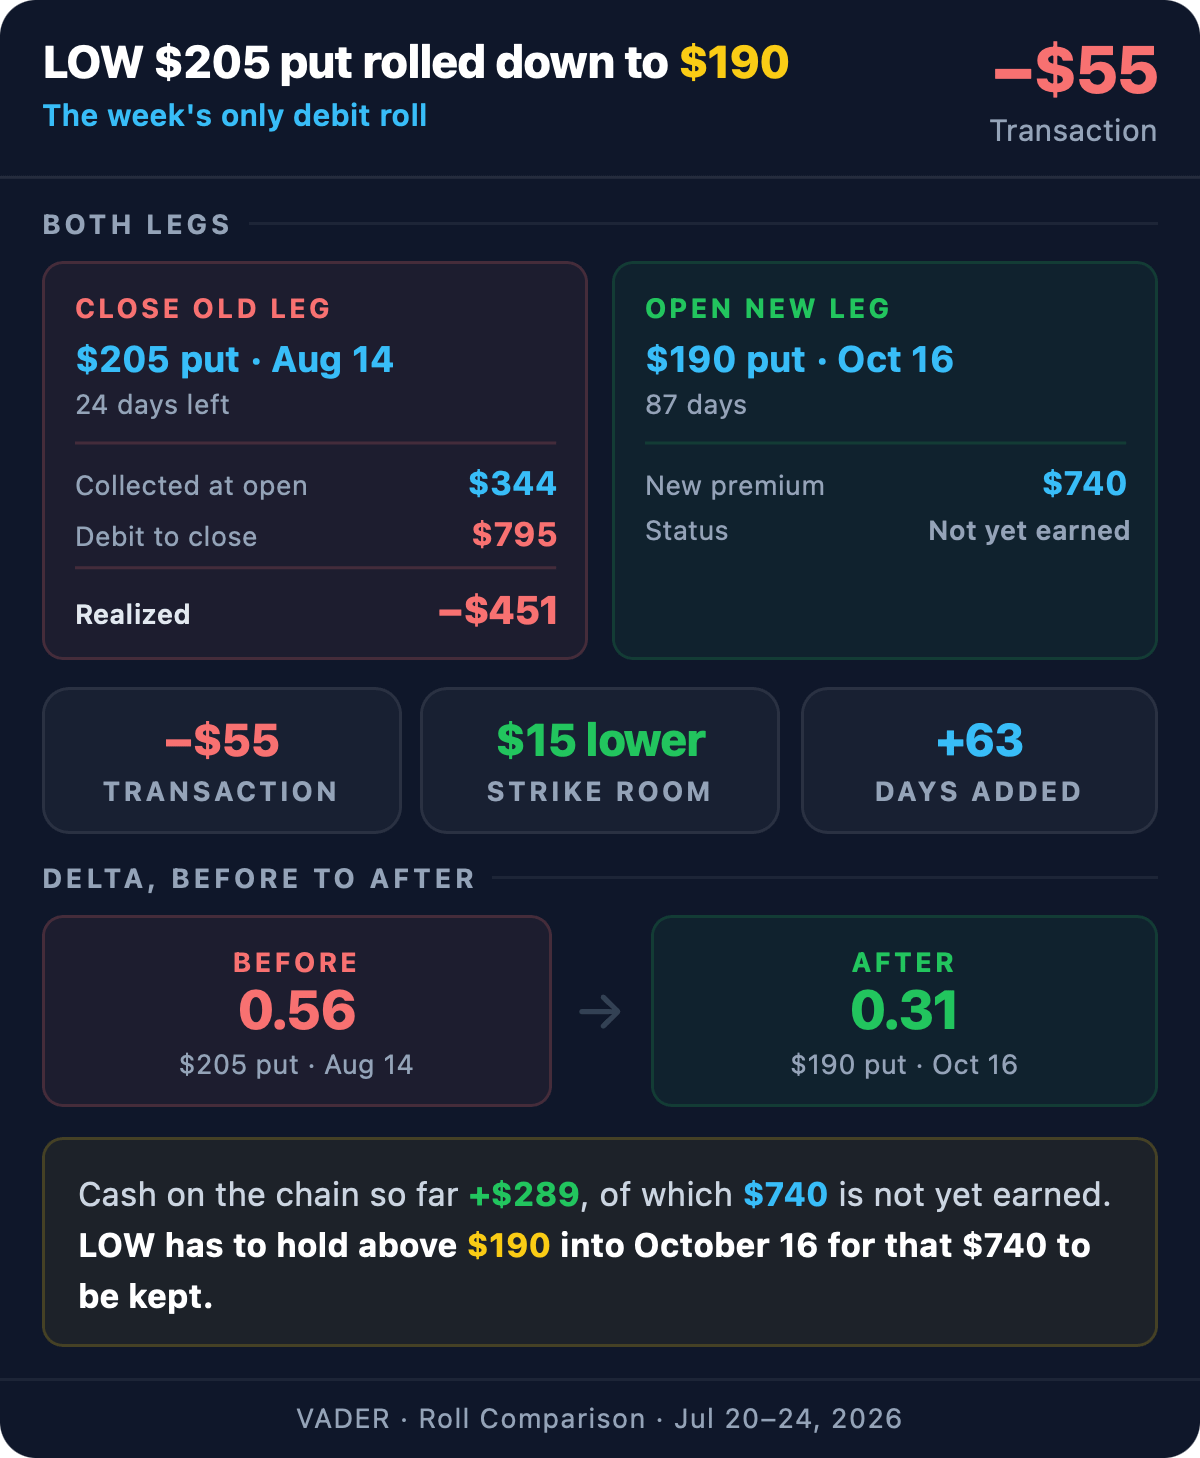
Premium collected when the position opened: $344
Debit paid to close that leg: $795
Realized on the closed leg: −$451. That is a loss, and it counts as one.
New premium collected on the replacement leg: $740, not yet earned. It has to decay before it becomes profit.
Cash on the chain so far: +$289, of which $740 is not yet earned. LOW has to hold above $190 into October 16 for that $740 to be kept.
The $205 put was sold the Friday before, with LOW just above $208 after a sharp drop that morning. Within two sessions the stock was under the strike. By midweek it traded below $200, delta reached 0.56, and 24 days were left.
Why would you pay instead of taking the loss? The same test applies to every roll and it has three parts. A roll has to improve at least two of them:
Does it reduce risk?
Does it buy time?
Does it collect a credit?
This one reduced risk: the strike came down 15 dollars and delta from 0.56 to 0.31. It bought time, 63 days of it. It failed the credit test, and $55 was the price of the other two.
LOW recovered to about $208 by Friday, back above the strike the position had just been rolled away from. Left alone it would probably have been fine. Nobody knew that on Wednesday, and nobody knows where LOW goes from here either. A roll means paying a small known amount to make a large unknown outcome smaller.
The three-part test is what stops rolling from becoming a habit. A roll that only buys time is a way of not deciding, and not deciding compounds every cycle. Two out of three, or take the loss and free the collateral.
Turn Your Retirement Accounts Into a Real Income Plan
Consider becoming a premium member for $299/year or $49/month.
Every morning, VADER (a proprietary, multi-step screening system) scans ~500,000 option contracts and filters down to the top 0.005%.
You get the best covered call and cash-secured put setups daily (Mon–Fri).
Read more here:
What “out of the money” actually buys you.
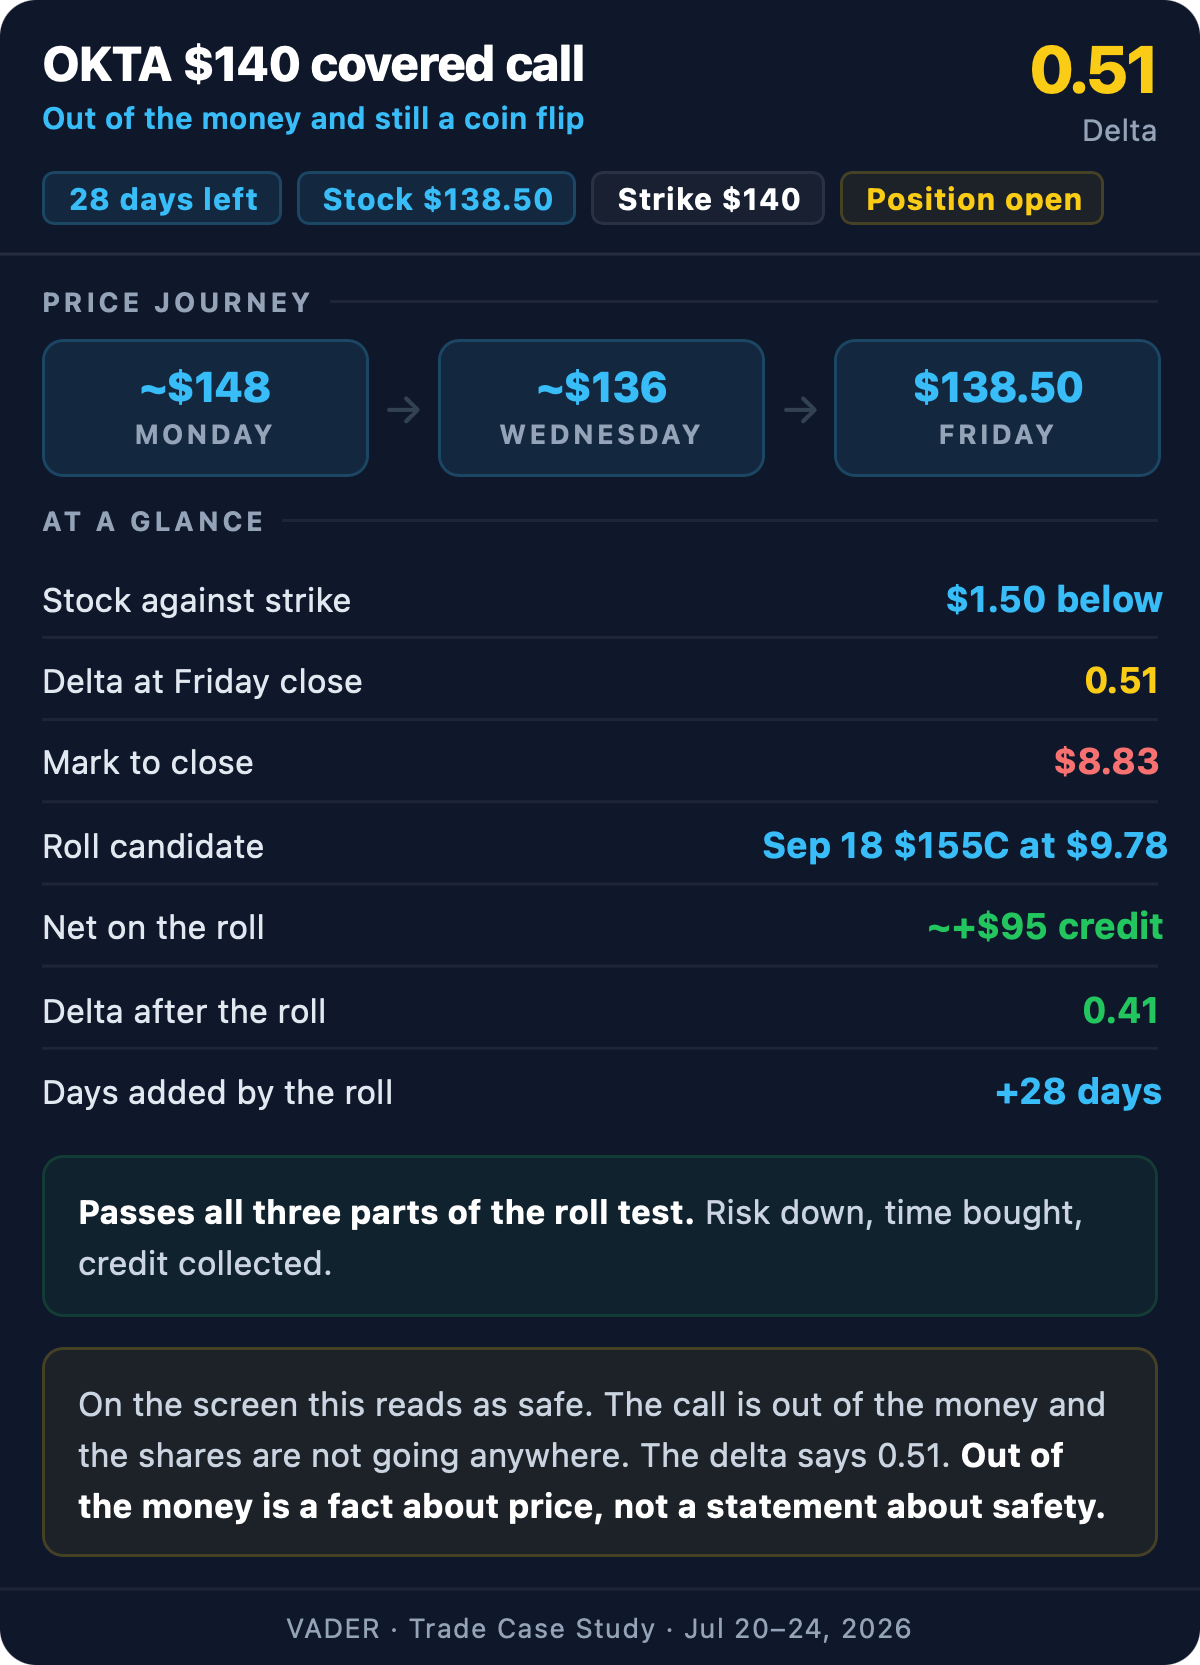
OKTA moved about ten dollars in four sessions, from $148 down to $138.50.
Against a stock doing that, a dollar and a half below your strike is not room, and the market prices the odds of finishing above $140 at better than even.
Price tells you where the stock is. Delta tells you what the position has become.
At 0.51 the table says roll territory. Closing the August $140 call costs about $8.83 a share, and selling a September $155 call brings in about $9.78.
Roughly a $95 credit, fifteen dollars of strike, 28 more days, delta down to about 0.41. Run the three-part test and it passes all three, which is rare.
The argument against is the one nobody makes out loud. Letting the shares go at $140 is a clean finish. Rolling up keeps alive a position that has already done its job, and every roll after starts from a worse place if OKTA keeps climbing.
The trigger written here is OKTA above $140 into the August expiry, at which point the shares are allowed to go.
That is a judgment call and it isn’t going to be dressed up as a rule.
Out of the money is a fact about price, not a statement about safety. A call a dollar below your strike on a fast-moving stock is closer to a coin flip than one ten dollars below on a slow stock. The gap tells you almost nothing on its own, which is why the gauge is the thing to read.
One position resolved into shares this week.
What the wheel actually costs when you are wrong.
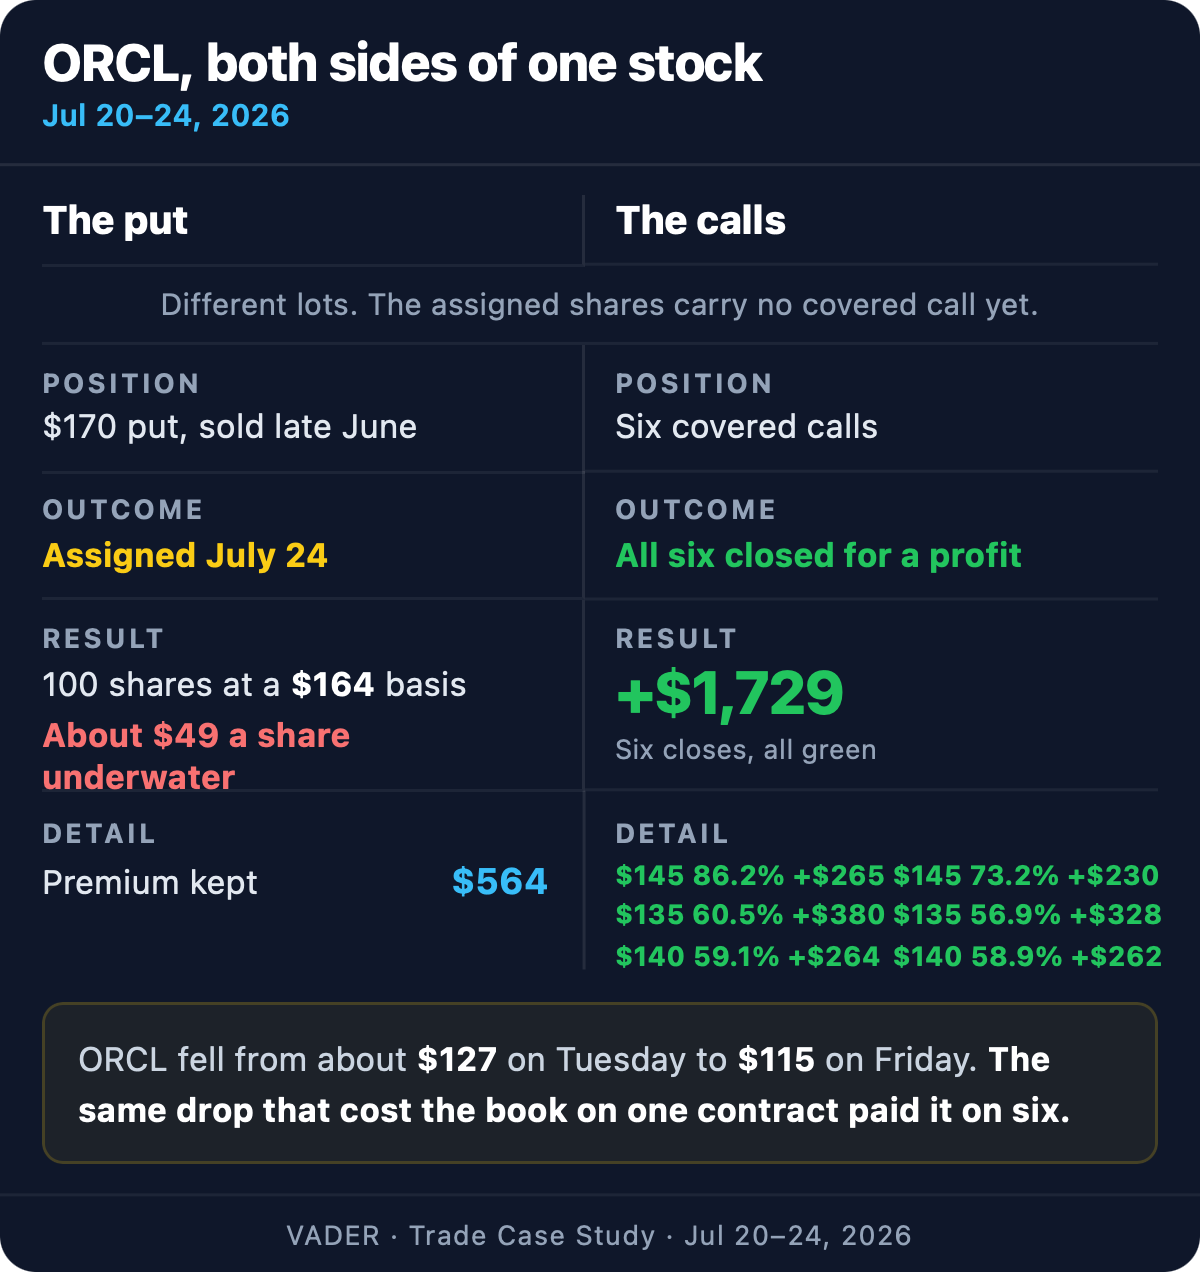
ORCL fell from about $127 on Tuesday to $115 by Friday’s close, six percent of it in Friday’s session alone.
The put. A $170 put sold in late June expired Friday with ORCL near $115. No version of that ends with the option walking away clean. Buy it back for a large cash loss and hold nothing, or take delivery. The reference portfolio took the shares.
The calls. Six covered calls on ORCL closed for a profit in the same five days, together worth +$1,729. Every one got cheaper for exactly the reason the put got expensive. A highlight reel shows you one of those and not the other. The same drop that cost the book on one contract paid it on six.
Now where those shares stand.
The shares arrive. One hundred shares per contract at the $170 strike. Cash left the account and a stock position replaced it.
The basis after premium. Cost basis is the strike minus every dollar of premium collected on the chain. Here that is $170 less a bit over $5.60 a share, so roughly $164. Against a stock near $115, about $49 a share of paper loss. No covered call closes a gap that size this month or next, and anyone telling you the wheel does is running arithmetic I have never seen work.
The first call. There isn’t one yet. With ORCL near $115, the calls paying real premium are the near-the-money ones. A $120 call might bring in a couple of dollars and it would feel like the wheel doing its job.
But if ORCL recovers to $130 those shares leave at $120, and you collected $2 to lock in a $44 loss per share... never write a covered call at a strike below your cost basis unless you have already decided you are willing to sell there. So the shares sit uncalled until the stock climbs far enough that a strike above $164 pays something worth having.
And if it never recovers? Then this is a long hold that pays nothing or pays thinly, and the honest accounting is that the capital is stuck. The wheel does not rescue a 30% gap. It stops the gap widening through bad decisions.
And there is a cost most people miss: that collateral was cash, and cash backs whatever comes along next week. It is now a specific stock position.
Assignment is a conversion, it’s not a penalty. Cash collateral becomes a share position at a known basis, and your job changes from managing an option to managing a holding. Which is why the first call you write after an assignment matters more than the last twelve you wrote before it.

Comments
Nothing yet. Say the first thing.
Sign in to join the conversation.