
Investing with AI is our ongoing series dedicated to modernizing financial research. We cover the latest tools, analytical frameworks, and AI-driven workflows designed to help you streamline your investment process.
Every time a highly anticipated IPO drops, a familiar pattern plays out among retail investors. They track the Grey Market Premium (GMP), wait for a two-page summary from a brokerage house, and effectively outsource their investment conviction.
The reality of IPO analysis is hidden inside the Draft Red Herring Prospectus (DRHP) a massive document that typically spans 400 to 600 pages. Most market participants assume reading it front-to-back is the only path to deep due diligence. It isn’t. Roughly 80% of any DRHP consists of legally mandated jargons designed to protect underwriters. The actual investment alpha is buried within the remaining 20%.
Reading a DRHP line-by-line is an inefficient use of time, but skipping it entirely means investing completely blind.
When investors attempt to leverage Artificial Intelligence to solve this problem, they often fall into a common trap. They upload the massive PDF into Large Language Models (LLMs) like Claude or ChatGPT and issue a vague command: “Summarize this DRHP and tell me if I should invest.”
Generic prompts guarantee generic, superficial research. An AI model will not automatically identify whether promoters are using an IPO as an exit liquidity event unless it is explicitly directed to interrogate specific, hard financial metrics.
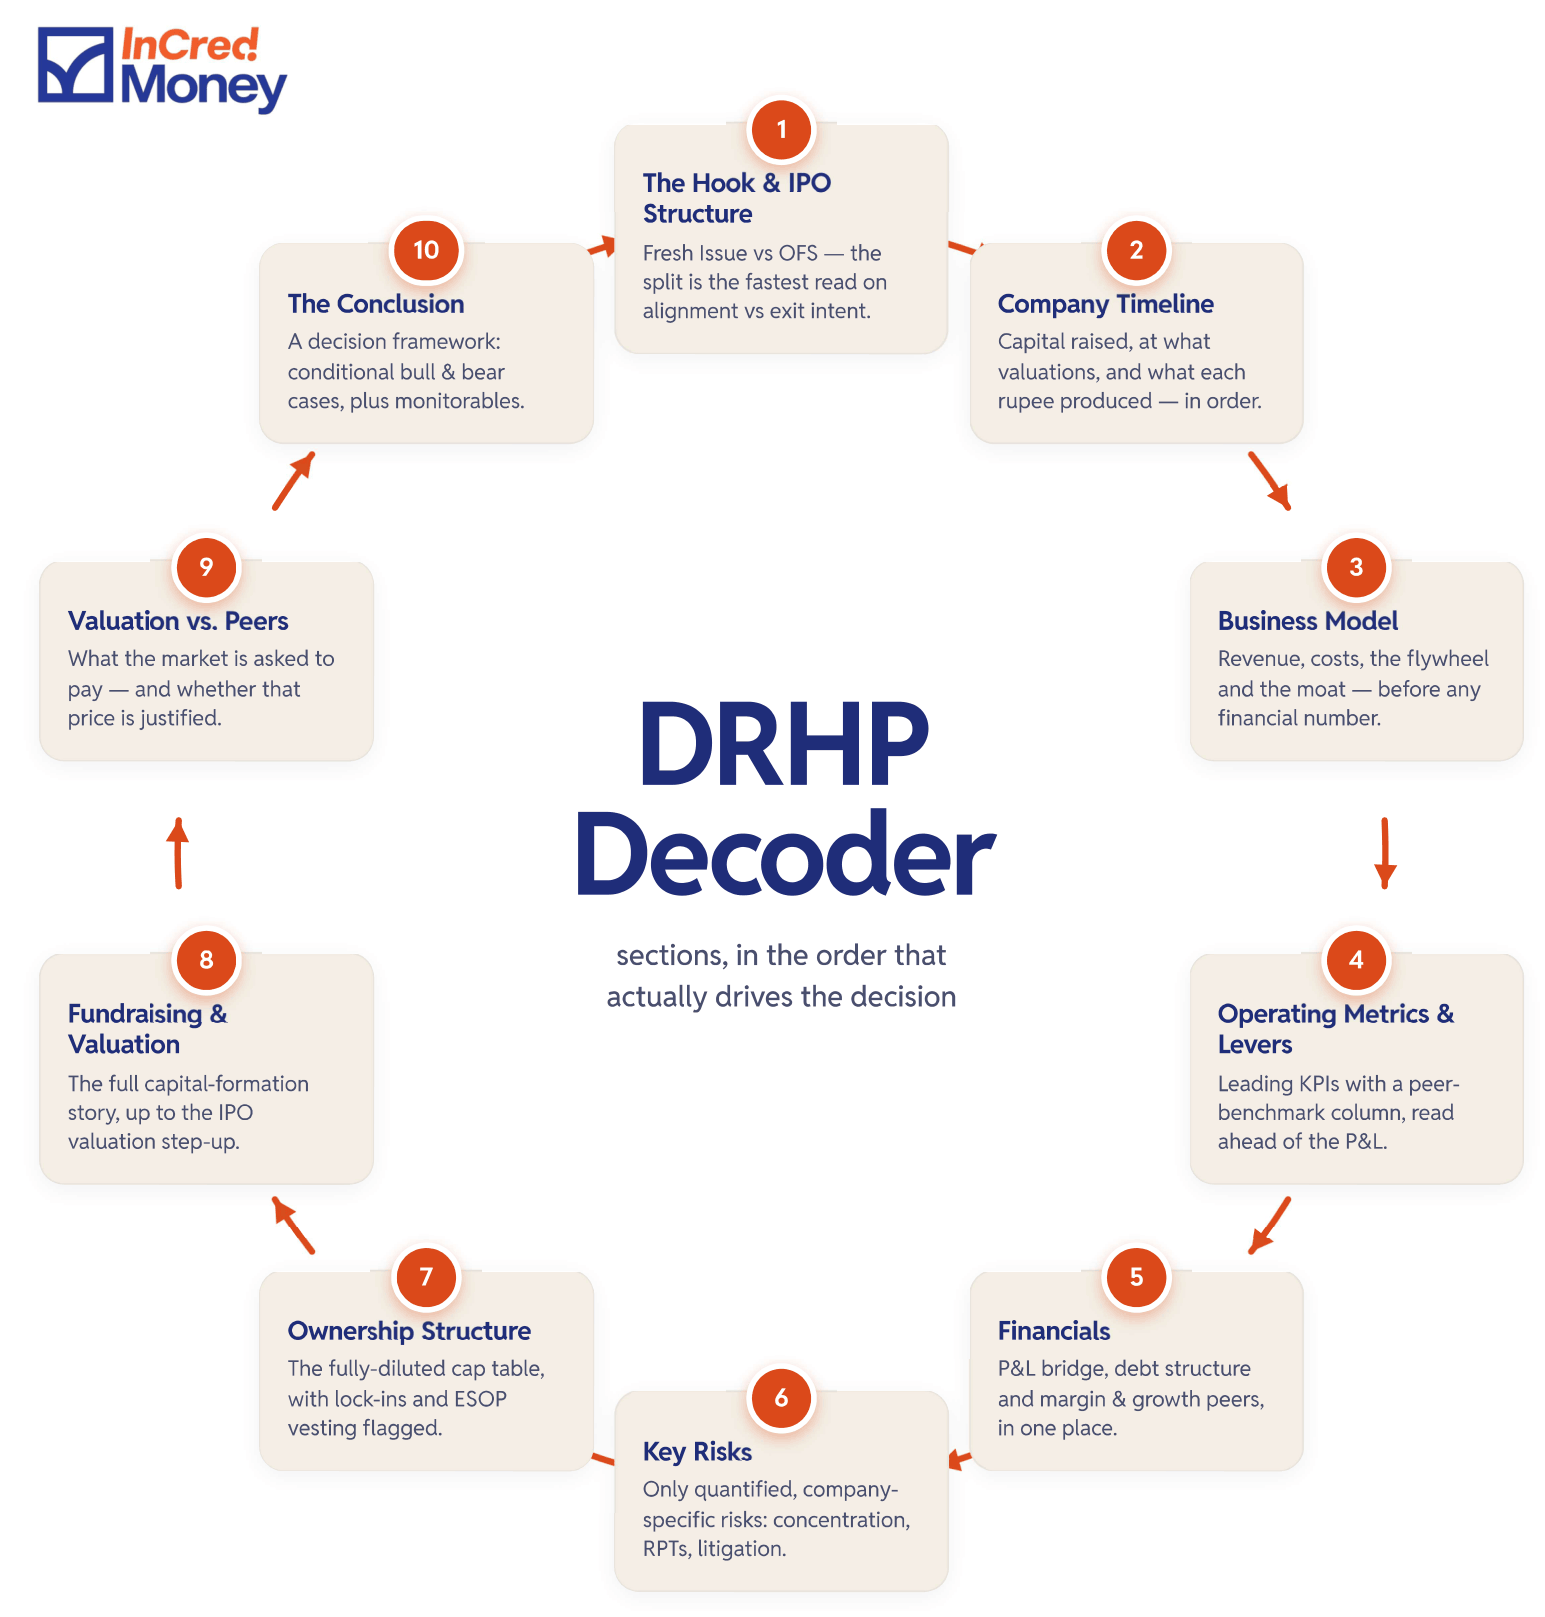
Using AI for financial research requires shifting from basic summarization to rigorous interrogation. Here is an objective, structured framework to strip away marketing fluff and extract critical risk factors before an IPO opens for subscription.
To use this framework effectively, download the official DRHP directly from the regulator’s website (such as SEBI) or the stock exchanges to ensure data integrity. Avoid using third-party summaries.
Input the raw prospectus into an advanced LLM capable of handling large document contexts, and execute the following master prompt:
“Note: Triple-click anywhere inside the grey box below to instantly highlight the entire prompt for easy copying.”
You are a senior equity research analyst at an institutional fund. You have been
handed the Draft Red Herring Prospectus (DRHP) of a company preparing for an IPO.
Your task is to produce a structured, data-driven IPO analysis note for an informed
but non-institutional reader.
GROUND RULES — read these before producing any output:
- Work strictly from the DRHP text. Do not infer, assume, or supplement with
  external information under any circumstances.
- If a specific data point is not disclosed in the filing, write exactly:
  "Not disclosed in the DRHP."
- Do not reproduce generic boilerplate (macroeconomic risks, force majeure,
  regulatory caveats) unless they carry a material, company-specific dimension
  that is quantified in the filing.
- Every table must be populated with actual numbers from the document.
  Do not use placeholders.
- Write each section in clean, direct prose. Strip all marketing language
  lifted from the filing.
---
SECTION 1: THE HOOK AND IPO STRUCTURE
Open with a single, sharp paragraph stating: what this company does, why this
IPO is significant at this specific point in time, and what the central
analytical question is that the rest of this note will attempt to answer.
Then produce the following:
IPO Structure Table:
- Total issue size (₹ crore)
- Fresh Issue component (₹ crore and % of total)
- Offer for Sale (OFS) component (₹ crore and % of total)
- Names of all OFS selling shareholders with their individual sale size
  and pre/post-IPO ownership %
- Stated "Objects of the Issue" for fresh capital with exact amounts
  allocated to each head
- Flag any allocation to "General Corporate Purposes" — note if it exceeds
  15% of the Fresh Issue size, which is the SEBI threshold
---
SECTION 2: COMPANY TIMELINE
Present a crisp, chronological timeline covering:
- Founding date, original product idea, and founding team background
- Each major product launch, service expansion, or geographic entry
- Every disclosed funding round (round name, year, amount raised, lead
  investor, implied valuation if disclosed)
- Any pivots, acquisitions, regulatory events, or leadership changes
  that materially altered the business
- DRHP filing date and stated IPO timeline
Format as a clean table:
| Year | Event | Significance |
---
SECTION 3: THE BUSINESS MODEL
Part A: How It Works
Present the business model in a structured table format covering the
major revenue and expense levers of the company. Do not write prose here.
Organize the table as follows:
| Dimension | Detail |
|---|---|
| Primary Revenue Streams | [List each stream and its % contribution to total revenue] |
| Secondary / Ancillary Revenue | [Any disclosed additional revenue lines] |
| Key Revenue Driver | [The single metric that most directly drives top-line growth] |
| Primary Cost of Revenue | [Main direct cost and its % of revenue] |
| Primary Operating Expense | [Largest operating cost and its % of revenue] |
| Other Major Expense Levers | [Any other disclosed cost lines above 5% of revenue] |
| Unit Economics (if disclosed) | [Contribution margin per order / per loan / per customer / ARPOB — whichever is applicable. If not disclosed at a per-unit level, write "Not disclosed in the DRHP."] |
Part B: The Flywheel
Identify and explain the core self-reinforcing loop in this business model.
Which inputs improve which outputs, and how does scale make the model
stronger or more defensible over time? If the DRHP does not explicitly
describe a flywheel, construct it logically from the disclosed operating
model and label it as your own construction.
Part C: Stated USPs
List the company's stated competitive advantages from the filing. For each,
note whether it is:
(a) Verifiable from disclosed data — cite the specific metric
(b) A claim without supporting metrics in the filing
(c) A claim that appears inconsistent with the disclosed data — explain why
---
SECTION 4: OPERATING METRICS AND PROFITABILITY LEVERS
Part A: Key Operating KPI Trend
Extract every disclosed operating metric for the company and present the
full available time series. Where the DRHP also discloses the same KPI
for listed peers, include a peer comparison column. Do not limit yourself
to the examples below — extract every KPI the company itself tracks and
discloses, including any per-unit metrics such as contribution margin per
order, NIM per loan, or ARPOB where available.
Examples by business type (not exhaustive):
- Marketplace / Quick Commerce: transacting users, order volumes, average
  order value, take rate, GOV, contribution margin per order, retention
- SaaS / B2B: ARR, customer count by tier, NRR, churn rate, CAC, LTV
- NBFC / Lending: AUM, disbursements, active borrowers, NPA trends,
  CRAR, NIM, cost of funds
- Healthcare: bed count, occupancy rate, ARPOB, payor mix
- Manufacturing: installed capacity, utilization %, order book,
  realization per unit
- Retail: store count, same-store sales growth, revenue per sq ft,
  average ticket size
| KPI | FY[X-2] | FY[X-1] | FY[X] | Recent Period | Direction | Peer Benchmark (if disclosed) |
|---|---|---|---|---|---|---|
| [Metric 1] | | | | | ↑ / ↓ / → | [Peer name: value] |
| [Metric 2] | | | | | ↑ / ↓ / → | [Peer name: value] |
For the peer benchmark column: populate only where the DRHP explicitly
discloses peer KPIs for comparison. If no peer KPI data is provided in
the filing for a given metric, write "Not disclosed in the DRHP."
Part B: Profitability Improvement Initiatives
Identify the specific operational changes the company is making or plans
to make to improve unit economics. For each initiative:
- Name the lever precisely
- State whether there is disclosed data showing measurable progress
  on this lever, and what the data shows
- State the expected financial impact as described by management in
  the filing
Exclude any initiative described only in general terms without supporting
data or a named action plan in the filing.
---
SECTION 5: FINANCIALS
Part A: P&L Bridge
Populate the full P&L bridge using actual figures from the DRHP. Do not
leave any row blank without explaining why it is not disclosed.
| Line Item | FY[X-2] | FY[X-1] | FY[X] | YoY Growth |
|---|---|---|---|---|
| Total gross billings / GMV / TPV / AUM (as applicable) | | | | |
| Net Revenue | | | | |
| Gross Profit | | | | |
| Contribution / Operating Income (post-variable costs) | | | | |
| Adjusted EBITDA | | | | |
| Reported EBITDA | | | | |
| EBIT | | | | |
| PBT | | | | |
| PAT (Net Profit / Loss) | | | | |
Include the following margin rows for each year:
- Adjusted EBITDA margin %
- EBITDA margin %
- PAT margin %
Note: "Adjusted EBITDA" refers to the company's own defined metric as
disclosed in the filing. State the exact adjustments made and whether
ESOP charges, forex, or one-time items have been excluded.
Part B: Debt and Capital Structure
Extract the complete debt structure as of the most recent disclosed period:
| Instrument | Lender / Type | Amount (₹ crore) | Tenor | Rate (if disclosed) | Secured / Unsecured |
|---|---|---|---|---|---|
| Term Loans | | | | | |
| Working Capital Facilities | | | | | |
| NCDs / Bonds | | | | | |
| Convertible Instruments | | | | | |
| Other | | | | | |
| Total Debt | | | | | |
Identify the exact amount from the Fresh Issue earmarked for debt repayment
or prepayment. Name the specific instruments being repaid. Calculate:
- Pre-IPO Debt-to-Equity ratio
- Pro-forma post-IPO Debt-to-Equity ratio (assuming full deployment of
  proceeds as stated)
List all disclosed contingent liabilities with their quantum. Flag any
that exceed 5% of net worth or annual revenue as of the latest period.
Part C: Financial Peer Comparison
Using the peer group named by the company in the DRHP, build a financial
benchmarking table. Use only the metrics the company itself discloses for
this comparison. Where a metric is listed for peers but not for the IPO
company, flag it explicitly.
| Company | Revenue (LTM) | Revenue Growth YoY | Gross Margin % | EBITDA Margin % | PAT Margin % |
|---|---|---|---|---|---|
| [IPO Company] | | | | | |
| [Peer 1] | | | | | |
| [Peer 2] | | | | | |
| [Peer 3] | | | | | |
| Peer Median | | | | | |
---
SECTION 6: KEY RISKS (SPECIFIC AND QUANTIFIED)
Ignore all generic legal boilerplate. Identify the five most material,
company-specific risks. For each:
- Name it precisely
- Quantify it using data from the DRHP
- Explain the mechanism by which it would damage the business model
- Note any mitigation disclosed by management
Categories to search specifically:
1. Revenue or customer concentration — name the top customers and
   their % of revenue
2. Supplier, partner, or platform dependency — name the dependency
   and the disclosed switching cost or lock-in
3. Outstanding or threatened litigation — list by party, quantum of
   claim, and current status
4. Regulatory exposure specific to this company's product, license,
   or geography — not generic sector risk
5. Related party transactions — list all material RPTs, the
   counterparty, the value, and whether they are certified as
   arm's-length in the filing
For companies that are not yet profitable, add a sixth risk:
6. Path-to-profitability execution risk — at what scale does the
   unit economics model break even, what assumptions does that
   require, and what is the disclosed cash runway if those
   assumptions are not met
---
SECTION 7: OWNERSHIP STRUCTURE (FULLY DILUTED)
Present the ownership table on a fully diluted basis — include ESOPs,
warrants, convertible instruments, and preference shares on an
as-converted basis — both pre-IPO and post-IPO.
| Shareholder / Category | Pre-IPO Shares | Pre-IPO % | Post-IPO Shares | Post-IPO % |
|---|---|---|---|---|
| Founder(s) | | | | |
| Co-founders / Key Management | | | | |
| [VC / PE Investor 1] | | | | |
| [VC / PE Investor 2] | | | | |
| [Strategic / Corporate Investor] | | | | |
| ESOP Pool (granted + ungranted) | | | | |
| Public (post-IPO) | | | | |
| Total | | 100% | | 100% |
Flag:
- Which shareholders are selling in the OFS and what % of their
  pre-IPO stake they are liquidating
- Post-IPO lock-in schedule: who is locked in, for how long, and
  what % of total shares that represents
- Any ESOP tranches vesting within 12 months of listing that would
  create near-term dilution
---
SECTION 8: FUNDRAISING HISTORY AND VALUATION PROGRESSION
Extract every disclosed funding event:
| Round | Date | Amount (₹ cr / USD mn) | Lead Investor(s) | Other Participants | Post-Money Valuation | Step-up from Prior Round |
|---|---|---|---|---|---|---|
| Seed / Angel | | | | | | — |
| Series A | | | | | | |
| Series B | | | | | | |
| [Continue for all rounds] | | | | | | |
| IPO (implied at price band) | | | | | [Price band × FD shares] | |
Also calculate:
- Total primary capital raised to date (fresh capital into company)
- Total secondary volume (existing shareholders who sold in prior rounds)
- Capital efficiency ratio: current revenue run-rate per dollar of
  primary capital raised
Note any rounds that involved significant secondary transactions.
---
SECTION 9: VALUATION VS. PEERS
Step 1: List the peer group exactly as named by the company in the DRHP.
Do not add or remove any peer.
Step 2: Build the valuation comparison table. Use only the metrics the
company itself discloses for this comparison. Where a metric is listed
for peers but not for the IPO company, flag it explicitly.
| Company | P/S | P/E | EV/EBITDA | Sector-Specific Multiple* | Market Cap (₹ crore) |
|---|---|---|---|---|---|
| [IPO Company at price band] | | | | | |
| [Peer 1] | | | | | |
| [Peer 2] | | | | | |
| [Peer 3] | | | | | |
| Peer Median | | | | | |
*Sector-specific multiple: use Market Cap / GMV for marketplaces,
Market Cap / AUM for NBFCs, EV / Bed for hospitals, EV / MW for
energy and manufacturing. Apply whichever is most relevant and
state your choice.
Step 3: Write a three to four sentence valuation verdict. At the price
band, is the company asking for a premium or discount to the peer median?
On which specific metrics is that most pronounced? What financial or
operational outcome would need to materialize within two to three years
to justify the current ask?
---
SECTION 10: CONCLUSION
Part A: The Core Thesis (One Paragraph)
Summarize the investment case in plain language. What has to be true for
this to work out well for a public market investor? What specific belief
is the market being asked to accept at the IPO price?
Part B: Bull vs. Bear Case
| Dimension | Bull Case | Bear Case |
|---|---|---|
| Unit Economics | [What goes right] | [What breaks] |
| Revenue Growth | [What goes right] | [What breaks] |
| Competitive Position | [What goes right] | [What breaks] |
| Profitability Timeline | [What goes right] | [What breaks] |
| Valuation Re-rating | [What goes right] | [What breaks] |
Part C: Key Monitorables Post-Listing
List five specific, trackable metrics that an investor should monitor
in quarterly results to assess whether the IPO thesis is playing out.
These must be metrics the company has disclosed historically in this
DRHP, making them directly comparable in future filings.
For each metric, state:
- The metric name
- Its current value as of the latest disclosed period
- The directional threshold that would signal the thesis is on or
  off track
AI does not replace investment judgment. It eliminates the hours spent finding data so you can spend time on the analysis that actually matters.
Disclaimer
Investments in the securities market are subject to market risks, read all the related documents carefully before investing. Brokerage will not exceed the SEBI prescribed limit. | InCred Money Broking Limited : NSE Member Code 09073, BSE Member Code 6329, MCX Member Code : 55215 , NCDEX Member Code : 1233 NSDL : IN-DP-474-2020 . SEBI Registration No. INZ000164738 | Compliance Officer: NSE,BSE,MCX,NCDEX,NSDL : Mr RK Jain , 011-40409999 brokingsupport@incredmoney.com | Registered Office:- 3rd Floor, Building No.5, Local Shopping Complex, Rishabh Vihar, Near Karkarduma Metro Station. East Delhi – 110092
No posts
Comments
Nothing yet. Say the first thing.
Sign in to join the conversation.