
“Every company has a promoter. Few companies have a promoter story worth studying.”
Styrenix Performance Materials is one such case.
What first drew my attention to the company was not its financials, market position, or growth prospects. It was the unusual journey of its promoter, Mr. Rakesh Agrawal, whose association with the business spans almost five decades.
Most entrepreneurs spend years building a company, eventually exit, and move on to new ventures or retirement. Mr. Agrawal’s story took a very different path. After helping establish India’s first ABS manufacturing business, he watched the company change hands multiple times, passing through the ownership of several multinational corporations over the next two decades. Yet despite these ownership changes, his connection with the business never completely disappeared.
Then, in 2022, something remarkable happened. Through Shiva Performance Materials, Mr. Agrawal reacquired control of the very first company he had helped build —years earlier.
For anyone interested in the full story, I recently wrote a detailed X-Article covering the company’s fifty-year journey and the events that eventually led to this reacquisition. Click the button below to read more…
As an investor, however, I found myself asking a different question.
What did the person who arguably understood this asset better than anyone else see in 2022 that made him want to own it again?
That question became the starting point for my research into Styrenix.
The deeper I went, the more I realised that the investment case extends far beyond an interesting promoter story.
Understanding whether Styrenix can create long-term value for shareholders requires a deeper look at the business itself. How does the company make money? What drives profitability in this industry, and why do revenue and earnings often tell very different stories? Why is ABS considered the crown jewel of the portfolio? How do manufacturing capabilities, backward integration, and R&D contribute to competitive advantage?
These are the questions this first part of the deep dive seeks to answer.
Before discussing growth opportunities, acquisitions, expansion plans, or valuation, it is important to understand the underlying business and industry. Only then can we meaningfully assess the company’s future prospects.
This deep dive will be published in two parts and is co-written with Ameya Deosthali . Many of the frameworks and insights throughout this publication emerged from our discussions around business structure, segment economics, industry dynamics, and first-principles thinking.
Disclaimer : This idea was originally brought to my attention by ValueEquity, who has significantly more experience analysing chemical businesses than I do. I’d like to acknowledge his role in helping me discover and begin exploring the company together. (Do check out his Substack — link below.)
Subscribe to valueequity"s substack
Note : Both of us are invested in the company, which naturally introduces the possibility of bias in how we view the opportunity. As always, treat this report as a starting point for your own research, not a conclusion or recommendation.
So grab a cup of chai, settle in, and let’s begin from the most important place:
what exactly does Styrenix do, and why does it occupy an important position within India’s manufacturing ecosystem?
At its core, Styrenix manufactures engineering plastics that are used in products we encounter every day—from automobiles and appliances to electronics, healthcare products, and industrial equipment.
While most consumers have never heard of the company, its materials are embedded in countless products around us. Its portfolio includes ABS, SAN, Polystyrene, and specialised polymer blends.
At this point, terms like ABS, SAN, and Polystyrene may sound like chemistry class all over again. Fortunately, understanding the business is much simpler than understanding the chemistry.
The simplest way to think about Styrenix is as a steel mill — but for plastics.
The company starts by purchasing basic petrochemical building blocks such as Styrene, Acrylonitrile and Butadiene. These are commodity chemicals derived from crude oil and natural gas and are available globally. On their own, they aren’t particularly valuable or useful for most end applications.
What creates value is what happens next.
Inside its manufacturing facilities, Styrenix combines these chemicals in different proportions and processes them through specialised polymerisation technologies. Think of it like a baker using the same ingredients to make different products. A slight change in the recipe can completely change the final output.
The result is not finished consumer products, but small plastic pellets or granules. These pellets possess specific properties such as strength, heat resistance, rigidity, transparency or impact resistance depending on the formulation used.
These materials are then sold to manufacturers across industries.
An automobile company may use them for dashboard components. A refrigerator manufacturer may use them for interior liners. Electronics companies use them for housings and casings, while consumer durable companies use them in everything from air-conditioners to washing machines.
Styrenix itself never manufactures the final product. It supplies the material that goes into those products.
In simple words, the company’s business model is straightforward: buy commodity chemicals, convert them into specialised engineering plastics, and sell them at a premium to industrial customers.
Now that we understand the basic business model, let’s look at the individual products that make up Styrenix’s portfolio and why each serves a different purpose within the manufacturing ecosystem.
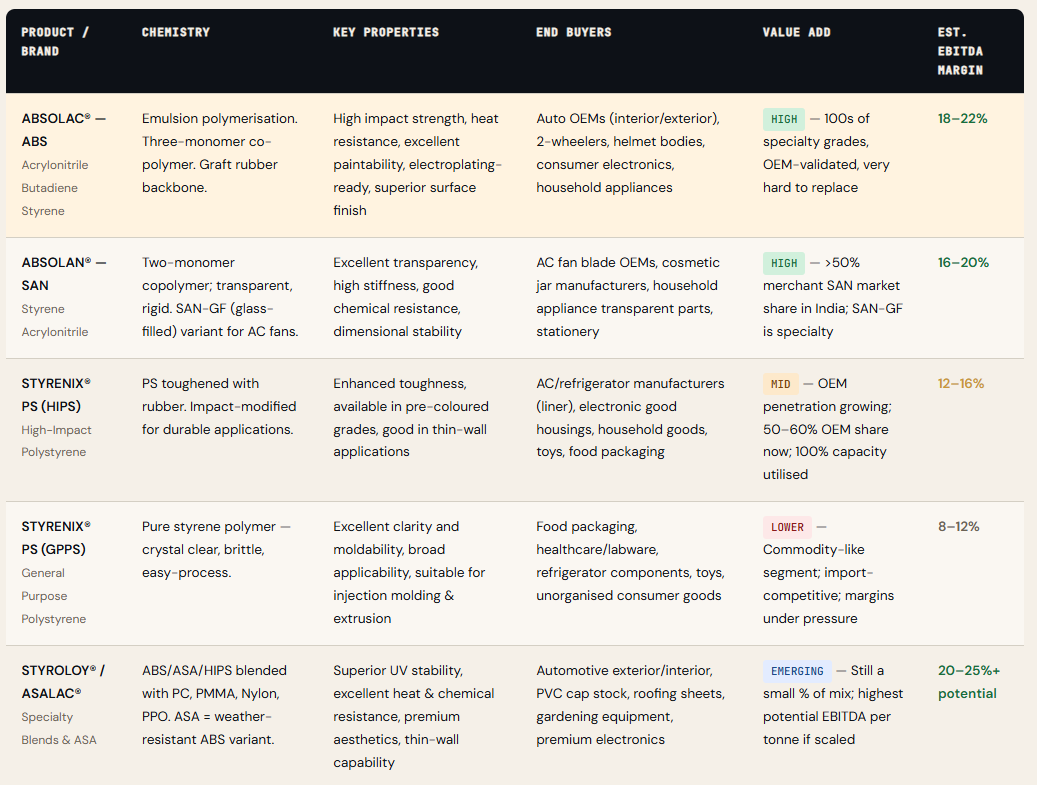
Having understood what Styrenix manufactures and its product portfolio, the next logical question is how the company generates revenue. At a broad level, its revenue is driven by three key factors:
Volumes – How many tonnes of material are sold.
Realisations – The selling price per tonne
Product mix – The share of higher-value products such as ABS versus lower-value commodity grades.
However, focusing only on revenue can be misleading.
Styrenix is fundamentally a spread business. What matters is not just the selling price of its products, but the difference between what it pays for raw materials and what it sells the finished polymer for.
This is where the pricing model becomes important.
Over 70% of Styrenix’s sales come from large OEM customers under formula-based contracts. Another 15–20% of sales come from mid-sized manufacturers, where pricing is often negotiated using similar raw material-linked mechanisms, albeit without formal long-term contracts. The remaining 10–20% of the business is exposed to spot-market pricing, where realised spreads tend to be more volatile.
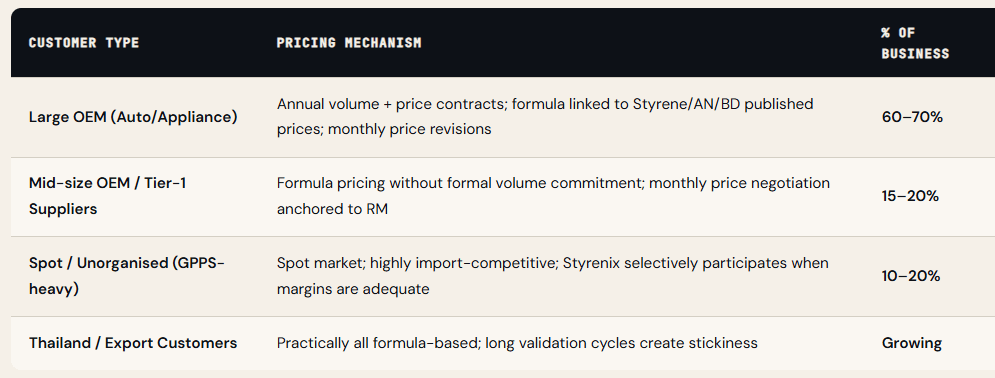
This customer mix highlights an important aspect of Styrenix’s business model.
Unlike many commodity businesses that are heavily exposed to fluctuations in raw material prices, a significant portion of the company’s revenue operates under pricing mechanisms designed to pass through input cost changes.
Naturally, this raises an important question: How exactly do these raw material-linked contracts work, and why are they so important for profitability?
The simplest way to understand this is through an example.
Suppose Styrenix signs an annual agreement with a refrigerator manufacturer to supply ABS every month. Instead of fixing a selling price for the entire year, both parties agree on a pricing formula linked to key raw materials such as Styrene, Acrylonitrile and Butadiene.
As raw material prices move up or down, the selling price adjusts accordingly. This allows Styrenix to recover changes in input costs while preserving a relatively stable processing margin.
The illustration below demonstrates how such a contract works and why formula pricing helps reduce earnings volatility despite fluctuations in raw material prices.
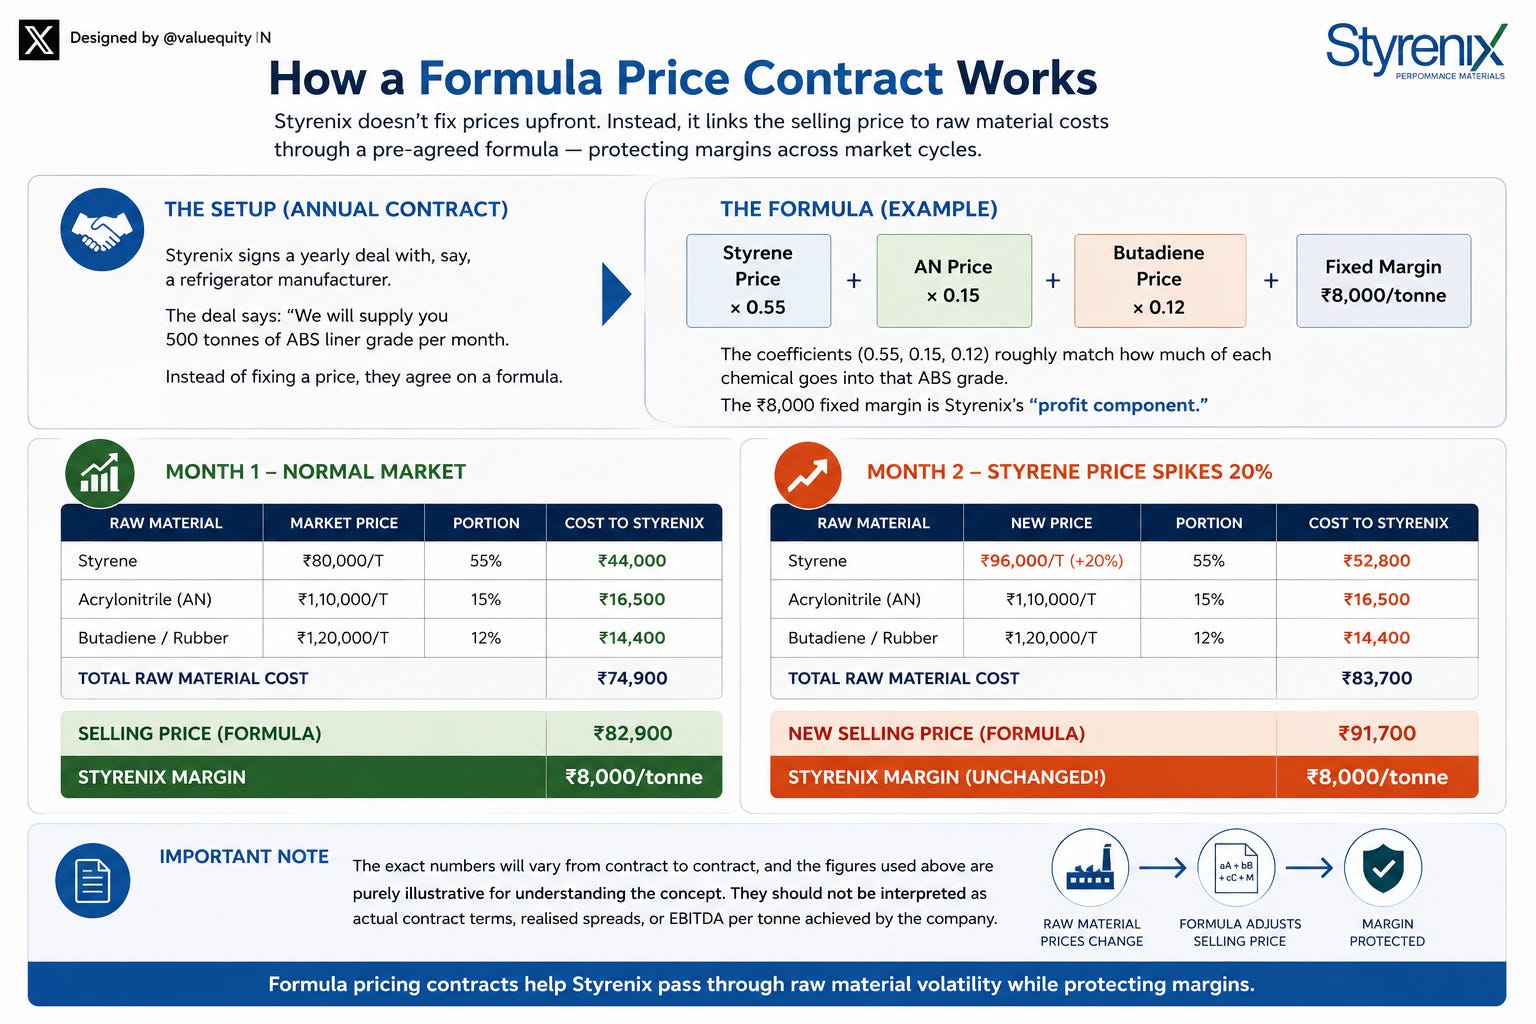
The key insight from above snapshot is more important than the exact numbers.
When raw material prices rise, revenue can increase significantly even if profitability remains unchanged. Likewise, when raw material prices fall, reported revenue can decline despite margins remaining healthy.
This is why polymer businesses often confuse investors. A fall in revenue does not necessarily signal weak performance. It may simply reflect lower commodity prices passing through the income statement.
What ultimately matters is whether Styrenix can maintain healthy spreads, improve product mix, grow volumes, and deliver consistent EBITDA per tonne over time. In recent years, the company has broadly managed to do this, with standalone EBITDA margins improving from around 12% in FY23 to 13.5–14% in FY26, indicating relative stability in spreads.
Put simply, Revenue tracks commodity prices; EBITDA tracks volume × spread.
Understanding this difference is critical because it forms the foundation for analysing almost every chemical and polymer company, including Styrenix.
Styrenix serves 600+ customers across India and Asia, supplying engineering plastics to industries such as automobiles, appliances, electronics, packaging, healthcare, and industrial applications.
The image below helps better visualize how the company’s products are used across industries and in real-world applications, highlighting key end-user segments.
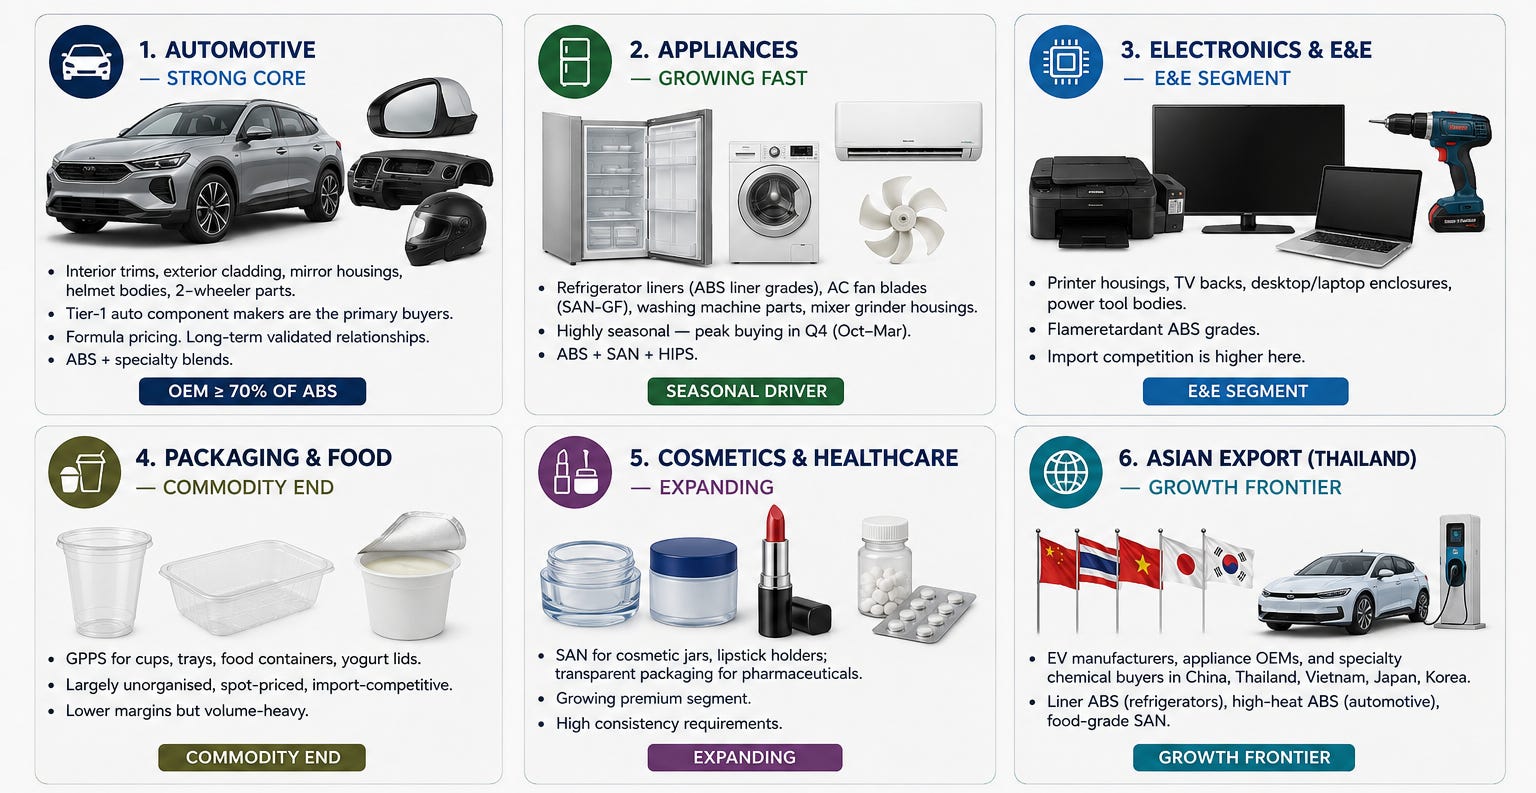
The customer base is well diversified, with no single customer contributing more than 8–10% of revenue. Also, Company caters to both large OEMs and trading channels, allowing it to participate across multiple manufacturing segments while reducing dependence on any one industry or customer.
🚩🚩 IMPORTANT ANNOUNCEMENT ⛳⛳
I’ve officially started my mentorship community. If you’ve been regularly reading my newsletters, you already know the kind of work and market approach I focus on. The goal of this community is simple — to help serious investors think independently, navigate markets with clarity, and grow together over the long term. If you’re interested in joining, you can : Email me at thelogicalinvestor.business@gmail.com Or reach out directly via X /Substack DM (details mentioned above)
When you reach out, include a brief introduction about yourself along with your current investing framework or approach to markets. From there, we can continue the conversation over email or chat. Let’s build a strong community and grow together.
The purpose of this section is actually to answer: “Why can Styrenix earn spreads and retain customers instead of becoming just another commodity producer?”
That answer comes from manufacturing capabilities, product development, technical know-how, customer approvals, R&D and other operating advantages. Let’s decode each of these one by one.
Styrenix operates through a network of five modern, ISO-certified manufacturing facilities spread across India and Thailand, covering over ~4 lakh square metres in total. The facilities are also partially backward integrated through in-house rubber production, which improves raw material control and operational efficiency. (We will revisit this aspect in greater detail in other section.)
In India, the company operates four manufacturing plants with a combined installed capacity of approximately ~3,27,000 tonnes per annum across various product categories.
Among these 4, the Moxi facility in Gujarat stands out as the flagship manufacturing complex. Built and expanded over several decades, it remains the core hub for ABS, SAN, and PS production in India.
The snapshot below provides an overview of company’s installed capacities across key product categories , estimated sales volumes, utilisation levels, and how each product is monetised.
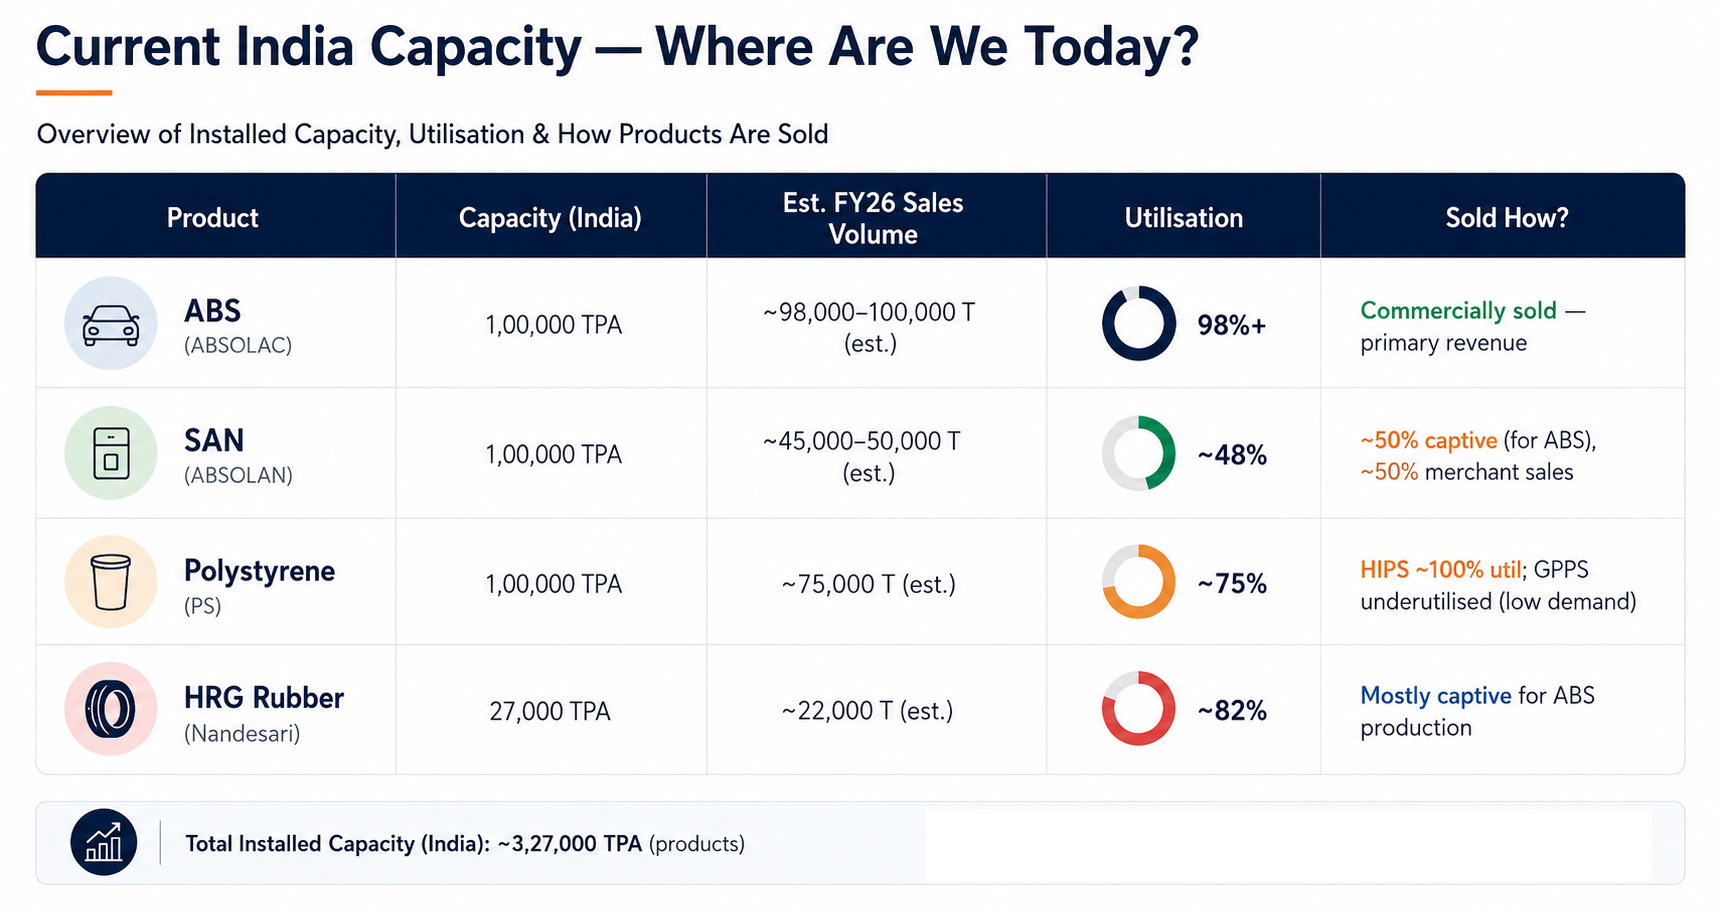
Overall utilisation across the portfolio remains healthy. However, ABS — the company’s highest-value and fastest-growing product — is operating at near full capacity, while other product categories still have adequate headroom for growth.
The main bottleneck is ABS. At 98%+ utilisation, India's ABS plant has no room to grow. Every rupee of new ABS demand India generates, Styrenix cannot capture it without new capacity. This is why capacity expansion is not optional — it is necessary to maintain growth momentum.
So far, the focus has been on understanding the company’s manufacturing footprint in India. However, in 2025, Styrenix also acquired a ABS plant in Thailand. In the next section, we shift to this acquisition—its rationale, capacity, and the strategic shift it introduces for the company.
This is covered separately to provide a clearer and more structured understanding of the company’s evolving manufacturing and growth strategy.
The international expansion of Styrenix is anchored by its facility at the Map Ta Phut Industrial Estate in Thailand.
Acquired in January 2025 for approximately USD 20–22 million, the facility was previously owned by INEOS Styrolution Thailand and gives Styrenix a meaningful manufacturing presence in Southeast Asia.
The plant manufactures specialty ABS, SAN and HRG Rubber, with installed capacities of approximately 85,000 TPA, 1,00,000 TPA and 31,000 TPA respectively. Spread across nearly 70,000 square metres, the facility currently operates at only around 45%-50% utilisation on a weighted-volume basis. The snapshot below provides a detailed breakdown of product-wise capacity and utilisation.
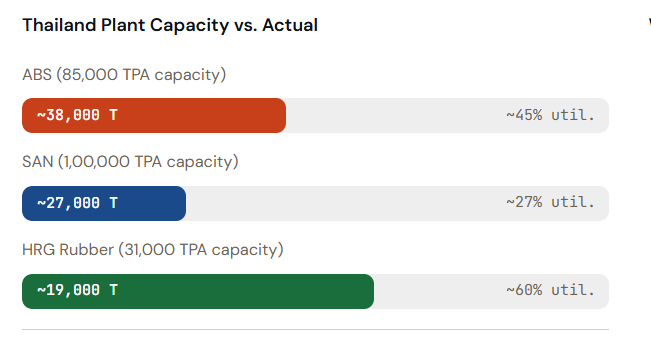
The current utilisation profile of the Thailand facility suggests that the asset was acquired with significant headroom for value creation and operating leverage.
At this stage, an important question naturally arises.
This is perhaps one of the most important questions for investors. The answer not only reveals how management evaluates acquisitions, but also provides valuable insight into their capital allocation philosophy, financial discipline, and ability to balance growth opportunities with shareholder value creation.
To assess this, it is useful to compare acquisition economics with greenfield expansion costs.
Management has guided that a proposed 50,000 TPA ABS expansion in India could require capital expenditure of approximately ₹350 crore. That implies a replacement cost of roughly ₹70,000 per tonne of ABS capacity.
Now compare that with the Thailand acquisition.
For approximately ₹170–190 crore (USD 20–22 million), Styrenix acquired a business that includes 85,000 TPA of ABS capacity alone. Even before considering SAN capacity and HRG rubber capacity, technical know-how, trained workforce, and export market access, the acquisition cost per tonne appears significantly lower than the cost of building fresh capacity.
The comparison becomes even more striking when one considers that the acquisition also included 1,00,000 TPA of SAN capacity and 31,000 TPA of HRG rubber capacity. Viewed purely from a replacement-cost perspective, the acquisition appears highly attractive.
This naturally shifts the discussion to a more important underlying question.
This is the obvious question. If the asset is so attractive, why would a global leader sell it, and that too at seemingly modest valuations?
The answer may lie in a simple investing principle:
INEOS Styrolution is the world’s largest styrenics company, with more than €6 billion in annual revenue and a globally diversified manufacturing footprint. Its strategy is driven by scale, portfolio optimisation, and disciplined capital allocation across regions.
Within such a structure, smaller specialty assets like the Thailand facility—operating at relatively low utilisation levels of around 40–45%—may not be strategically significant enough to justify continued ownership, even if they are operationally sound.
This is also consistent with a broader pattern of portfolio rationalisation. INEOS had earlier sold its controlling stake in India business in 2022, along with other non-core divestments across its styrenics portfolio. Across these transactions, the language used by the company consistently points to strategic exits rather than distress-driven sales.
In other words, the asset was not necessarily unattractive. It was simply non-core within a large global portfolio. The same business can be sub-scale for a global multinational, but highly strategic for a focused regional player.
The Thailand business reportedly generated revenue of approximately ₹1,864 crore in 2021, ₹1,484 crore in 2022, and ₹976 crore in 2023. However, profitability was likely impacted by industry cycles and sub-optimal utilisation during this period. For a global owner focused on return thresholds, such an asset may not have met internal capital allocation criteria.
For Styrenix, however, the equation is very different.
If the previous section explained why INEOS was willing to sell, the next section explains why Styrenix was willing to buy.
Perhaps the most important—and most misunderstood—aspect of this acquisition is that Styrenix is not merely acquiring capacity or a revenue stream. It is acquiring a global platform that provides technology, customer relationships , product capabilities, and market access that would be difficult and expensive to build organically from India.
Management has consistently framed Thailand more as a “platform acquisition” rather than a traditional capacity addition. The strategic value therefore extends far beyond the asset’s current earnings profile.
This is also where the motivations of the buyer and seller diverge. For INEOS, the business was part of a broader portfolio rationalization. For Styrenix, the same asset represents a growth platform—one that can expand customer access, enable new products, and strengthen its position in the global ABS value chain.
Thailand adds another important dimension. A local manufacturing presence provides direct access to East Asian markets and places Styrenix closer to several global OEMs and manufacturing hubs. This improves customer proximity, supply reliability, and qualification opportunities that are difficult to achieve through exports alone.
There is also a customer-transition opportunity. OEMs that historically sourced from the INEOS platform still require a reliable supplier, creating an opening for Styrenix to establish itself as the preferred continuity partner while deepening those relationships over time.
Viewed through this lens, the acquisition is less about adding capacity and more about acquiring future optionality—new products, new customers, deeper OEM penetration, and greater participation in global markets. That is why the asset may ultimately be worth more in Styrenix’s hands than it was within a much larger group that chose to exit the business.
So what exactly does this platform bring to Styrenix? Let's break down the key capabilities and opportunities that come with the Thailand facility.
One of the biggest advantages of the Thailand facility is access to specialty grades ABS that are either not produced in India today or would require significant time and investment to develop.
These include Liner ABS used in refrigerator interiors, High-Heat ABS used in demanding automotive applications, premium food-grade SAN formulations, and advanced HRG rubber manufacturing capabilities.
These are not commodity products. They typically command better realizations, enjoy higher customer stickiness, and generate superior EBITDA per tonne compared to standard ABS grades.
Management has already indicated that learnings from Thailand will be incorporated into the design of future Indian expansion projects.
The HRG rubber capability is particularly important. As discussed earlier, HRG rubber is one of the most critical inputs determining the performance characteristics of ABS. Access to additional process know-how and manufacturing expertise can help Styrenix improve product quality, expand into higher-specification applications, and strengthen its competitive positioning in specialty grades.
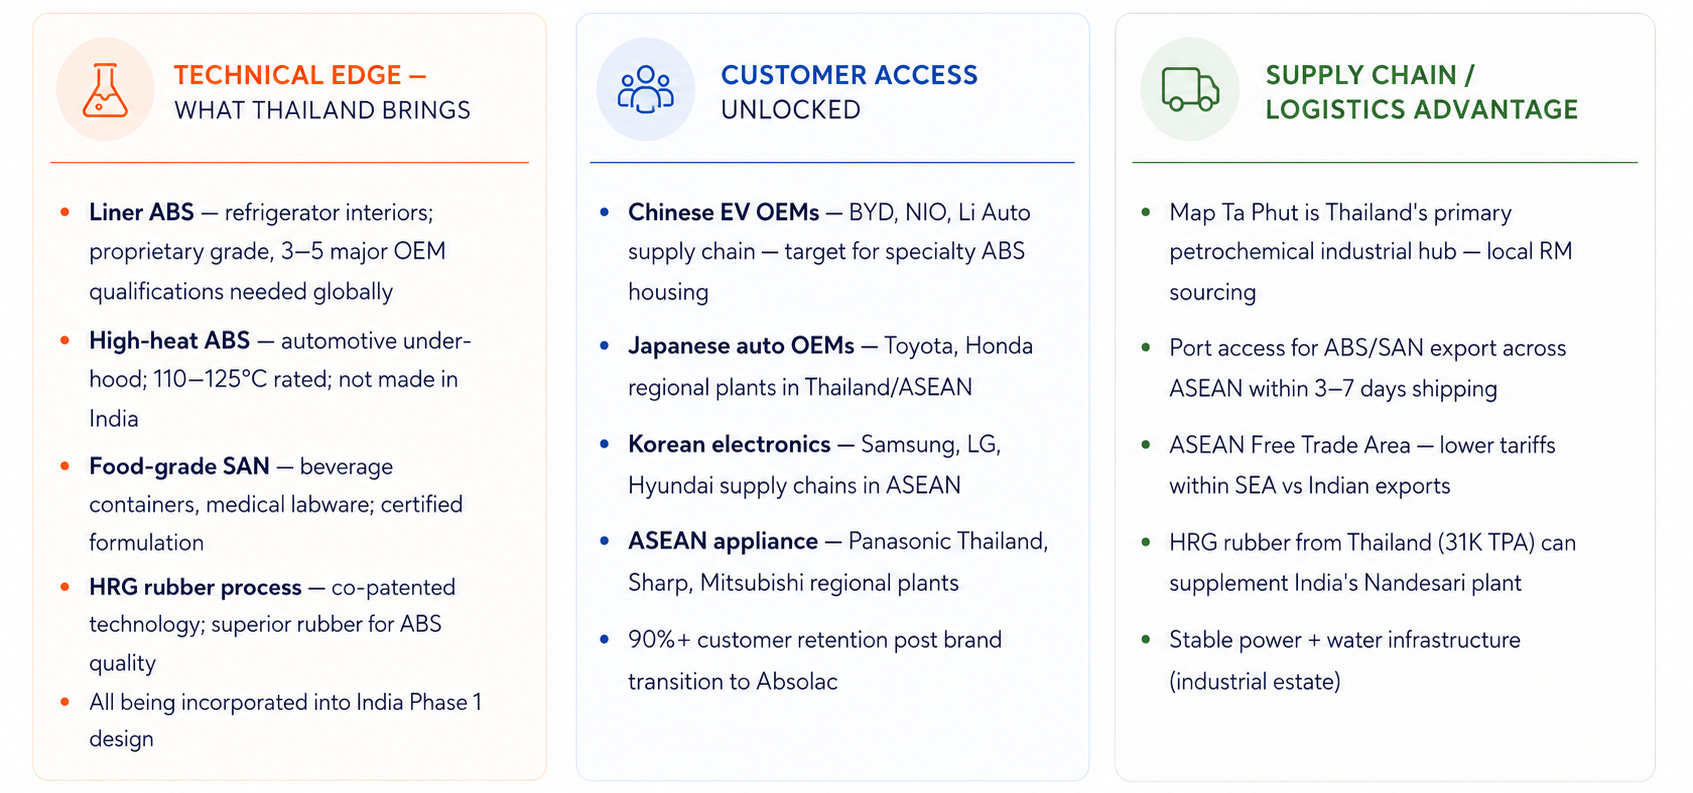
The second pillar of the acquisition is customer access.
Building polymer capacity is relatively straightforward, but building customer approvals is significantly more complex. In industries such as automotive, appliances, and electronics, OEM qualification cycles can take 12-18 months, making approved supplier status an important structural advantage.
The Thailand facility continues to provide exposure to key Asian markets including China, Japan, Korea, and Vietnam. These regions are among the fastest-growing demand centres for engineering plastics, driven by electric vehicles, consumer electronics, and premium appliances.
Alongside this, Styrenix is gradually expanding its international commercial footprint. The company is building a stronger sales and marketing presence across China, Vietnam, Japan, Korea, Indonesia, and select ASEAN markets. The objective is not only to increase exports, but to move closer to OEMs and converters, improve customer engagement, and better align product mix with regional demand trends.
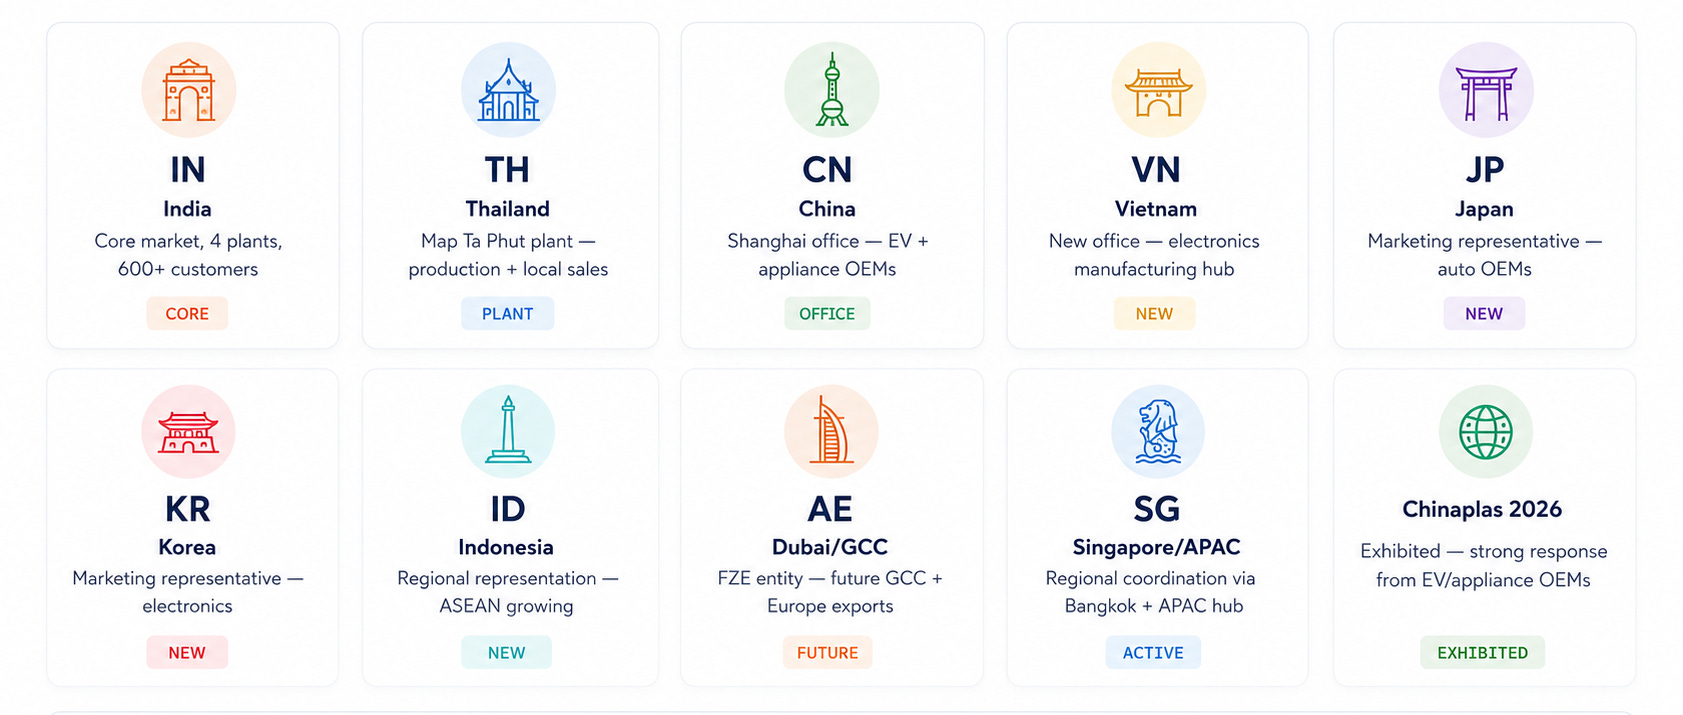
Over time, the combination of a local Thailand manufacturing base and a broader Asian commercial presence should support higher utilisation levels and enable a gradual shift toward higher-value specialty applications.
The Thailand facility also provides several operational advantages that are often overlooked.
The plant is located within Map Ta Phut, one of Southeast Asia’s largest petrochemical hubs. This provides access to raw materials, established infrastructure, stable utilities, and a mature chemical ecosystem.
Its proximity to major ports allows ABS and SAN shipments to reach customers across ASEAN region within a matter of days, creating logistical advantages over exports originating from India.
Taken together, the Thailand acquisition is best viewed not as an additional manufacturing plant, but as a global platform that expands Styrenix’s technology base, customer reach, supply chain capabilities and future growth opportunities.
The capacity came with the deal. The strategic optionality is what management is really betting on.
Chinaplas Event 2026 : In the Q4 FY26 call, Rahul Agrawal said Styrenix "recently exhibited at Chinaplas" and had "very positive interactions with customers in the EV and appliance space" who are "becoming globally relevant." Chinaplas is the world's second-largest plastics/rubber trade show — attended by the world's largest EV manufacturers (BYD, NIO, Li Auto, CATL's supply chain), the world's biggest appliance OEMs (Midea, Haier, Gree), and global electronics companies. Getting qualified by ONE such customer as a specialty ABS supplier would be a 5,000–10,000 tonne/year contract at premium pricing.
For additional context, watch the interview of chinese anchor with Rahul Agarwal at the Chinaplas event below.
The significance is not the exhibition itself. The significance is what it represents.
For the first time, Styrenix is actively positioning itself in front of global customers that were previously outside its reach from india perspective . Whether these conversations translate into commercial volumes remains to be seen. However, they illustrate the broader strategic intent behind the acquisition.
Thailand acquistion is a classic example of a transaction where value is determined not only by the asset itself, but also by who owns it. An asset that may have been non-core for INEOS could become strategically important for Styrenix.
Within Styrenix’s product portfolio, ABS is the crown jewel of the business. It is the highest-value, most differentiated product and typically commands better margins compared to the rest of the portfolio.
Based on available disclosures , ABS is estimated to contribute around ~55–60% of India standalone revenue. Polystyrene (including HIPS and GPPS) accounts for roughly ~30–35%, while SAN and other specialty blends make up the remaining balance.
It is important to note that these figures are not officially reported segment disclosures, but rather our own estimates based on industry understanding and management commentary. The company does not publicly break out revenue by product line in detail.
What is more important than the exact mix is the underlying trend. Management has indicated that ABS volumes have been growing at over 10%-11+, while Polystyrene volumes have remained largely flat in FY26. This gradually shifts the mix in favour of higher-value products over time.
We will next look at how this product mix, combined with backward integration and in-house capabilities, makes the overall structure more resilient and defensible over time.
Note: Beyond this newsletter, I've created a 50-page playbook that breaks down my complete stock research framework using Styrenix as a real-world case study. It covers how I research businesses, connect information to insights, and build conviction in an investment. If you'd like to learn the process and access the playbook, DM me using the button below. (Paid resource)
As we discussed in the previous section, ABS is Styrenix’s crown jewel product. It sits at the top of the company’s product mix in terms of value, contribution, and strategic importance.
To really understand why management continues to double down on this segment through ongoing capex , we need to go one level deeper into the chemistry and the underlying know-how behind ABS manufacturing.
At its core, ABS is not a single chemical. It is a carefully engineered combination of three inputs — Styrene, Acrylonitrile, and Butadiene. Styrene provides rigidity and gloss, Acrylonitrile adds chemical resistance and heat stability, while Butadiene gives the material its impact strength.

What Styrenix essentially does is take these building blocks and convert them into a high-performance plastic that can be tailored for different end uses. Small changes in formulation can completely change the final properties of the material, which is why ABS is less of a commodity and more of a "designed material."
This is where backward integration starts to matter.
A critical input in ABS production is rubber, specifically High Graft (HRG) rubber, which forms the backbone for impact resistance. Styrenix produces this in-house at its Nandesari facility. While this may sound like a small detail, it is strategically important because the quality of HRG rubber directly determines the performance and consistency of ABS grades.
Better rubber control means better ABS grades. Better grades mean stronger OEM approvals and stickier customer relationships.
For many engineering plastics companies, manufacturing can be replicated with capital. What is often harder to replicate is decades of formulation expertise, customer-specific know-how and application development capabilities.
This is where Styrenix’s R&D infrastructure becomes increasingly important.
Beyond manufacturing capacity, one of Styrenix’s key strengths is its in-house R&D centre at Moxi, Gujarat.
Established in 1995, this facility is NABL-certified and operates under ISO/IEC standards. But its real importance is not in certification alone — it lies in how deeply it is embedded in the company’s product development and customer relationships.
A large part of Styrenix’s competitive strength comes from this ability to continuously create and refine product grades based on end-customer requirements. Each improvement or new formulation doesn’t just expand the product portfolio — it strengthens customer dependence on the company’s technical capabilities.
A few of the R&D capabilities are highlighted in below snapshot.
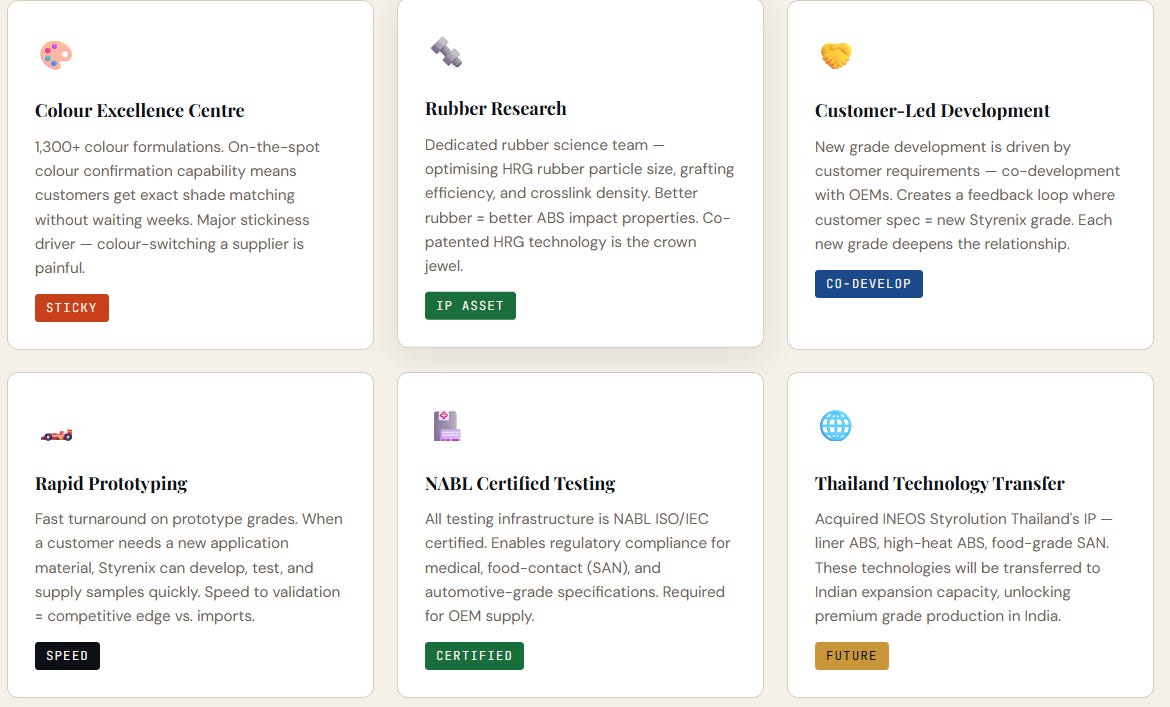
The R&D function at Moxi is not just a support unit. It is a core part of how the company builds product differentiation, locks in customers, and steadily expands its presence in higher-value grades.
That’s it for Part 1 of the Styrenix deep dive.
So far, we’ve focused on understanding the business from the ground up — breaking down the product portfolio, decoding how the company earns its spreads, studying the manufacturing footprint, and understanding why assets such as the Thailand facility, HRG Rubber integration and the Moxi R&D centre could be more important than they initially appear.
But the more important questions are still ahead:
Can industry growth absorb the company’s aggressive capacity expansion plans?
Will recent acquisitions and international initiatives become meaningful value creators?
How much earnings power can new products and capacity additions unlock over the next cycle?
And most importantly, is the market too focused on near-term earnings while overlooking the much larger opportunity management is trying to build?
We’ll explore all of this in Part 2, where we shift our attention from understanding the business to evaluating the investment thesis, growth drivers, risks, challenges and the factors that could ultimately determine shareholder returns.
If you’d like the next part soon, let me know in the comments—that will help decide how quickly I take this forward.
Let’s keep learning, thinking, and compounding together — until we meet again with another deep dive.
Happy investing!
📩 Subscribe for more deep-dive insights.
Understanding a business deeply is a journey I take for myself — but transforming that depth into something simple, structured, and genuinely useful for you… that’s a whole different craft. It takes hours of reading, thinking, questioning, and connecting dots — all to bring you clarity without the noise.
If this work resonates with you, I’d truly appreciate your support.
A like, a share, or a restack helps this reach more curious minds like yours.
And your comments? They mean more than you might think. They keep me going, keep me improving, and remind me why this effort is worth it.
If you’ve found value in my detailed analysis and insights, and would like to support this work, I’d be truly grateful. Your contribution helps me continue creating high-quality, in-depth research.
A contribution of ₹399 or ₹499 would go a long way in keeping this going. You can support via PhonePe or Buy Me a Coffee using the QR code below (optional).

If you’ve already supported—thank you, it genuinely means a lot. Feel free to leave a comment on the blog or send me a message. I’d be happy to share some additional research material on the company with you over a personal chat.
A View-Point from Investor’s Lens 🧐
See you next time, Happy investing!
1. Internal Research from Public Information
2. Management Interviews, Annual Presentations FY25 , Sectoral coverage reports by brokerage houses , Analyst Reports
3. This newsletter is Written based on data as per MARCH/APRIL 2026. Consider crosschecking.
Comments
Nothing yet. Say the first thing.
Sign in to join the conversation.