
You can get access to our charts and data inside our TBL Pulse Dashboard:

Dear Readers,
Narrative-building events. That’s how I would describe the past two weeks. But it is clear two things dominated headlines at the root: the US Treasury and AI.
AI-related debt issuance is currently being pointed at by many as the culprit for the current bearish wave in USTs. Hell…AI appears to be everyone’s go-to for anything good or bad in the economy nowadays.
The argument is that the more long-maturity issuance takes place in investment-grade (IG) credit markets, the greater the appetite to enter IG, as those yields look more appealing than USTs. This year’s long-term AI-related IG issuance makes up almost 40% of total long-term issuance:
This competition for safe-haven-seeking capital effectively pushes long-maturity UST investors into the IG credit market, leading to higher long-end yields and a steepening curve (chart below compares yield curve today to a year ago)…or at least that’s how the narrative goes:
This reasoning carries some true weight, but misses the full picture. There are monetary, inflationary, real growth, geopolitical, and fiscal dynamics that better explain why yields have risen.
My goal today is to showcase the interesting position the US Treasury finds itself in. One where growth (especially from AI) can be both good and bad for its fiscal outlook.
The popular story right now is that AI debt supply is crowding out Treasuries, but I question it. Nearly 40% of this year’s investment-grade issuance has come at the long end, and the claim is that IG yields are pulling capital away from long-maturity USTs and steepening the curve. That narrative carries real weight, but monetary, inflation, real growth, geopolitical, and fiscal dynamics explain the rise in yields far better.
The Treasury’s decision to at least double buybacks moved rates for a moment, then they retraced almost fully. That tells you the move was all on optics. Buying illiquid off-the-run paper with TGA cash does very little to the Treasury market itself, so what actually moved yields was Bessent communicating that the tools and the willingness to use them exist.
I would not call this yield curve control. YCC implies sustained, material targeting of a specific rate or portion of the curve. This is guidance for the back end, and the operational changes are not groundbreaking, at least not yet.
The micro root of AI debt issuance is game theory. As Nik put it this week, any single company that refuses to hit the bond market for capex is guaranteed to lose to the competitor that does.
Gross IG issuance is around $1.68T so far in 2026, with AI making up more than 30% of the roughly $560B net. Tech is now the second largest sector in the IG market, so the top IG issuers are increasingly tech companies.
A large slice of AI financing sits outside IG entirely, backstopped by hyperscaler contracts.
The demand side says the market is not choking on any of this. IG spreads are the tightest in 28 years while USTs sit near their 73rd percentile, which suggests investors are being pulled into credit rather than pushed.
I somewhat fade the crowding-out effect on the Treasury market. IG issuance is not the marginal driver of the long end. It all comes back to macro, which is exactly why Bessent’s tools land with such force, and why buybacks that are trivial in size still matter as guidance that redistributes outcomes.
This is where it connects to TBL Liquidity. Pin down UST market expectations, and you lower volatility. Lower volatility makes collateral more reliable, which raises the collateral multiplier, which expands the ability to lend off the backs of the current supply of Treasuries, which expands credit and Liquidity. The Treasury may be selling a volatility put more than a UST-level put, and the open question is whether it can keep Treasury vol low while the US grows fast.
Consider what higher yields mean for the US government. As far as US Treasury Secretary Scott Bessent is concerned, higher yields are no good. Thus, he must intervene in FX markets to avoid any US Treasury sales. And as of late, even Treasury Buybacks have made their way into the toolkit.
The latest announcement by the US Treasury is to, at the very least, double the size of buybacks (although word on the street is that the increase might be more than double). The optics of it all were enough to lower long-term rates momentarily before they retraced back almost fully to their pre-announcement levels:
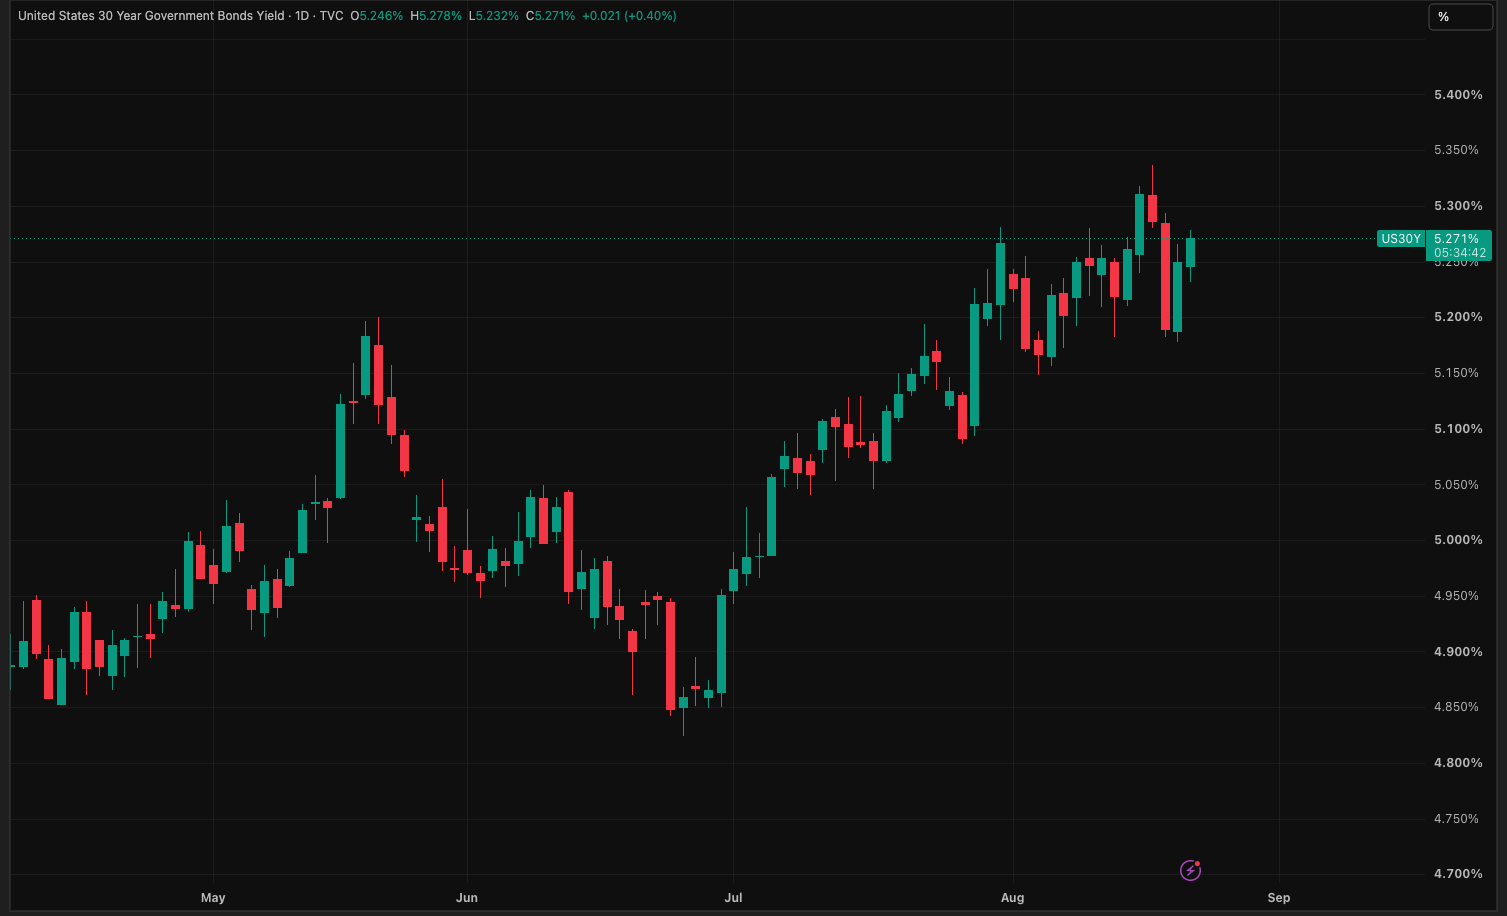
I say optics because Treasury Buybacks are a relatively insignificant operation within the overall US Treasury market (more on this below). Buying back a small amount of illiquid off-the-run Treasuries with TGA cash (which is currently funded heavily with TBills) doesn’t necessarily have a material effect on Treasury market mechanics or duration.
There is a semantics debate on whether buybacks truly are duration-neutral. The Treasury itself has stated that “buybacks are not intended to change the overall maturity profile of the debt outstanding.”
I think buybacks being duration-neutral only holds if the size of the buybacks remains small, and for now, they are small, so unless the size increases by more than a marginal amount, I stand with the duration-neutral camp.
So, in short, yields fell because of what Bessent is communicating with the changes.
Treasury guidance is what moved USTs.
I don’t really like to call this Yield Curve Control (YCC) for that very reason either. YCC implies sustained and even material targeting of a specific rate or portion of the curve. This announcement is primarily just communication/guidance tactics for the back-end (even if Bessent wants to call it a Treasury Twist).
In fact, my question to Bessent would be: “What were you seeing in this illiquid part of the market to prompt you to increase buybacks by not a very large amount?”
The non-political answer would probably just be, “Optics.”

Let me provide a quick primer on buybacks.
“While the early 2000s [Treasury Buyback] program focused on maintaining adequate benchmark auction sizes so that on-the-runs would stay liquid, the current liquidity support buybacks aim to support liquidity in off-the-runs by providing a regular, predictable opportunity to sell them back to Treasury.”
May 8 2024; Joshua Frost, Assistant Secretary of the Treasury
Whether you’re a fan of the largest sovereign debt market in the world or a simple macro reader, you likely heard the term “Treasury Buybacks” this past week. And while it may be tempting to explain them off as the Treasury simply improving market liquidity, I’ve always wondered why these operations exist.
Specifically, within the scope of the Treasury’s mandate, why is there a need to perform buybacks?
Every month, the US Treasury issues brand new debt with different maturities. Newly-issued bills, notes, or bonds are referred to as ‘on-the-run’ Treasuries, but as those issues age, they turn into ‘off-the-run’ Treasuries. Given the sheer size of accumulated marketable debt in the US (chart below), it’s not surprising to see that over 90% of it consists of older issues (i.e., off-the-run Treasuries).
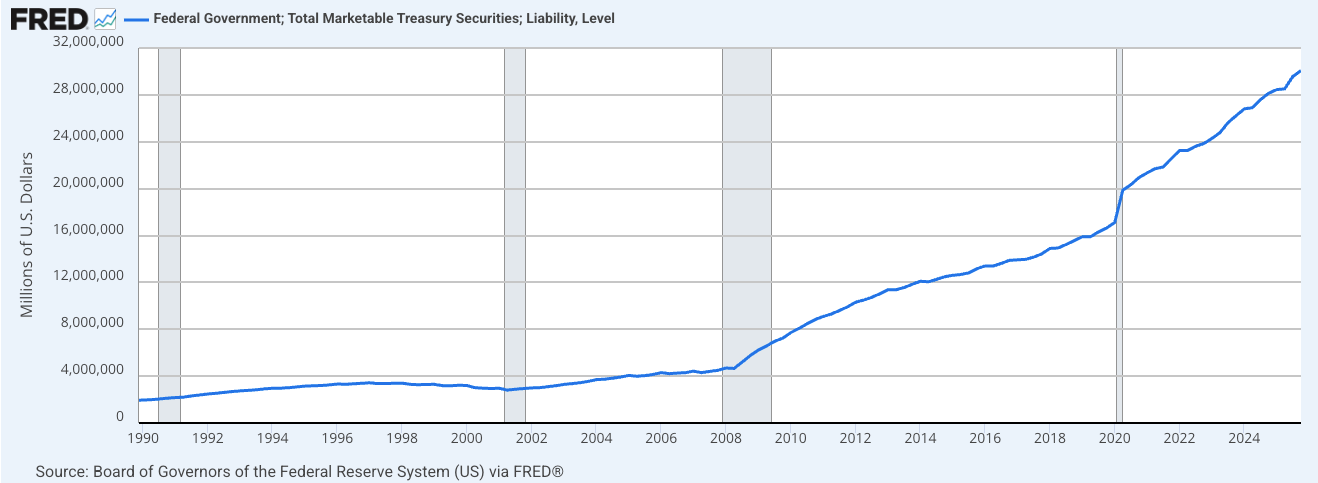
New (on-the-run) Treasuries remain ‘new’ until the next batch of Treasuries hits the market the following month, pushing most debt into the ‘off-the-run’ market quickly.
On-the-run Treasuries are liquid. Very liquid. While off-the-runs aren’t. Take a look at the average daily volume of on-the-run 2-year notes versus their off-the-run siblings (as calculated by the New York Fed):
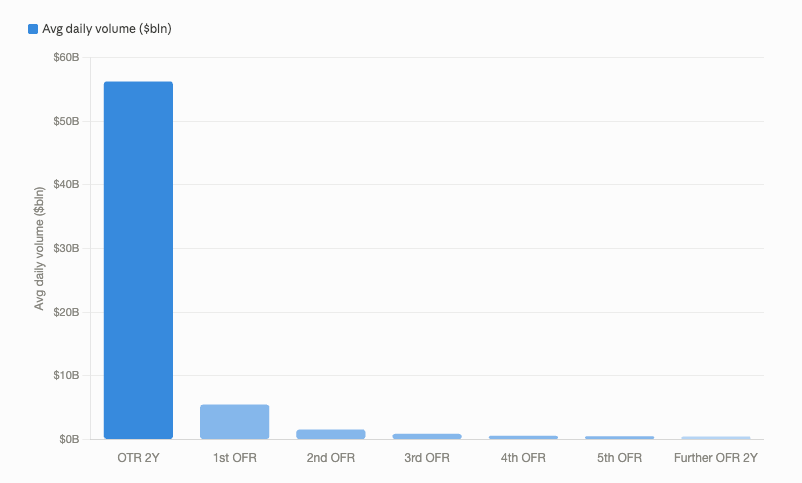
A ridiculous drop-off from $56B to $5.5B once an on-the-run becomes an off-the-run. This is not exclusive to the 2-year tenure; you see similar cliffs across different maturities.
Let me drive the point home by looking at the average number of daily trades in off-the-runs versus on-the-runs (again, in the 2-year sector):
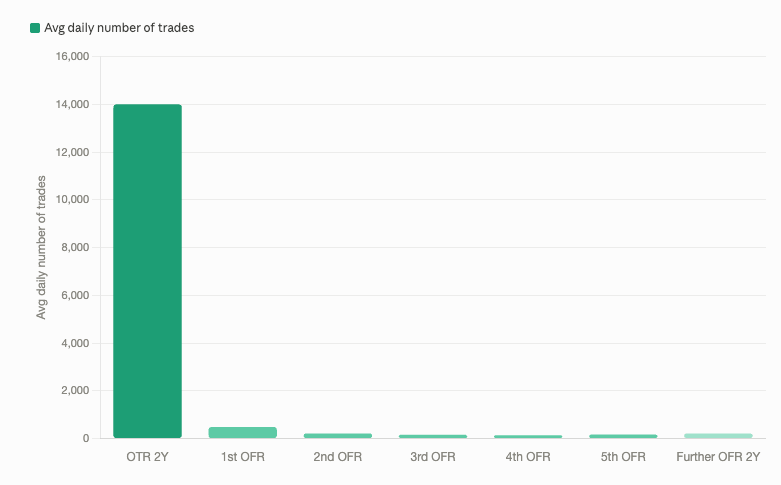
Another giant drop-off once a Treasury becomes off-the-run. Naturally, the next question is: why such a stark difference in liquidity between a new and an old Treasury?
For starters, the lower trade frequency and decreased volume in off-the-runs suggest that, as Treasuries age, the investor base changes from active traders (such as dealers) to long-term investors (such as pension funds, investment funds that pension funds hold, or foreign central banks).
Next, on-the-run Treasuries hold a benchmark status because they are the most recently priced debt, so naturally, trading infrastructure is built around on-the-runs, given the inherent demand. Accordingly, as soon as new issues hit the market, demand for the older ones dissipates.
Next: incessant US debt growth alongside dealer balance sheet capacity. Off-the-runs are harder to flip given their low liquidity status, so dealers refuse to keep them in their inventory. The main buyers for off-the-runs are quite literally end-users (pensions and other long-term holders). The following table by the NY Fed shows how off-the-run notes and bonds are heavily skewed toward dealer-to-customer transactions.
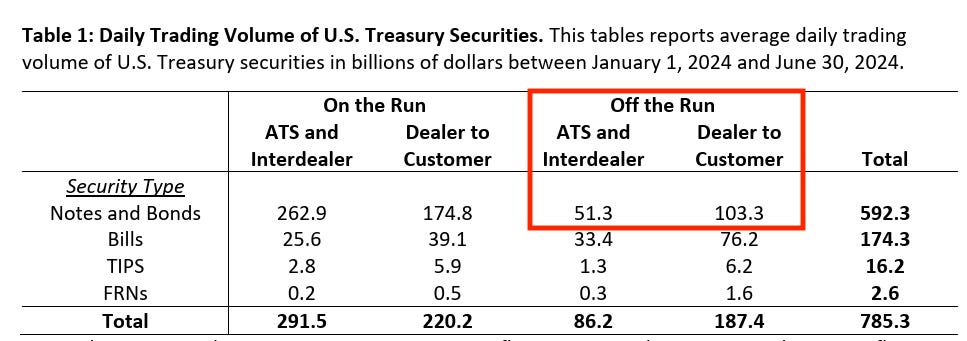
A pension fund is indifferent between buying an aged-down 30Y bond that is now a 10Y note and a newly issued 10Y note. A dealer, on the other hand, will prefer the newly issued note because it can sell it quickly to another dealer or hedge fund.
That said, debt growth isn’t really helping dealers turn over Treasuries. According to the IMF, dealer balance sheets aren’t able to keep up with the growing stock of Treasuries. As new issues hit the market fast, dealers feel the pressure of warehousing more and more off-the-runs, which takes up balance sheet capacity that could otherwise be used to absorb new issues.
In financing the government, “[t]he Treasury Department’s primary goal in debt management policy is to finance the government at the lowest cost over time.”
If dealers are stuck with illiquid off-the-runs, they will demand higher yields on new issues to compensate for the risk of getting stuck with even more illiquid inventory as debt grows. This cycle means the Treasury fails to achieve its primary debt management goal of keeping costs low.
Although the Treasury introduced the liquidity support buyback program in May 2024, buybacks are not necessarily new. From the year 2000 to 2002, the US government was surprisingly running a surplus (chart below), which led the US Treasury to perform cash management buybacks (a topic for another time).
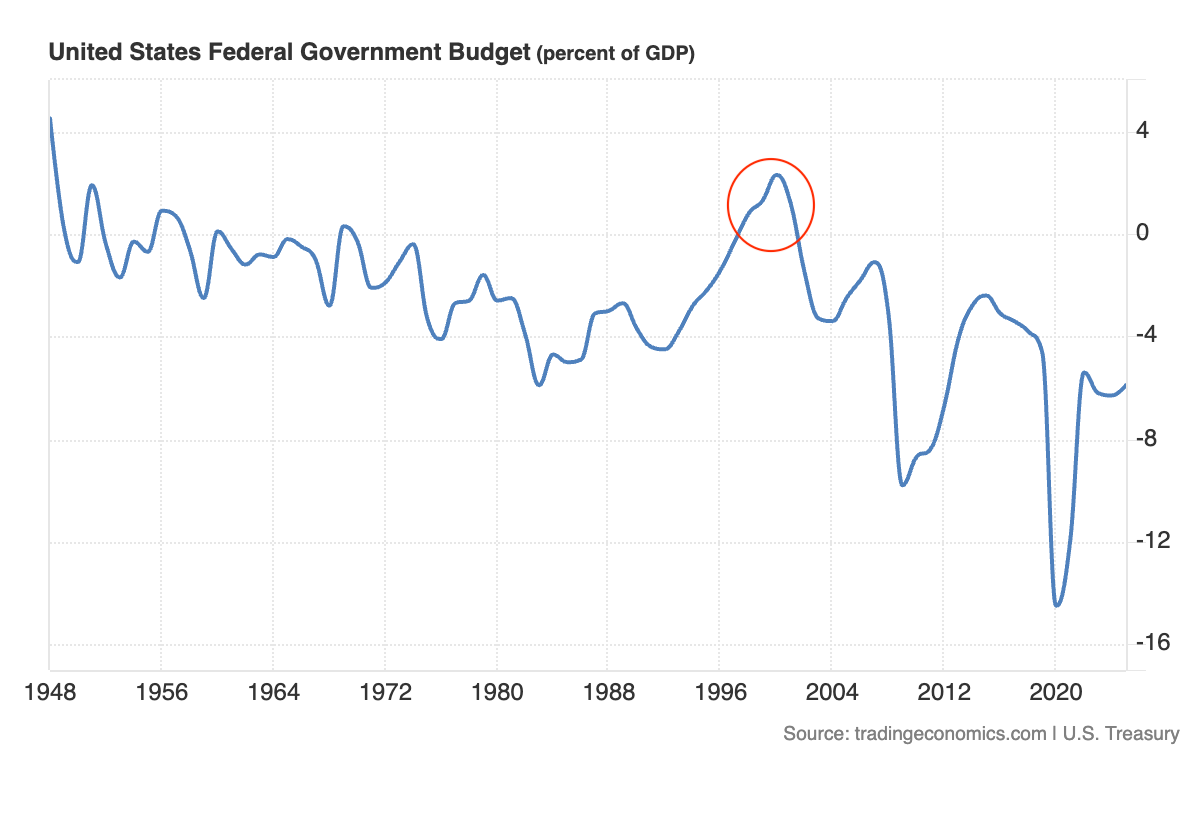
The program launched in May 2024 specifically targets off-the-run liquidity problems, not cash management. The buyback process goes as follows:
The Treasury makes a Quarterly Refunding Announcement
The day before the buybacks: Treasury provides a list of eligible off-the-run Treasuries
The day of: Treasury provides a final list, and dealers submit offers.
Day after: Settlement takes place
The IMF finds that buybacks do, in fact, increase the liquidity in these off-the-runs. Soon after the release of the listed off-the-runs, spreads in these listed securities narrow (i.e., a sign of improved liquidity conditions), in comparison to similar but unlisted off-the-runs. The narrowing is marginal, but present.
Joshua Frost puts it best:
“First, dealers should feel more confident making markets in off-the-run securities, as they will have Treasury as a regular and predictable buyer. Second, Treasury buybacks are expected to be “liquidity events” around which additional trading activity is likely to take place. And third, dealers may use buyback operations to free up balance sheet allocated to less-liquid positions at a fair price.”
Allowing dealers to offload off-the-runs more easily increases balance sheet capacity and confidence to continue absorbing and making markets for new on-the-runs without hiccups (e.g., without demanding higher yields or wider bid-ask spreads).
But again, the off-the-run market is inherently not that active, and buybacks are small, precautionary measures, which is why Bessent increasing buybacks doesn’t necessarily scream “groundbreaking YCC” to me.
Remember…what matters is what Scott Bessent is telling us by doing this.
Anyway, now that we understand this operational tool, let’s dive into the AI growth/debt issuance argument…
In this new AI era, there are clear winners and losers. I think of winners from multiple angles. A small business, for example, can now meet its administrative, marketing, and, to a decent extent, operational needs using AI. An individual can file their taxes without using third-party software, or even a tax advisor.
Want to create your own website? No problem! AI’s got you.
Losers are on the other side of that. Think of website-building software like GoDaddy or Wix, or tax-assisting software like Intuit. As an analyst, if these guys don’t adapt, I’d probably lower my revenue expectations.
Apollo breaks it down quite well, noting AI disruption through three different channels:
Direct Replacement: AI performs the same task as an existing product or service at a lower cost.
Labor Displacement: AI reduces demand for employees, contractors, or users that support a company’s revenue model.
Execution Risk: AI-native competitors innovate, iterate, and gain market share more rapidly than incumbents.
Anecdotally, I place more weight on points 1 & 3 than I do on 2, as I have yet to see signs of reduced demand for labor due to AI, but I can certainly see why an organization would hold off on hiring until they confirm that there is no AI solution to a problem.
But I digress. Point #3 is what I want to highlight: competitors innovate, iterate, and gain market share.
Nik wrote it best at the start of this week:
[...] here is what you have to understand about the game theory when it comes to the AI revolution and credit creation. If any single company refuses to hit the bond market and not borrow, it is guaranteed to lose to its competitor that is borrowing for capex. Guaranteed.
This is the micro root of all AI-related debt issuance.
In today’s globalized economy, a company (alongside the nation it represents) must hold an edge at the national and international level. You either become a price-setter or a price-taker on the global stage. The cost to compete at that scale, in my opinion, is kind of irrelevant right now. Japan is a prime example of this.
So-called Bond Vigilantes are penalizing (chart below) Takaichi’s administration for its spending habits, given plans of “investing more than ¥370 trillion ($2.3 trillion) in the 14-year period ending in March 2041, with ¥101.6 trillion earmarked for artificial intelligence and chips alone.”
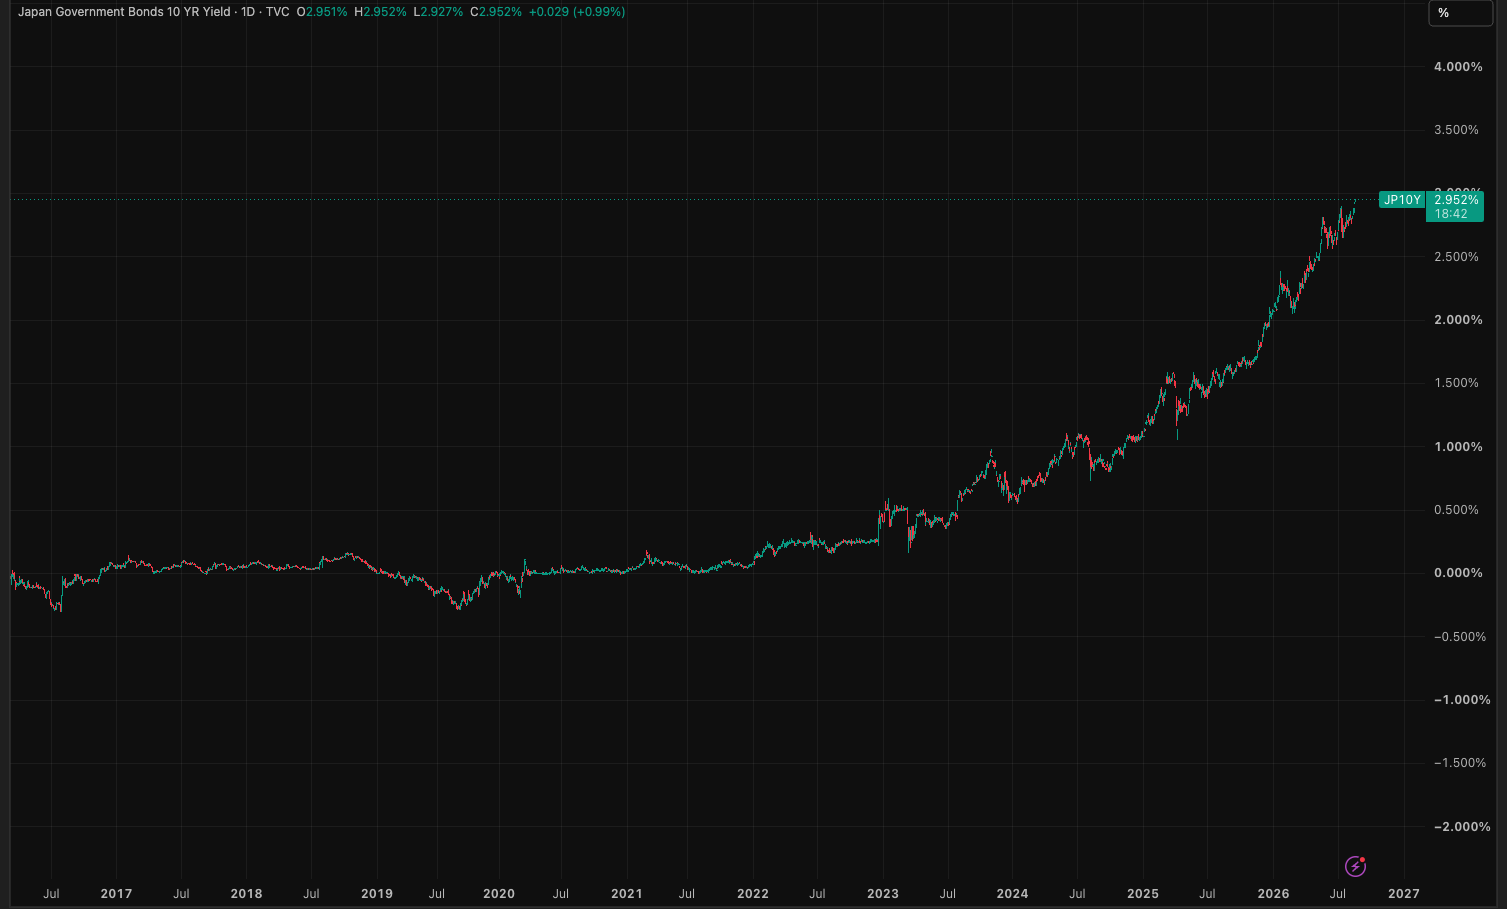
I sympathize with the Japanese government. Again, you either do this and pay a higher fiscal bill today, or risk not competing on the world stage in years to come.
So, what does this global competition lead to? Here’s a table from Apollo:
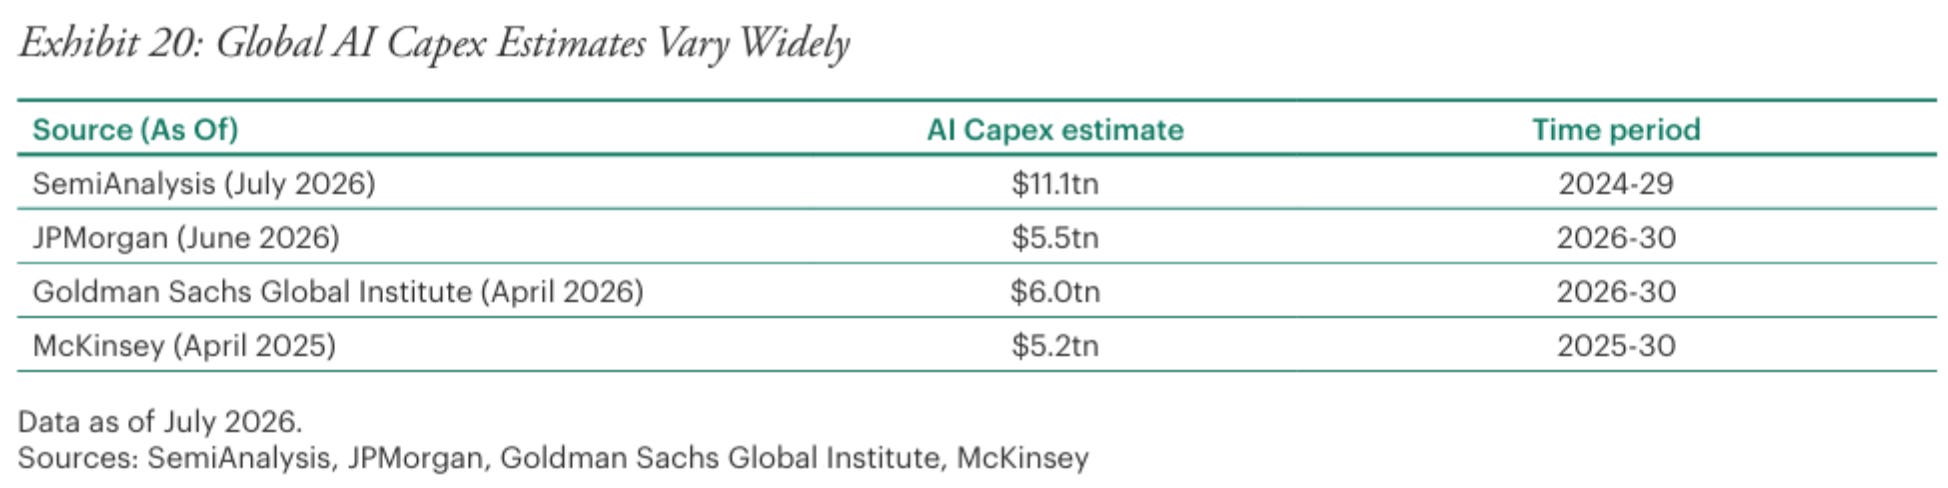
Global AI CapEx estimates range from $5.2T to $11.1T from 2026-2030. Let Claude put the midpoint ($8.15T) of this range into perspective real quick:
If you earned a dollar every second, day and night, you’d need some 250,000 years (and change) to get to $8.15T, which means you would have needed to start saving whilst in contact with the early anatomically modern humans, during the tool revolution.
Tool revolution…how ironic.
Anyway, my point here is that companies and nations have no choice but to compete. So, let’s look deeper into the financing needed to properly compete in this AI-led world.
According to SIFMA, gross IG issuance has reached around $1.68T so far in 2026:
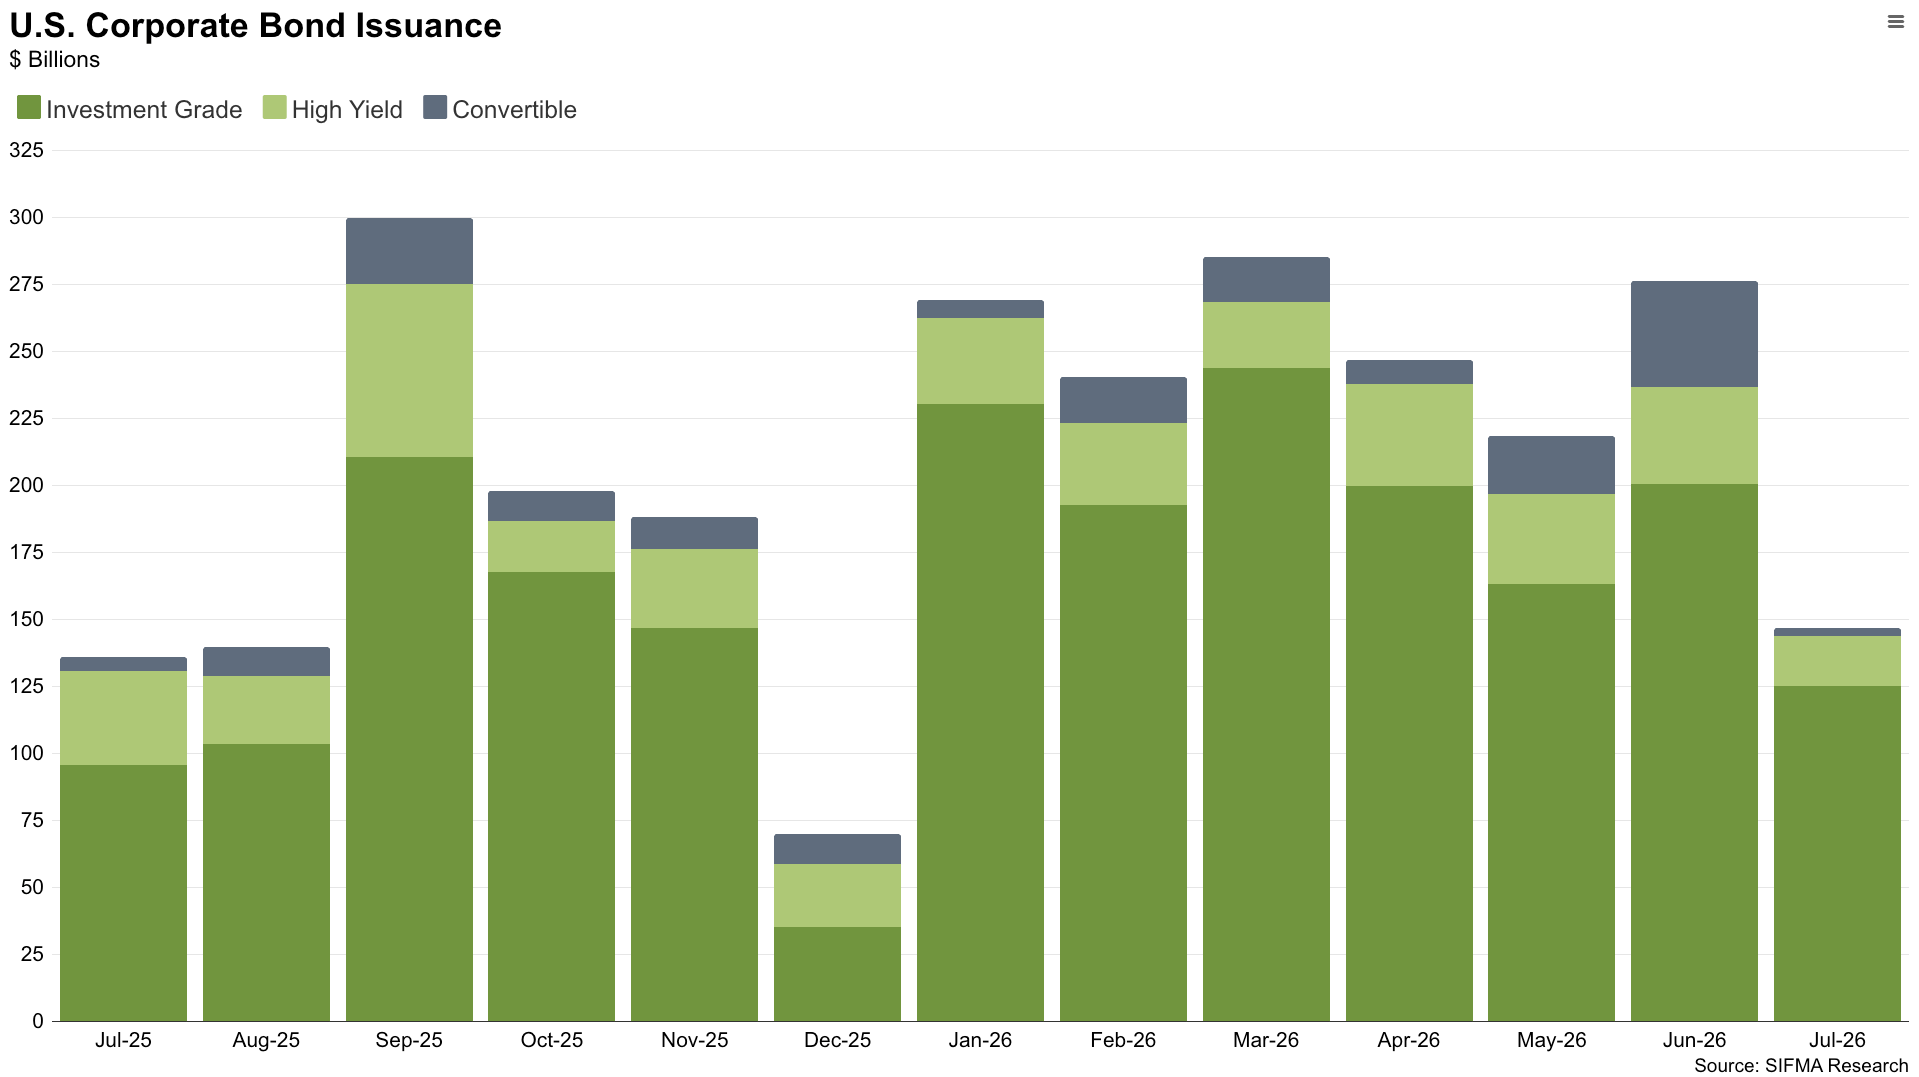
Net IG issuance lies at about $560B, of which Investment Grade (IG) AI debt makes up 30%+:
Which is a decently-sized piece of the IG pie, and growing. Tech now lies as the second largest sector in the IG market:
Which means top IG issuers are increasingly turning into tech companies. And this is just the IG market.
Another important portion of this AI financing wave comes from hyperscaler guarantees that do not live inside IG.
Think of it this way. If I, Augustine, came to you asking to borrow $200M to build a racetrack, you would probably tell me to F-off.
However, if I could prove to you that I signed a contract with Formula 1, where they will pay me $75M per year over the next 15 years for that racetrack, you’d probably ask me if I like sugar or cream in my coffee while I wait for you to get my loan’s paperwork ready.
I have de facto used F1’s better credit as my own backstop. What’s more, that loan won’t even show up on their books, even though I only got it because of them.
Now think of these transactions, but in AI. Here are some examples.
As a bitcoin-centric research firm, bitcoin mining company TeraWulf immediately comes to mind. They recently announced a deal with Anthropic:
“TeraWulf has entered into a 20-year lease agreement with Anthropic for a purpose-built AI infrastructure campus at the Justified Data site in Hawesville, Kentucky. The campus will accommodate approximately 401 MW of critical IT load and will be developed in multiple phases. Initial capacity is expected to be placed into service during the second half of 2027, with the campus ramping to the full 401 MW by early 2028. The lease is expected to generate approximately $19 billion of contracted lease revenue over the initial term and is expected to be supported by an investment-grade credit.”
Once it locked in this 20-year lease revenue, TeraWulf turned around and hit credit markets…
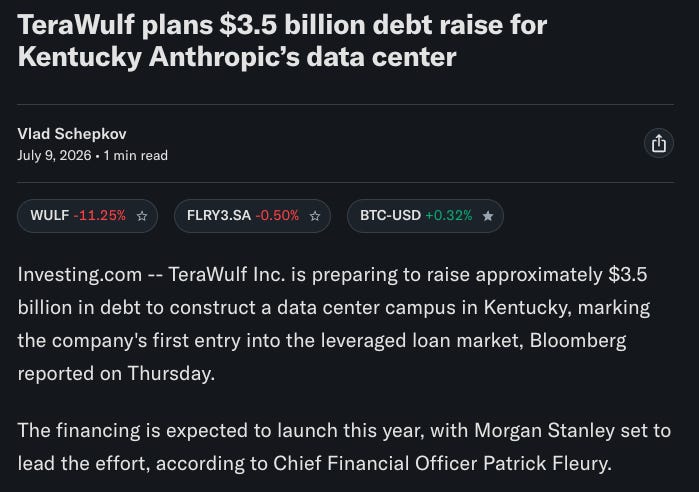
In short, Anthropic secures data center infrastructure while TeraWulf secures its financing without a single shovel even hitting the ground. I wonder what a REIT analyst thinks about all this…
On October 2025, VoltaGrid announced its power-providing collaboration with Oracle:
VoltaGrid LLC will deploy 2,300 megawatts (MW) of cutting-edge, ultra-low-emissions infrastructure, supplied by Energy Transfer’s pipeline network, to support the energy demands of Oracle Cloud Infrastructure’s (OCI) next-generation artificial intelligence (AI) data centers.

With power demand (sales) effectively secured by Oracle, guess what VoltaGrid was able to do in November 2025…
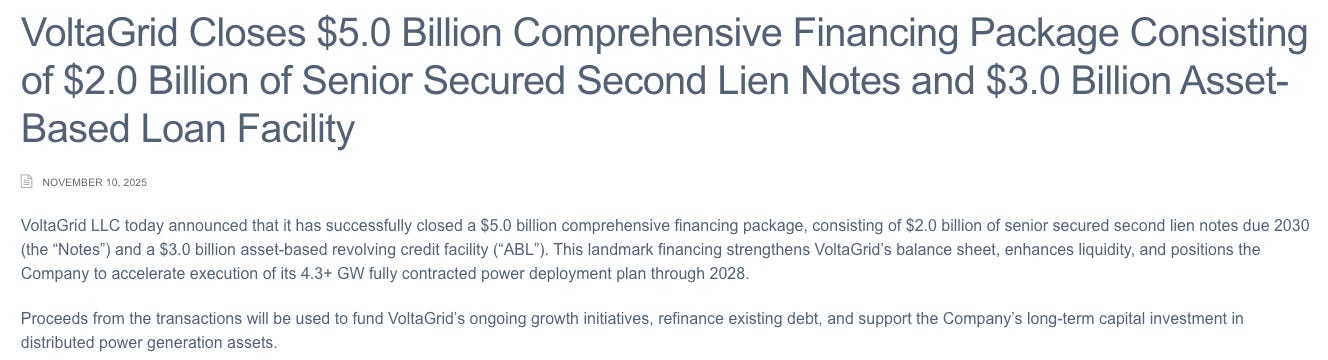
That’s right: they turn around and borrow once they have secured a long-term client for their power.
Stories like these go on and on, showcasing how the decent credit scores of Tech Giants are ultimately bleeding into financing contracts of other smaller companies. Good credit holders helping others with not-so-good credit finance their own CapEx…talk about circular credit expansion and “Too Big to Fail.”
All this debt supply in the name of growth and competition…but how has all this issuance been received so far?
Despite all of this hyperscaler debt issuance (and its smaller-company trickle-down effects), credit spreads across risk brackets remain low (chart below):
In IG alone, spreads are the tightest they have been in 28 years:
At the same time, we see the yield on the most Fed-sensitive coupon (2-year UST) somewhere around its 73rd percentile. Seeing yields above their historical average, and spreads below theirs, suggests that markets WANT to digest all this debt:
Let me elaborate. Back in 2021, yields were on the floor (ZIRP), effectively pushing investors into IG because corporate debt at least paid something. Today, taking on credit debt genuinely pays you a decent amount given the risk-free base is somewhere between 4-5% without the spread, thereby pulling investors into IG:
Simply put, in 2021, IG investors bought corporate bonds because they had nowhere else to go. Today, IG investors buy corporate bonds because they actually pay a decent yield, regardless of the tight credit spread.
If you zoom out, though, you see a similar scenario back in 2007:
Although this brings up some PTSD, there’s nothing necessarily predictive about this combination of factors. Plus, markets are completely different today than back then (both from an investor sense, and a regulatory sense).
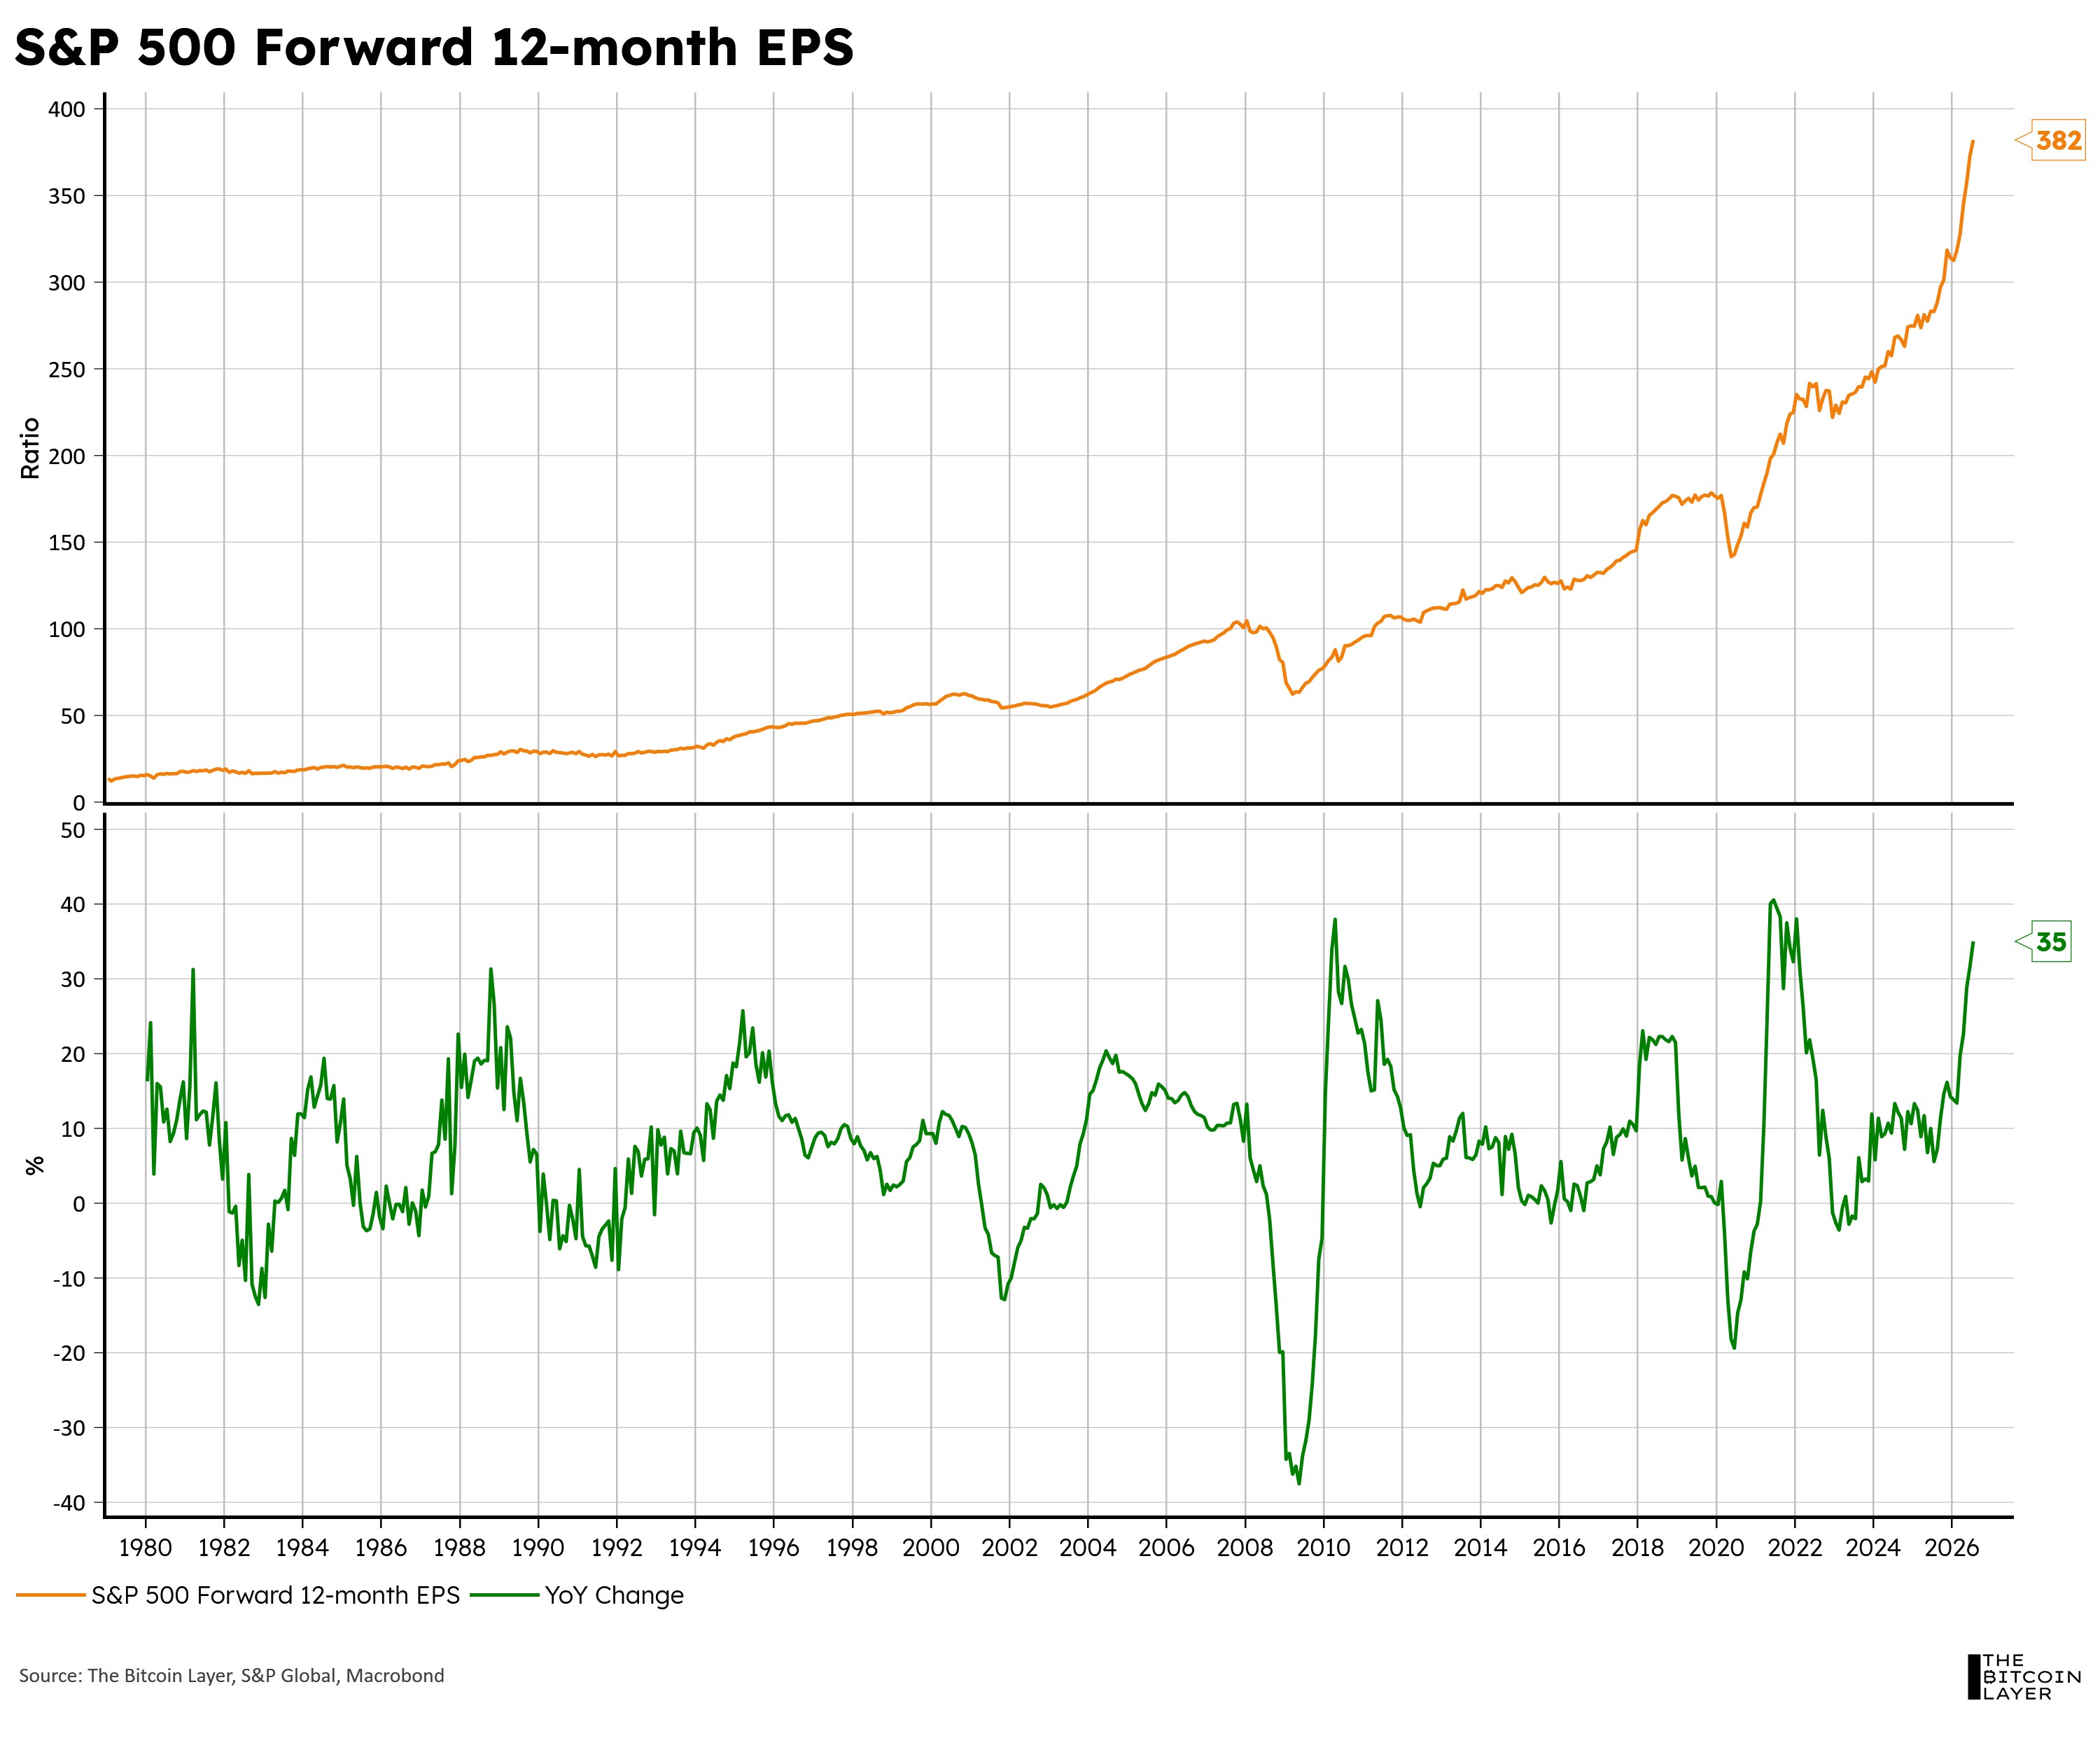
All this debt has fundamental strength today, and fundamental expected strength in the future. Earnings today continue beating expectations, while forward earnings remain on the rise (chart below):
Profitability-to-debt metrics also look fairly stable:
Higher than pre-2020 still, but we are in completely different times.
This strength has led US IG Corporate Bond upgrades to exceed downgrades by 3:1 during the second quarter of 2026.
All this strength, alongside lower spreads, tells me that the market is not struggling to absorb corporate debt (at least not yet). Not to mention the fact that these companies are not investing all this money just for the hell of it. They expect operational cash flows soon, which eases the need for financing.
In summary, AI issuance may not be crowding out US Treasuries as much as one would expect.
My biggest takeaway is this: the supply of IG issuance has (so far) had no trouble being absorbed by demand in the market, which leads me to fade the increasingly popular crowding-out effect on the US Treasury market. I am not saying the headwind doesn’t exist, but I question how influential this has been for the bear in the backend of the UST yield curve given other factors currently in the picture.
IG issuance just doesn’t strike me as the marginal driver of the long-end. I think it all boils down to macro (war in the Middle East, growth from all this CapEx, inflation expectations, lack of Fed forward guidance, etc.), which is why Bessent’s tools have such a prominent effect on UST price movements—at least more so than companies announcing more debt issuance. Bessent (and what he is looking at) matters a lot more than AI for US rates. And his job right now is to sell UST puts. A Treasury put comes in many shapes and sizes. Buybacks may be insignificant in the grand scheme of things, but Treasury guidance can redistribute outcomes (a kind of put).
All of this matters from a TBL Liquidity perspective. If you pin down UST market expectations, you lower volatility. With lower volatility, you make collateral more reliable. Make collateral more reliable, and you get a higher collateral multiplier, which expands the ability to lend off the backs of the current supply of Treasuries, which expands credit and Liquidity.
So, in a way, the US Treasury is selling both UST price level puts, AND volatility puts.
The question is ultimately whether the US Treasury (and government) can help the US economy grow fast while maintaining Treasury market vol and rates contained or at a ‘healthy’ growth rate?
If you liked this article, it would help a lot if you gave it a like or a share, as that is a signal to us to keep writing content like this.
Nik’s letter went out on Tuesday;
Johan’s letter went out on Wednesday; and,
Nik’s Macro Video update went out on Thursday.
On Wednesday, Nik analyzed the latest on the US Treasury:
On Friday, he discussed bitcoin’s latest uptick alongside gold:
Disclaimer
The TBL Model Portfolio, TBL Liquidity Indicator, and all TBL research outputs reflect Nik Bhatia and team’s analytical positioning for the macro and bitcoin environment. They are published for educational purposes only and are not investment advice, not a solicitation to buy or sell securities, and not a recommendation tailored to any individual’s portfolio. The Bitcoin Layer is not a registered investment advisor and does not manage client money. Please consult a professional financial advisor and conduct independent due diligence before making investment decisions.
Comments
Nothing yet. Say the first thing.
Sign in to join the conversation.