

You can also get access to our charts and data inside our TBL Pulse Dashboard:

Dear Readers,
Before we get into the US rates and FOMC section of this article (and my case for no hikes in 2026), I thought it’d be appropriate to send what we know at this time about the COLDCARD situation, as well as Japan’s recent developments.
Still too new to be officially reporting on it; we are also trying to understand what’s going on exactly, but here are our initial thoughts in video form for you to listen to:
As well as a very informative piece from our friends over at Checkonchain:
Have a look at the yen against the greenback as of Friday afternoon EST:
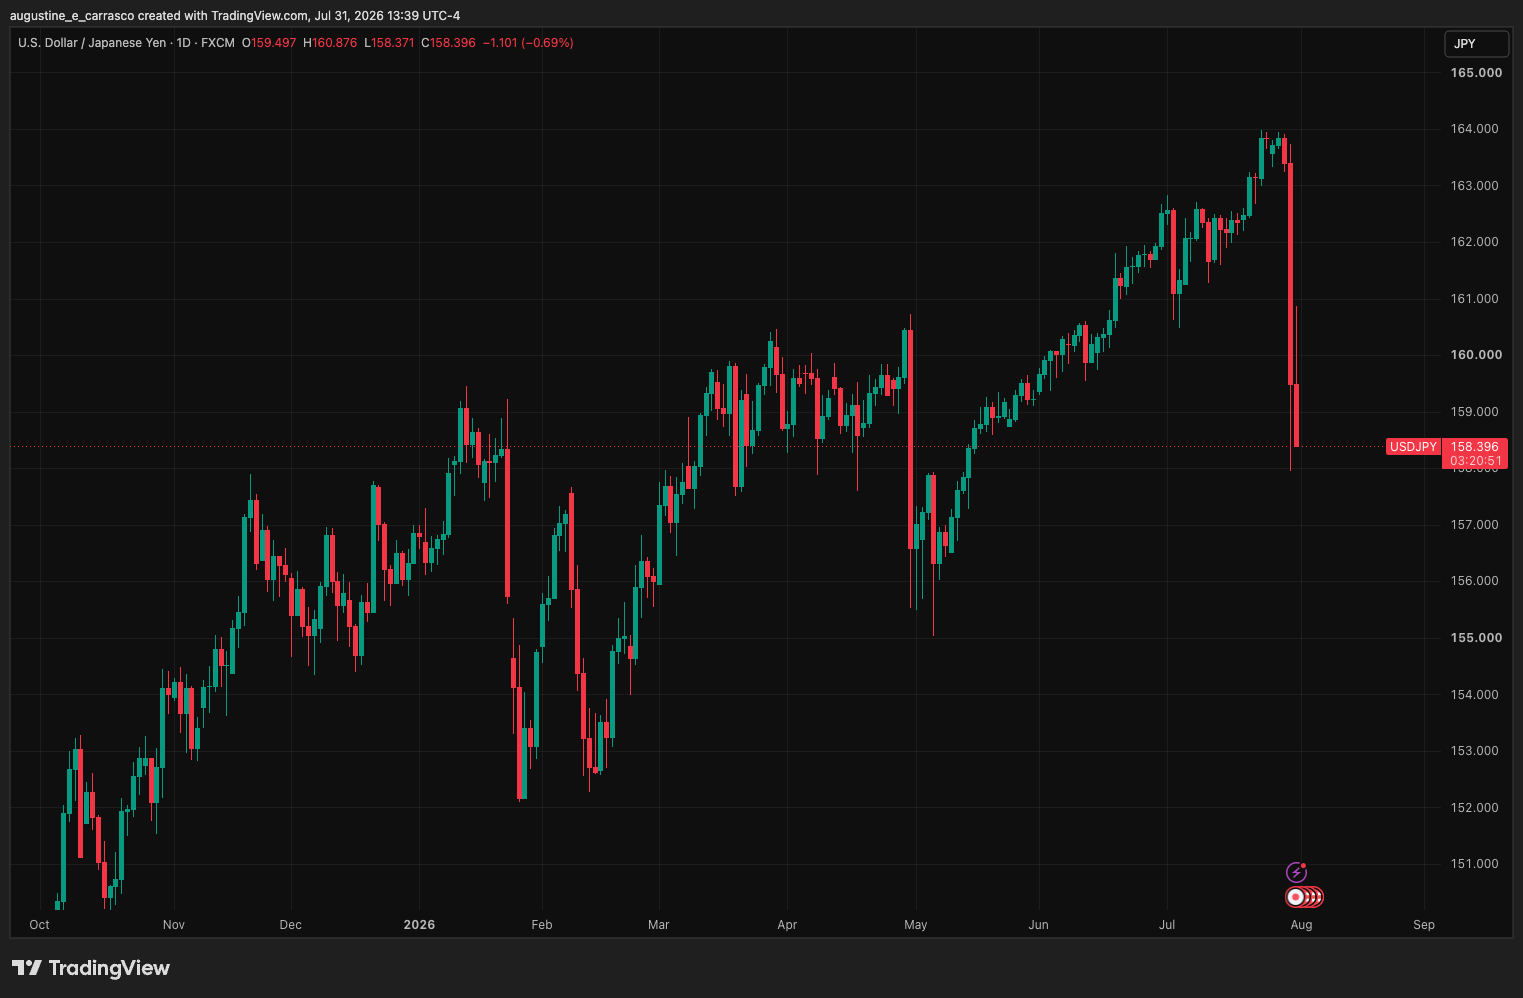
Given yen weakness, Vol Secretary Scott Bessent intervened in FX markets, as he deemed the yen to be “undervalued.”
On Bessent’s to-do list: “Buy Japanese Yen $5-10B.” Bessent wants to intervene because Japan is America’s largest lender:
To defend its own currency, Japan can sell reserve assets like US Treasuries or dollars in an effort to prop up the value of the Japanese yen. This can create unwanted vol in Treasury markets, and unwanted higher rates overall. So, the US Treasury has the incentive to intervene.
The BoJ confirmed a yen intervention on Thursday via a sale of US dollars. Also confirmed is the fact that the US conducted a “rate check,” wherein US officials call different financial institutions to ask for current spreads on FX.
The New York Fed, on behalf of the US Treasury, sold euros to buy yen. “At least two major US banks were asked by the New York Fed to check the rate on the yen against the euro during the day, two people familiar with the matter told Bloomberg.”
The Secretary of Vol is back at it again…
This past week, there was a lot of talk about real and nominal yields following the FOMC presser, so I thought it would be a good idea to get some clarity on US rates’ mechanics (for your reading sake, and mine…).
American economist from the late 19th and early 20th century, Irving Fisher, is responsible for a formula that all finance professionals and hobbyists have come across:
(1+i) = (1+r)(1+𝝅)
Wherein i means nominal rates, r equals real rates, and 𝝅 equals inflation. Rearranged and expressed in simpler terms, a good approximate for the equation above is:
Real rate = Nominal rate - Inflation rate
This is a simple concept that financial markets price every single day in real time. Investors have direct, tradable access to nominal and real rates through regular US Treasuries and Treasury Inflation-Protected Securities (TIPS), respectively. The inflation rate (otherwise known as the ‘breakeven’ rate) is inferred from where the other two stand. Let’s dive into it…
US rates junkies can attest to the fact that TIPS are fascinating (although the purity of strip bonds is probably higher up on the list of fascinating things in fixed income…but I digress).
TIPS are fascinating not only because they protect from inflation (specifically CPI, which I understand is not the best measure), but also because, in doing so, its rate prices in expectations of economic growth.
If the economy is hot, it takes a lot more convincing to lock TIPS investors into a 5- or 10-year note…there’s simply higher yielding opportunities elsewhere, meaning real (TIPS) rates must rise.
I’m sure many of you know how they work, but just to hammer the dynamics down, say you invested $1000 into a 1-year inflation-protected Treasury (which do not exist on-the-run, but just make for an easier example). Say it offers an annual coupon rate of 2%.
Fast-forward one year, say inflation was 3%. At the end of the year, your principal would have appreciated by 3% to $1030 (from inflation adjustments), and you’d have received a coupon payment of 2% on top of that, leaving you at $1030 + $20.60 = $1050.60.
Just like that, you adjust your return for inflation, and get paid on top of it.
A regular one-year Treasury, unlike TIPS, doesn’t make that adjustment, so a $1000 one-year Treasury bill paying 4% at the end of that same year would have returned $40, of which $30 go back into paying for 3% inflation that year, while the remaining $10 (or 1%) is your real return.
Using Fisher’s equation at the start of that year in the example above, the market was telling us that it expected inflation to be 2% over that year:
Real rate = Nominal rate - Inflation rate
2% = 4% - breakeven (inflation) rate
But it was wrong. Inflation ended up being 3%, and regular US Treasury buyers paid the price.
Currently, the US 10-year yield is at 4.68% and the 10-year TIPS yield is at 2.41%, leaving the breakeven rate at 2.27% (using Fisher’s formula):
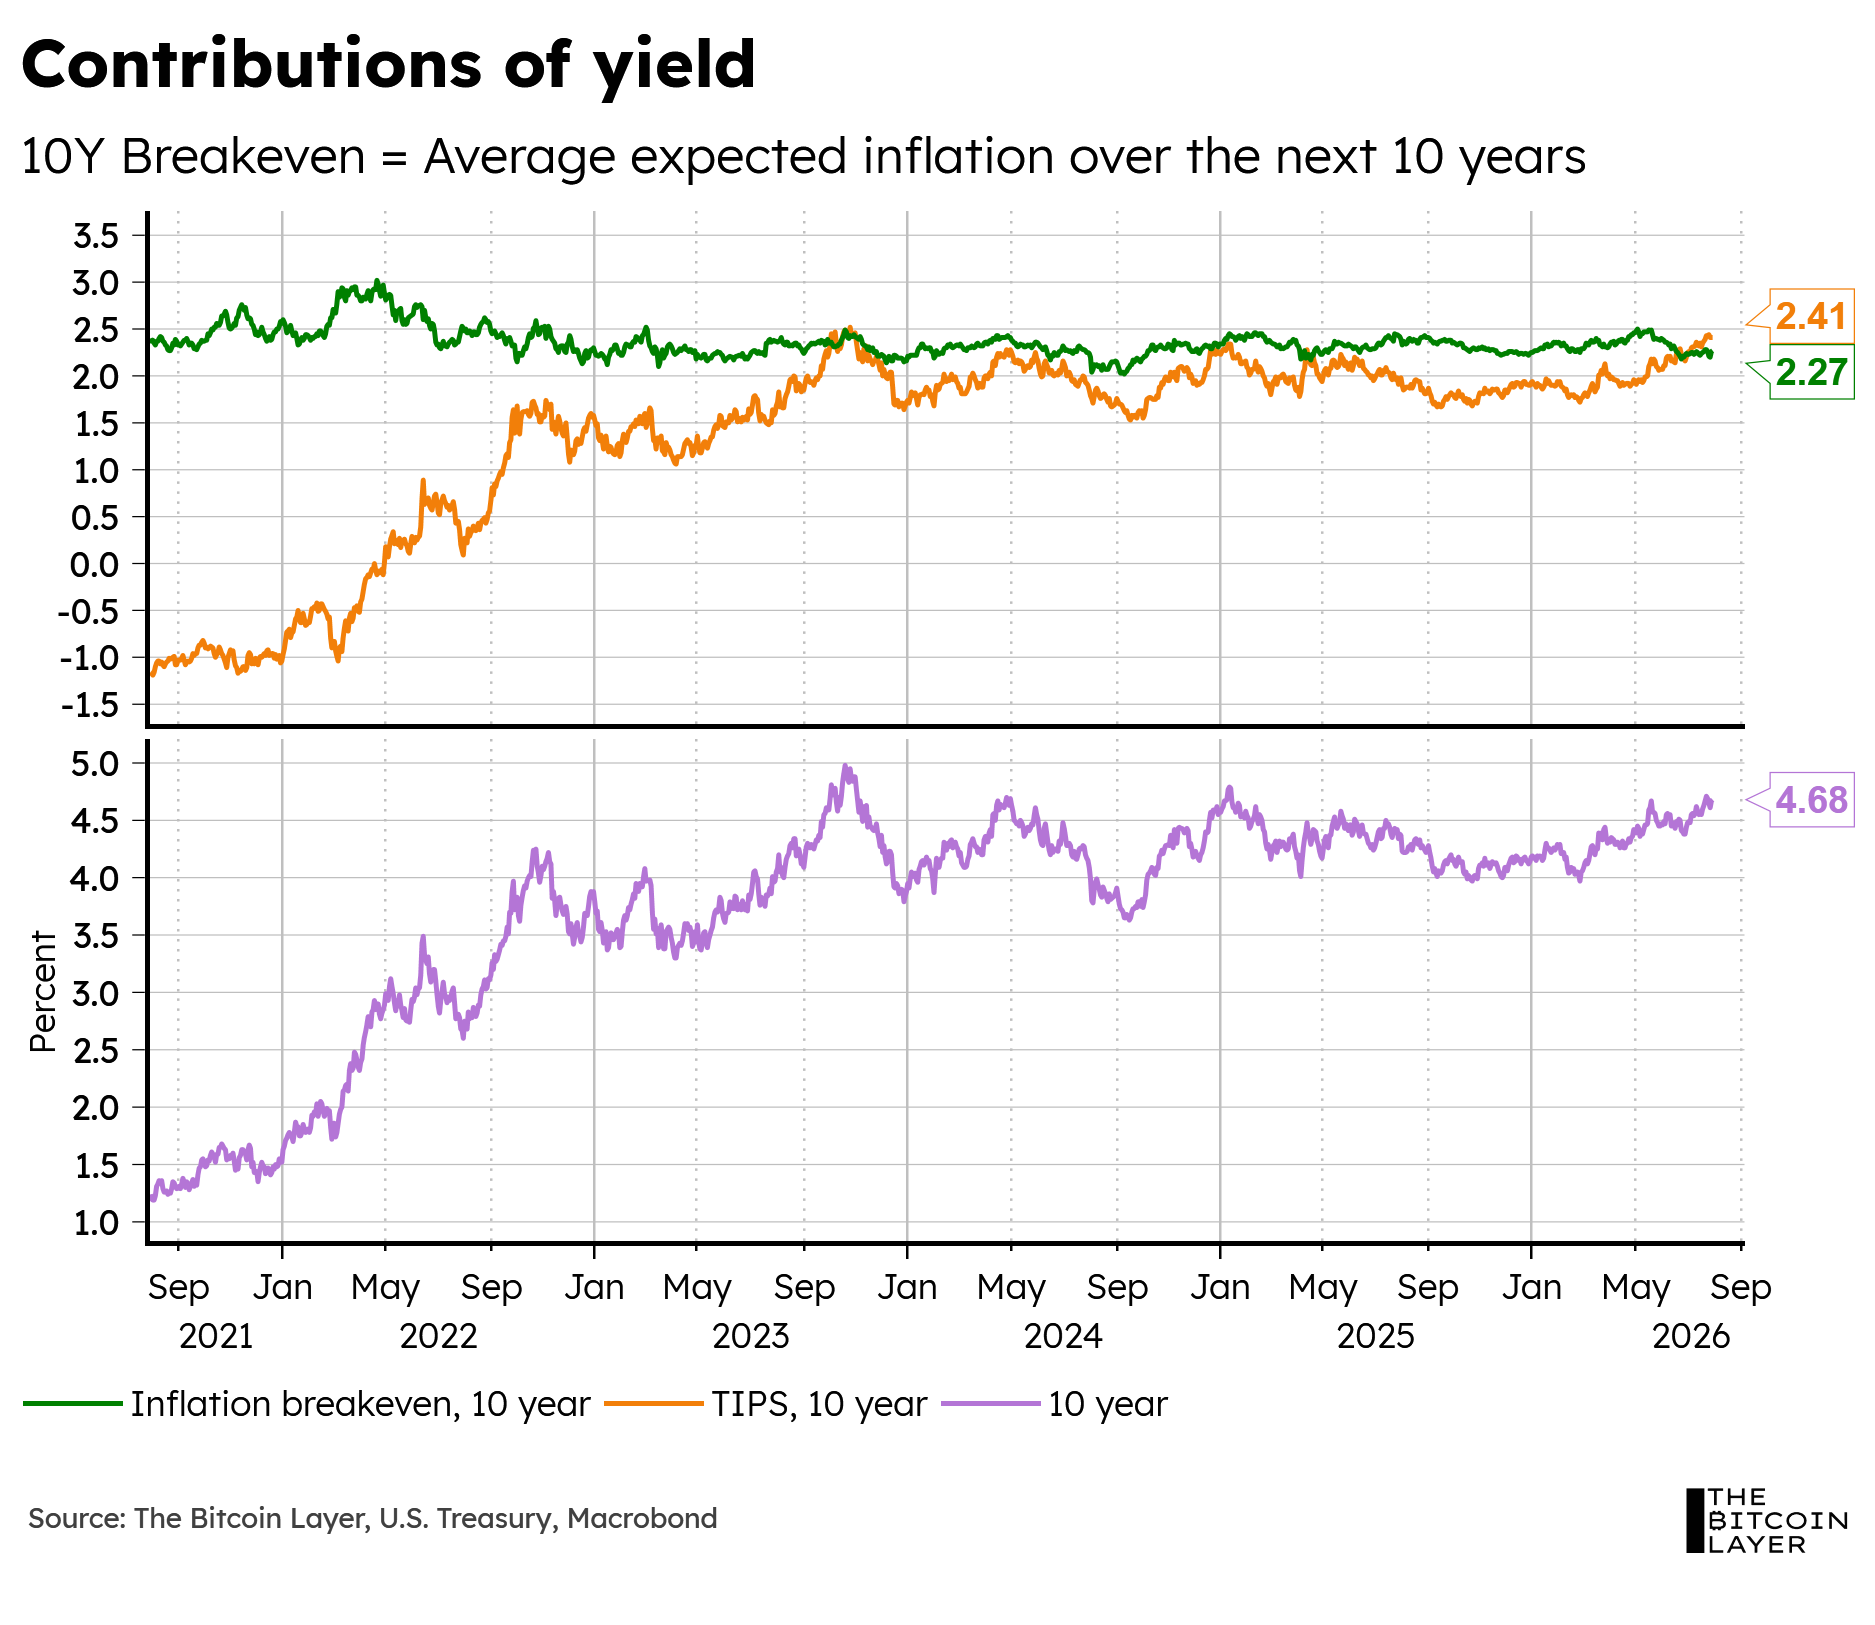
The market expects inflation to average around 2.27% annually over the next decade. Global Macro Director at Fidelity, Jurrien Trimmer, had this to say about these yields in a recent letter:
“The rise in yields last week was on both the nominal and real side, with the inflation breakeven staying put at around 2.3%. The 10-year real yield is now a generous 2.43%, which in my view is a better value than the 4.7% nominal yield.”
The statement is inherently bullish on inflation if he sees better value in a 2.43% real yield. If inflation over the next decade averages a higher rate than 2.27%, then Trimmer would be correct. The higher the inflation, the more nominal yield on regular US10s gets eaten up, and the lower the real return on them. Meanwhile, 10-year TIPS pay a real 2.27%, regardless of inflation.
During his press conference, Warsh made a few things clear despite saying practically “nothing.” First, real yields are rising because of AI-led investment and growth (something we’ve been talking about for quite some time here at TBL). Next, he’s kind of happy that the rates market is doing his “material tightening” for him (?). I’m not kidding, he literally said the economy, CapEx, and labor market are all solid, and the Treasury market is saying that same thing using nominal and real yields.
Here’s where I start to deviate from others, and where I expect to lose some folks, but bear with me. Personally, I err on the side of caution when it comes to a hike in 2026, despite what markets are saying (and it really seems as though I am alone here). Many argue that Warsh’s reputation is at stake. Not going (hiking) could be the difference between getting ahead of inflation or not. Inflation appears to be their sole concern given relatively strong employment numbers, but here’s how I see it in the medium term…which could be considered somewhat bullish for US Treasuries (again, bear with me here):
As of late, inflation has been sensitive to the energy shocks from the war; however, I personally fade this narrative as a one-time hit in an otherwise “okay” inflationary backdrop (in the same way that many faded tariffs as one-time shocks).
Yes, I agree there is AI-driven inflationary pressures, and we have also been over the 2% target for quite some time now, but let me present my next, and perhaps most important point to my argument…
I am certainly not bearish on the US economy (that has proven to be a widow-making trade so far in the Roaring 2020s), but I am cautiously bullish. On January 14th of this year, I wrote the following:
“Looking ahead, we see two big tailwinds in 2026 for the largest sector in the US economy (services): (1) continued AI investment, as well as (2) some momentary growth tailwinds (spending) coming from the FIFA World Cup 2026. [...] Lastly, Trump’s Big Beautiful Bill has tax advantages for the US that will be stimulative for the overall economy.”
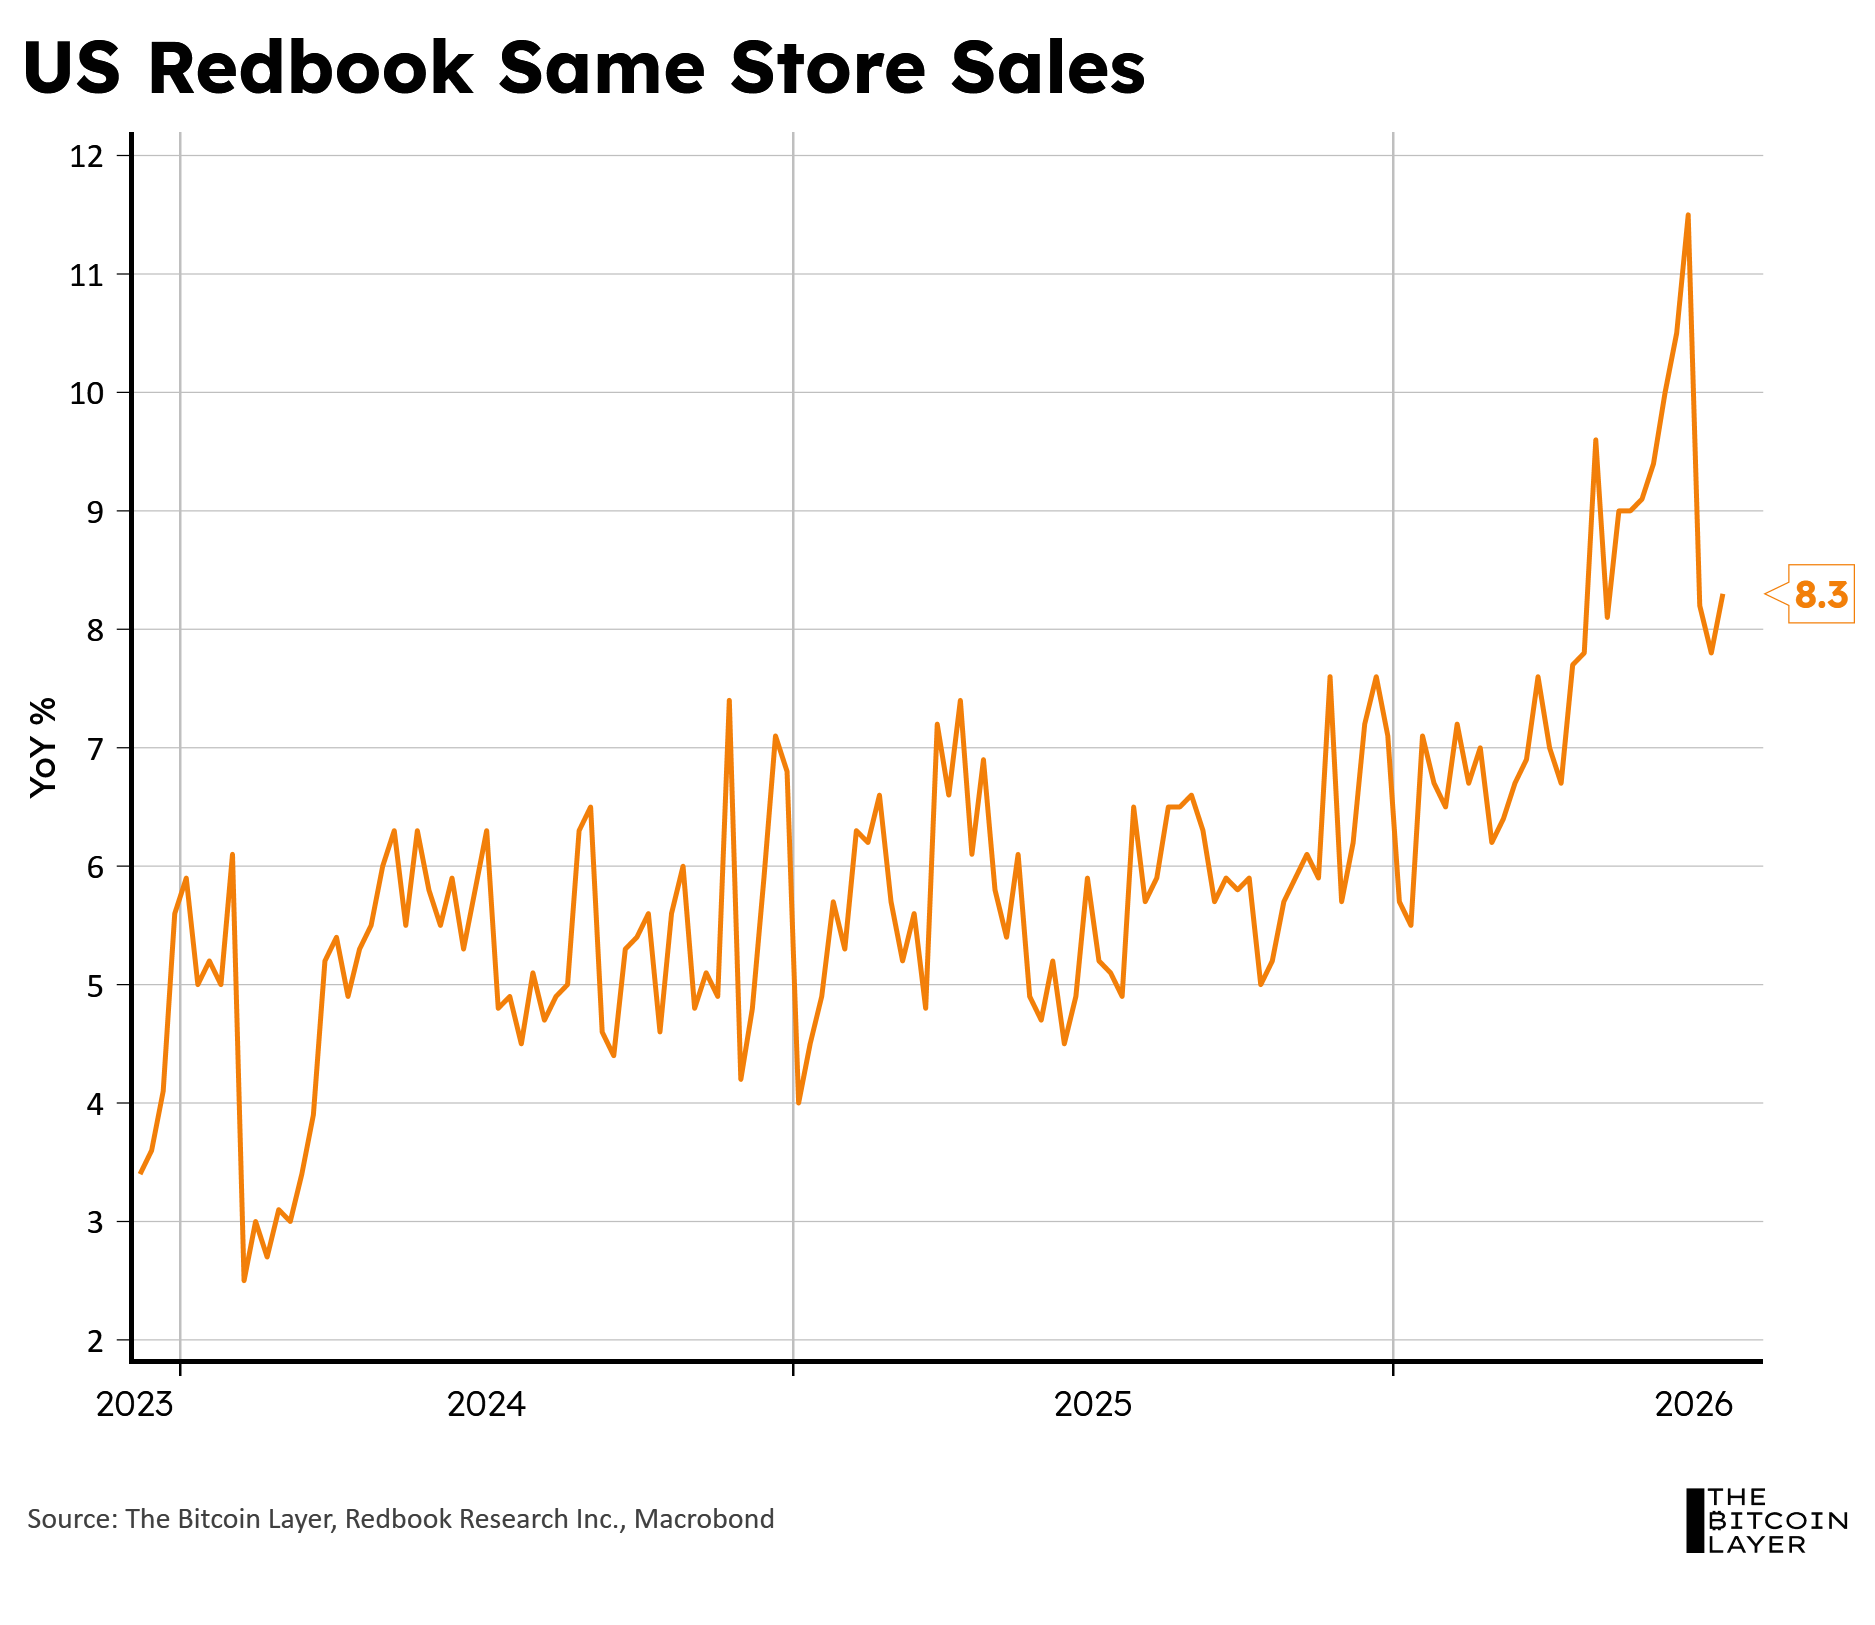
So far, the outlook has played out. Consumers spent well during the World Cup, as reflected by Redbook Same-Store Retail Sales, a “weekly index measures the percentage change in sales at stores that have been open for at least a year:”
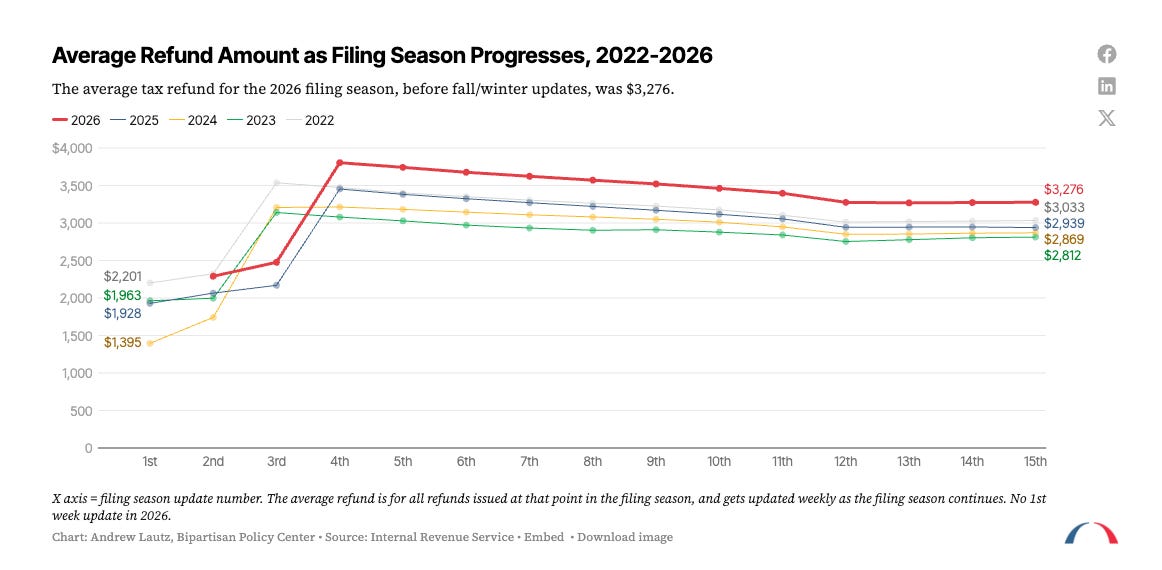
And thanks to Trump’s OBBB, we just had the largest average tax refund year since 2022:
But the World Cup is over, tax filing season is done, and savings are falling:
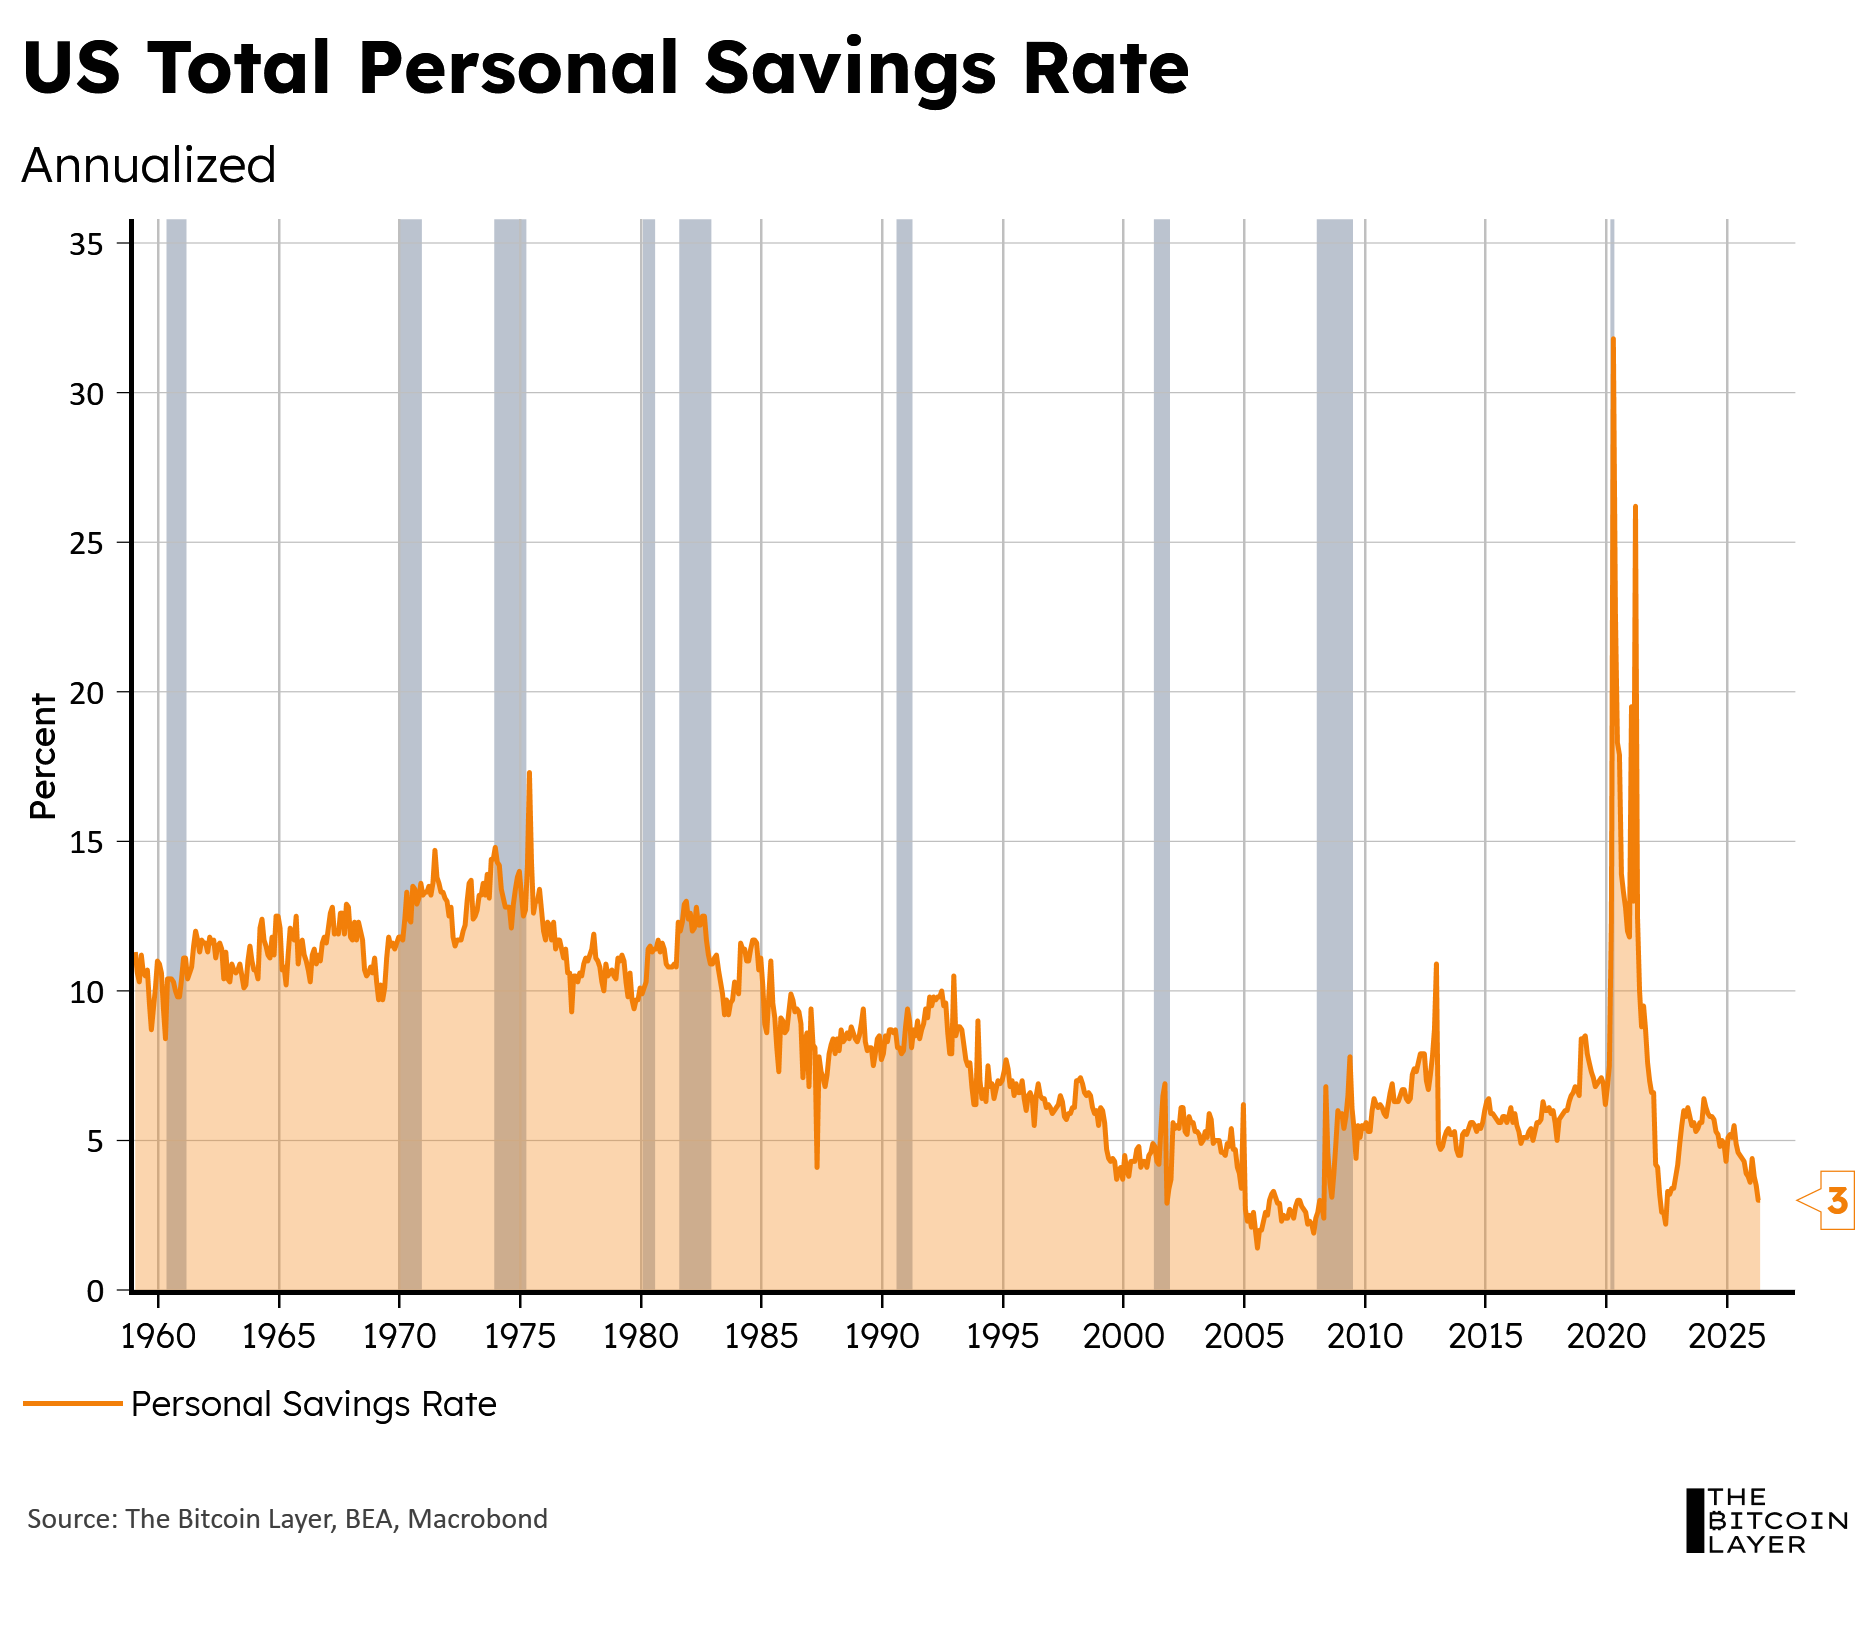
Remember how everyone was worried about a K-shaped economy at the start of the year? Well, I don’t necessarily believe that narrative is gone. It hid underneath bigger headlines and spending events, but it’s not gone.
So, although the Fed is not necessarily worried about the labor market, I do believe labor and spending will mutually face more headwinds in 2H26 than they did in 1H26.
If the Fed hikes, a 25bps increase seldom does much to combat inflation meaningfully. It would need to go a few more times for inflation to feel a tickle. But hiking 50-75 bps bps against a spending/labor market backdrop that could be slower in the near future risks damaging spending and labor even further.
I personally stand by not hiking in 2026. I know I’m probably alone here, but I truly think it takes one bad employment or spending print to send shivers down a hawk’s spine.
There’s also one chart making the rounds, and that is the 30-year yield chart, now at levels not seen since the GFC:
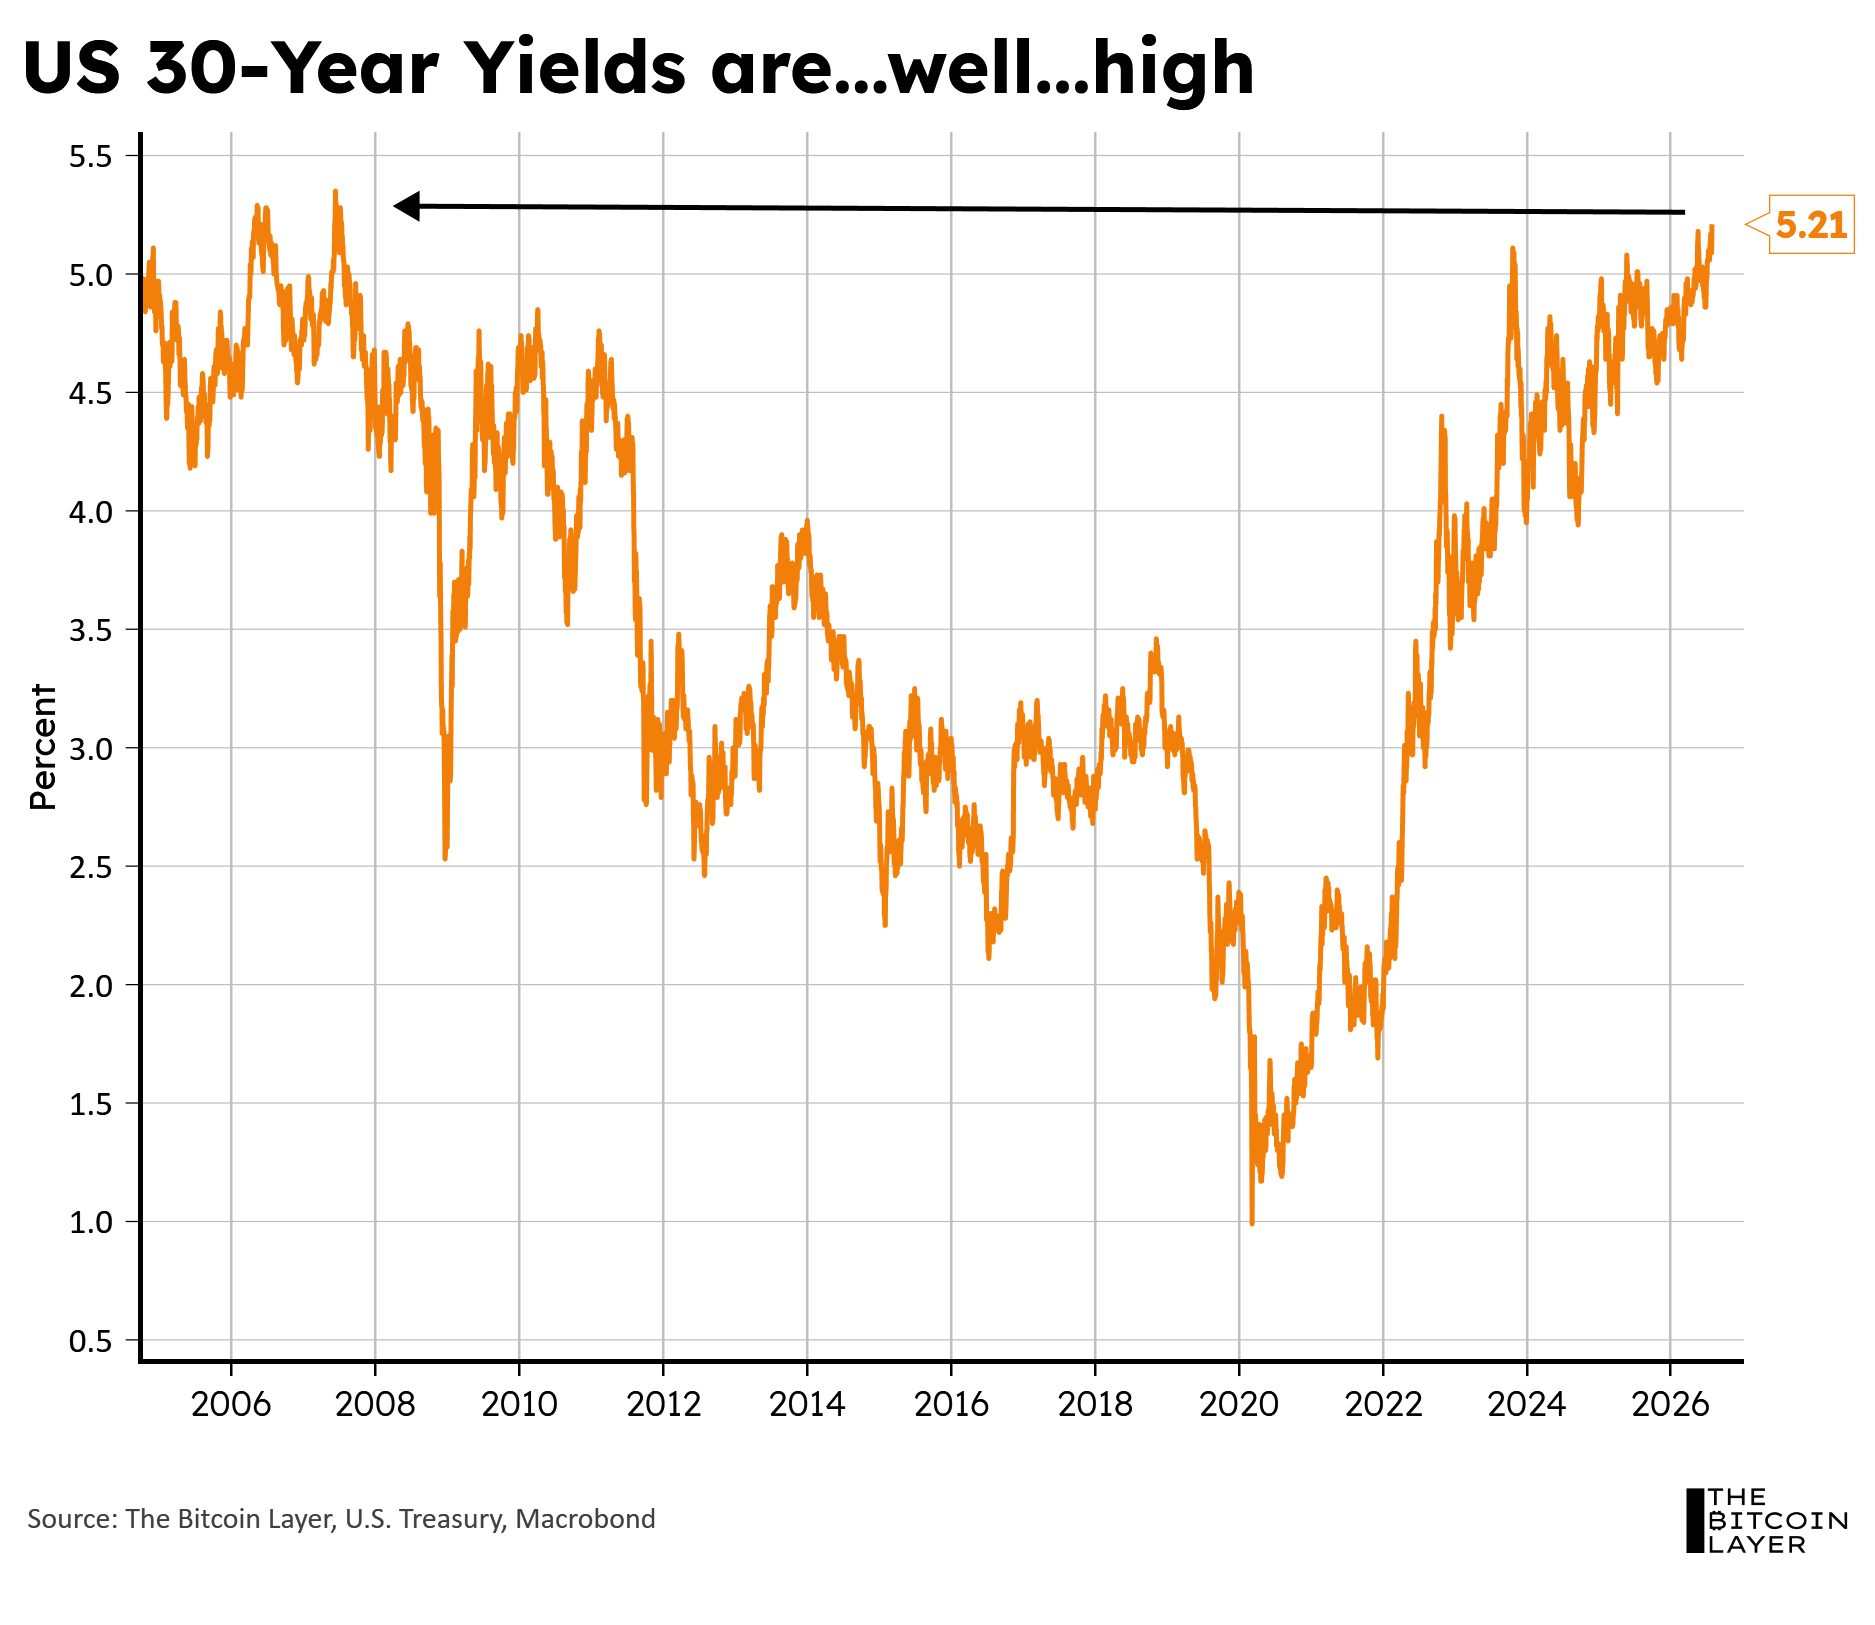
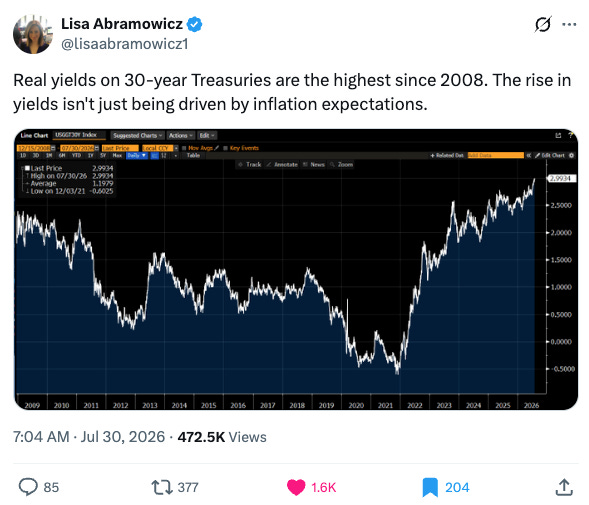
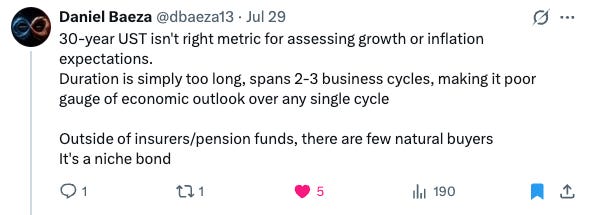
I’ve grown more wary over the years about what the 30-year yield is telling us about today’s inflationary outlook. Many were quick to jump on X and argue that the bond market is telling the Fed to hike due to inflation, but a 30-year instrument is simply too far removed from today to tell us anything meaningful about inflation today (in my opinion). Yes, an inflation outlook is traditionally built into it, but the further the forecast (i.e., the longer the maturity of a Treasury), the more room for error. Here are a couple of tweets I really enjoyed this past week to drive the point home:
Let me elaborate less cryptically. During the press conference, Warsh said:
“If, as the Fed has long held, interest rate policy should be its primary monetary policy instrument, how much accommodation are we getting from the balance sheet?”
In non-Fed talk, if their short-term policy rates are held high to fight inflation, but the Fed’s balance sheet is still skewed toward long-dated securities (MBS/USTs), then long-term credit conditions are still ‘artificially’ loose. Two opposing forces are at work.
So, the market looks at this statement, digests it, and thinks:
“Well, if Warsh is still thinking about bringing down the weighted-average maturity of its SOMA holdings (i.e., holding less long-term Treasuries), then perhaps the long-end of the yield curve has to be repriced higher given less expected artificial suppression from the Fed.”
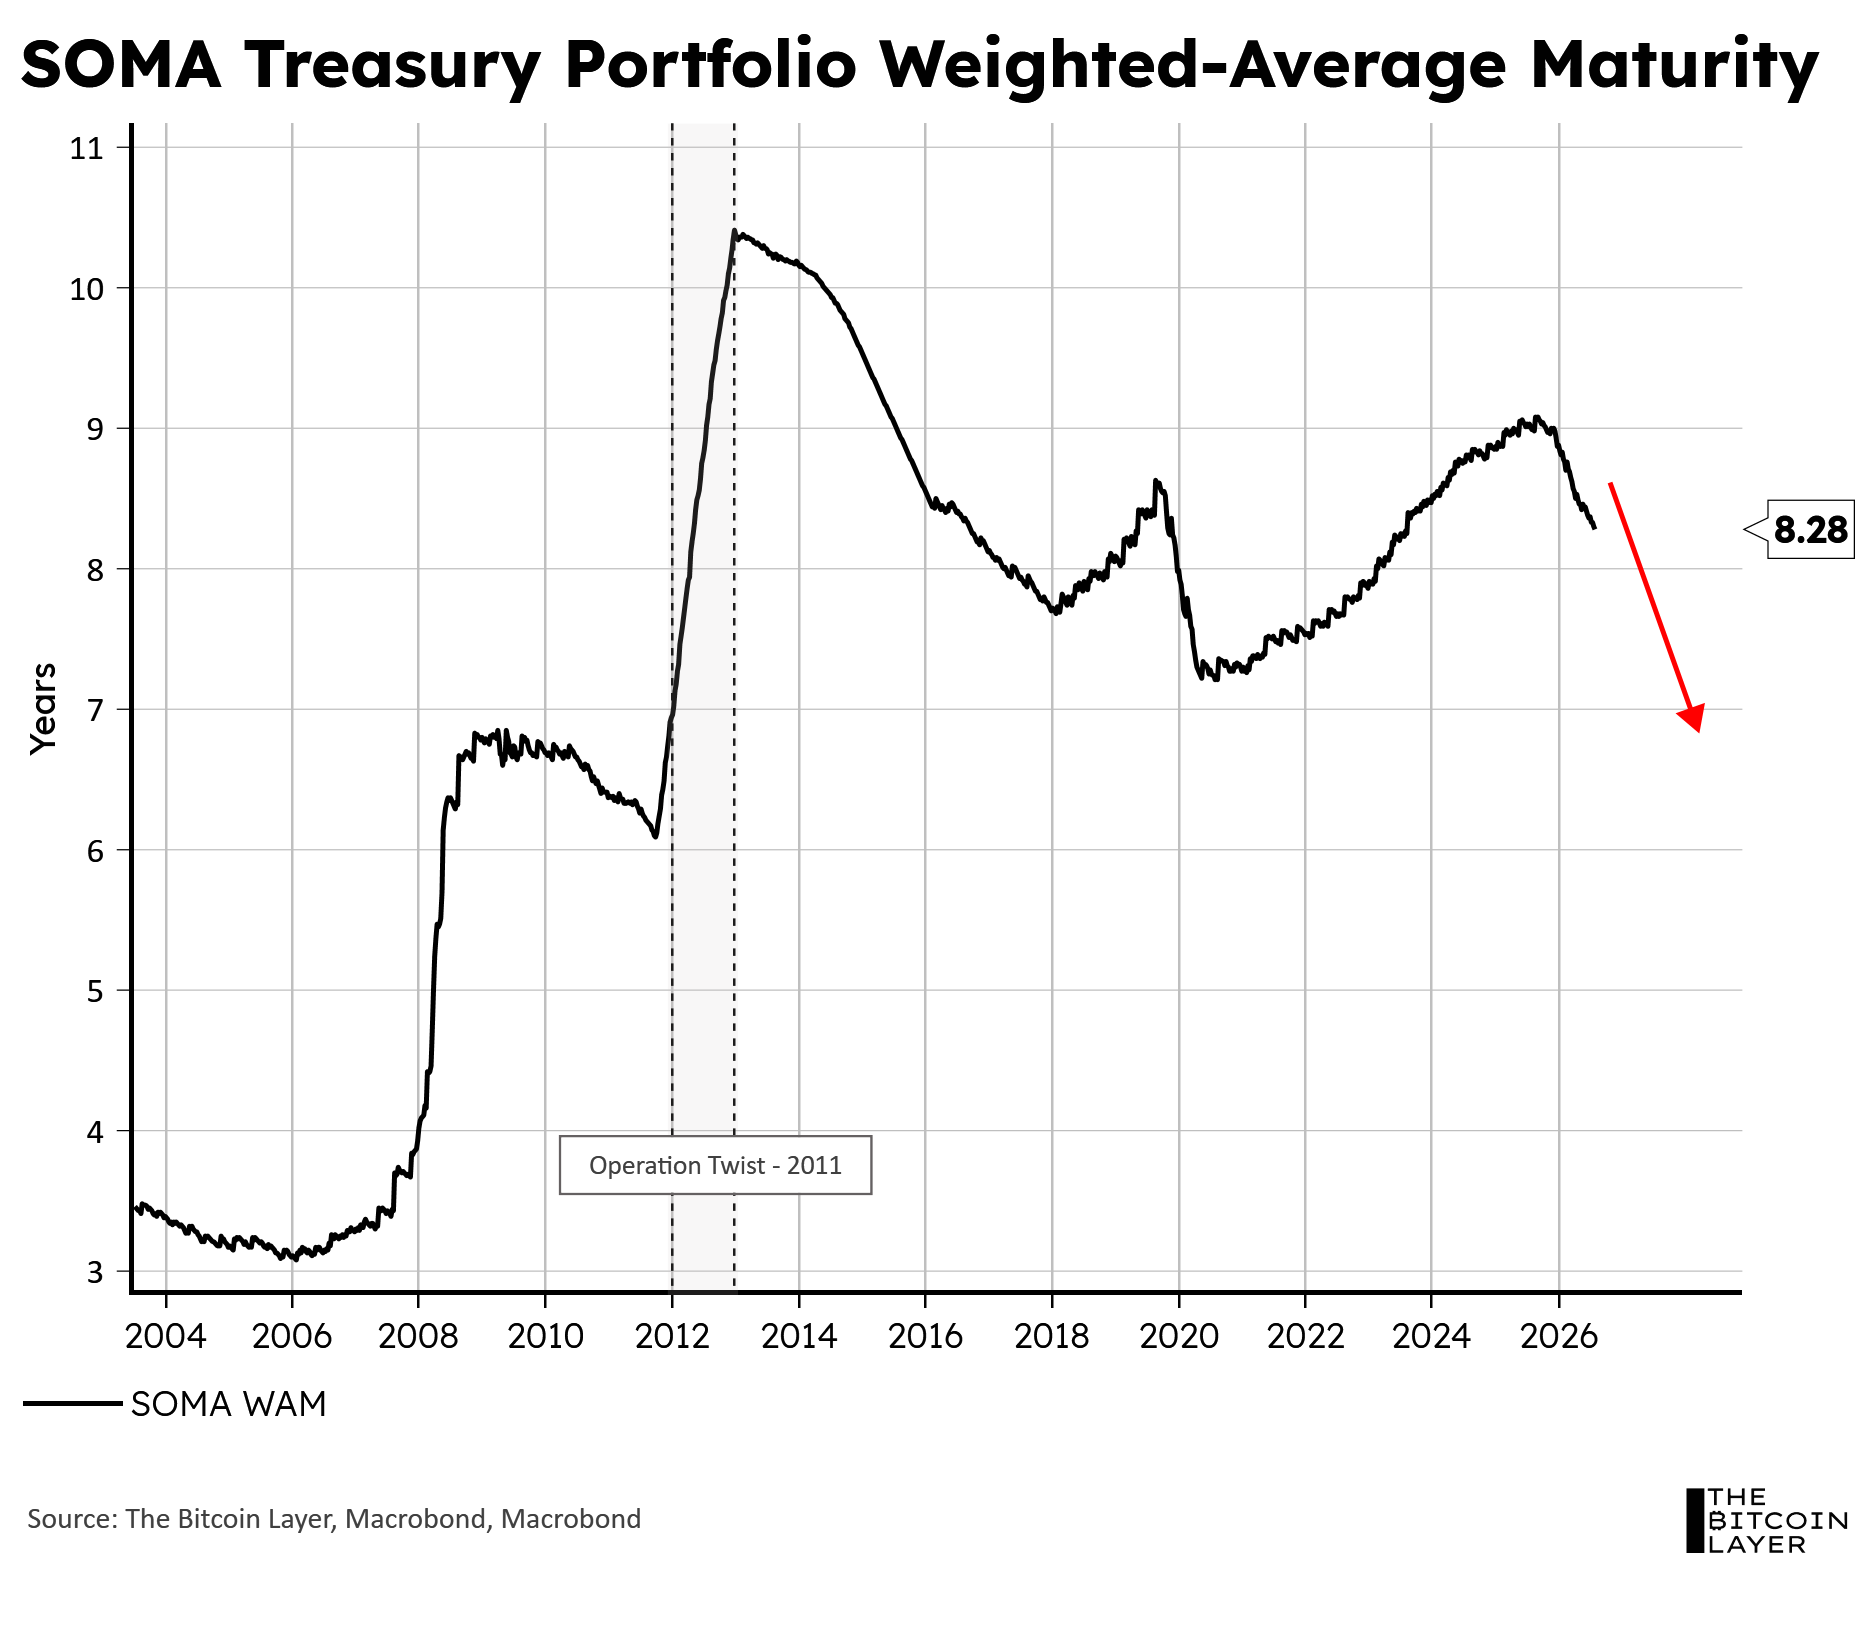
So, the long-end shoots up, and not just because of these “inflation expectations.”
Nik’s letter went out on Tuesday;
Johan’s weekly letter went out on Wednesday; and,
Nik’s global macro update video went out on Friday.
Nik’s interview with Matt Dines on energy markets went out on Tuesday:
Nik’s FOMC meeting review went out on Wednesday:
Nik’s conversation with Demian about COLDCARD went out on Friday:
Here are the links to our latest episode:
SPOTIFY
APPLE
Disclaimer
The TBL Model Portfolio, TBL Liquidity Indicator, and all TBL research outputs reflect Nik Bhatia and team’s analytical positioning for the macro and bitcoin environment. They are published for educational purposes only and are not investment advice, not a solicitation to buy or sell securities, and not a recommendation tailored to any individual’s portfolio. The Bitcoin Layer is not a registered investment advisor and does not manage client money. Please consult a professional financial advisor and conduct independent due diligence before making investment decisions.
Comments
Nothing yet. Say the first thing.
Sign in to join the conversation.