
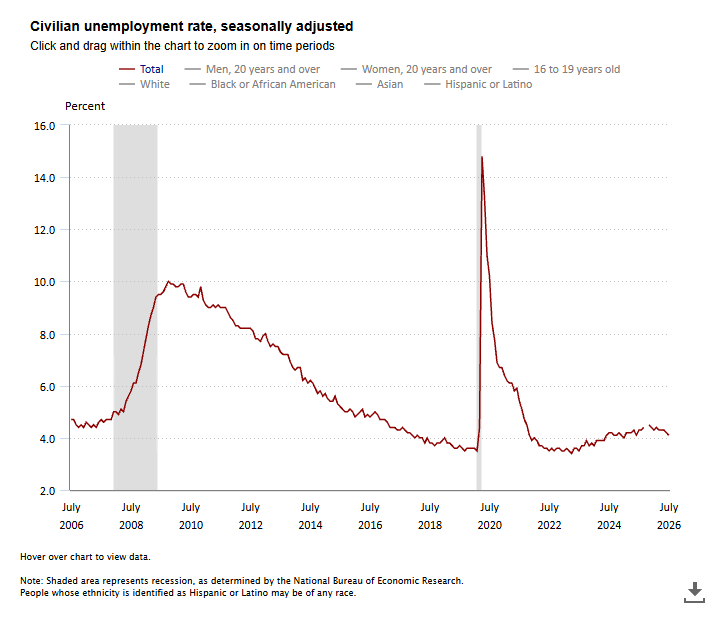
The jobs report broke the playbook. July payrolls didn’t just miss - they went negative for the first time in years, shedding 23,000 positions against expectations for a modest gain. The unemployment rate fell to 4.1%, but only because people bounced themselves out of the workforce entirely. That’s not improvement. That’s attrition wearing a mask.
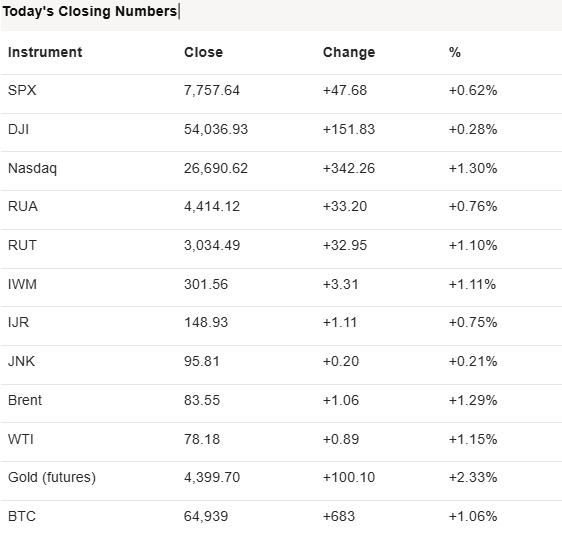
And yet the market rallied hard, with the Nasdaq leading at +1.30%, because traders chose to read weakness as a potential rate-cut catalyst rather than a recession signal. That trade works - right up until it doesn’t.
Gold ripped through $4,400, oil held firm on a Hormuz toll proposal nobody’s talking about, and the entire week’s narrative pivoted on one number at 8:30 AM.
The Jobs Report Broke the Old Playbook — And That’s the Real Story of the Week
July nonfarm payrolls showed an actual loss of 23,000 jobs — not a slowdown, a contraction. Consensus was looking for anywhere from +75,000 to +115,000. This is a massive negative surprise, and it’s the second straight weak month after June’s already-soft +57,000.
Here’s what’s easy to miss in the headlines: the unemployment rate actually ticked down to 4.1% from 4.2%. Normally that would read as good news. It isn’t. The rate fell because the labor force participation rate dropped - people left the workforce entirely rather than finding jobs. Your cousin Earl, his brother Earl and their other brother Earl… they all “gave up” on the job market. That’s the “improving for the wrong reason” trap: a shrinking denominator makes the ratio look better while the underlying labor market gets weaker. Don’t let anyone tell you a falling unemployment rate this month is bullish. Look closer at the participation data before you believe the headline number.
The market’s reaction is the more interesting trading lesson. Old playbook says: negative jobs print → recession fear → sell stocks. That’s not what happened. At all. Stocks rallied hard, led by the Nasdaq (+1.30%), because the market chose to read this as “the Fed has to cut now” rather than “the economy is breaking.” Same data point, two completely different interpretations available, and the market picked the bullish one. That’s not guaranteed to hold if next month’s print is equally bad - at some point “bad news is good news for rate cuts” flips to “bad news likely means an actual recession,” and nobody rings a bell when that shift happens. Pay attention to how many more consecutive weak prints it takes before sentiment flips.
That’s the intelligence take. Here’s all you need to know.
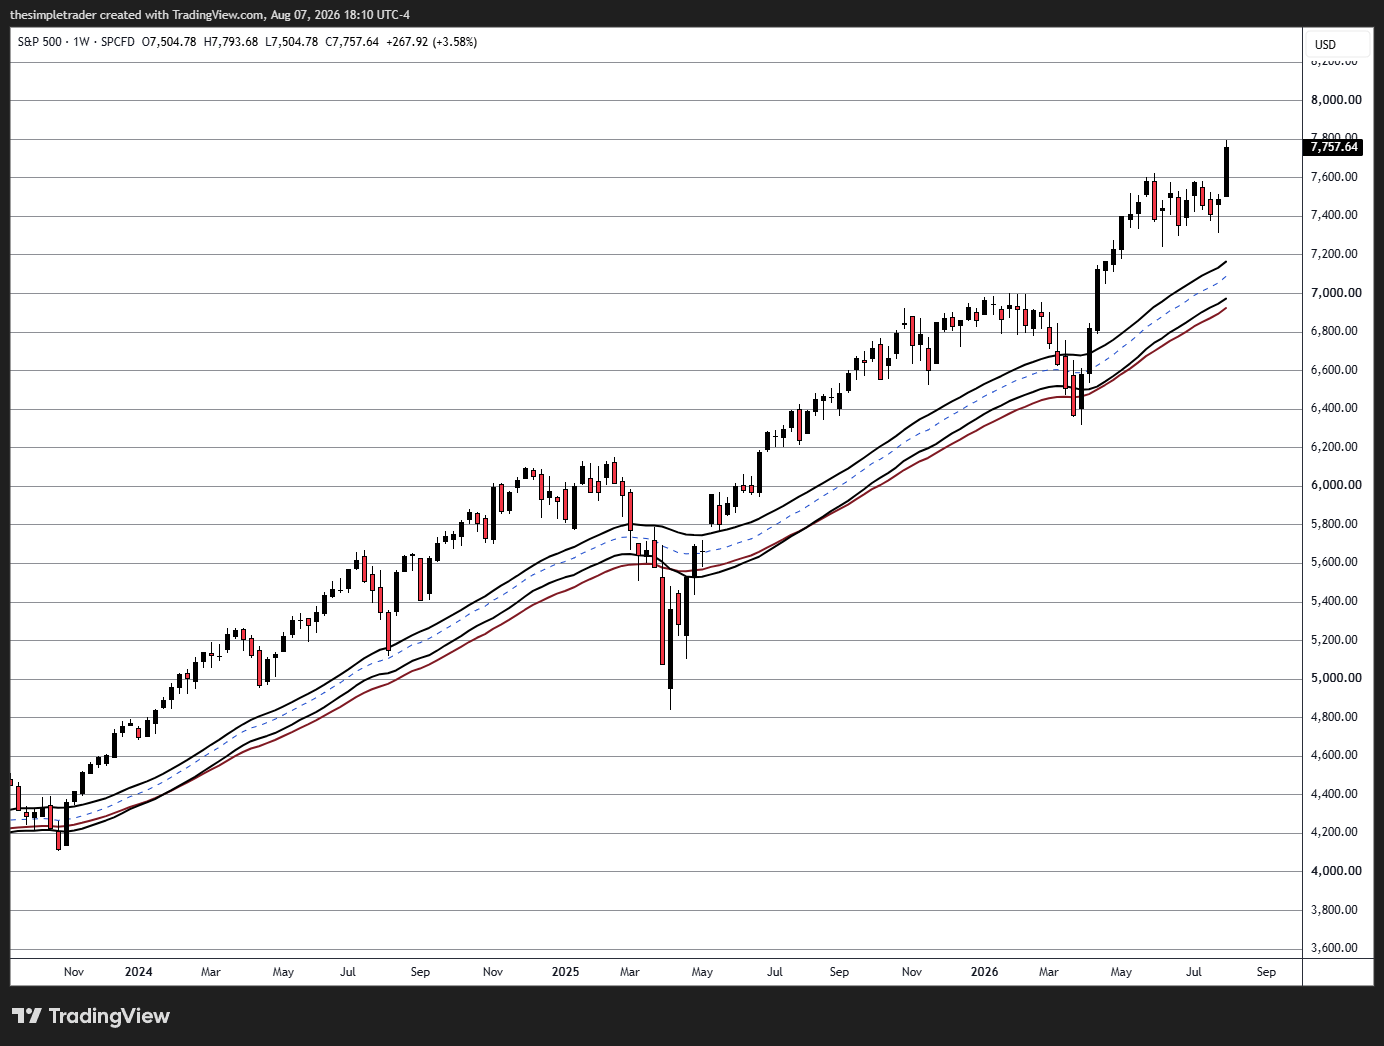
Watch the slope of the weekly TAOST Channel on the major stock indices. Price will break below, rally back and retest before truly falling away. And that will happen long before a recession takes hold.
Gold Just Retested the Exact Level I Flagged Wednesday - And Broke Through
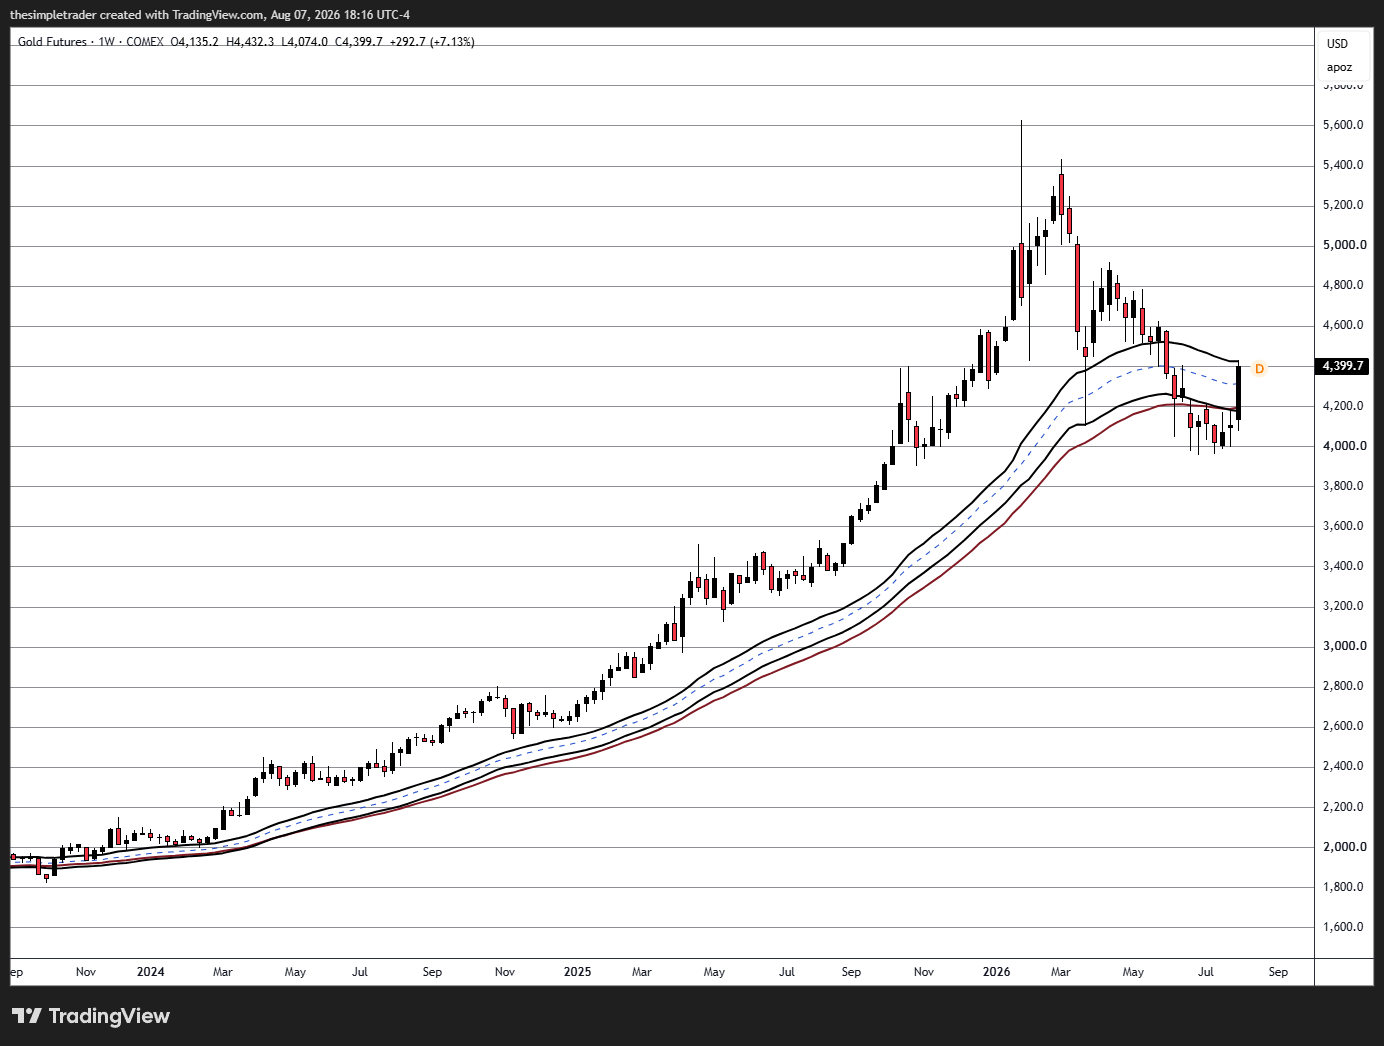
I called out $4,400 as the key resistance level (the May low, now acting as ceiling) in both Wednesday’s and Thursday’s recaps. Today gold closed at $4,399.70 - a whisker below that level, up +2.33% on the day. This isn’t a coincidence; it’s the jobs-report-driven rate-cut trade pouring directly into gold, since a weaker labor market means lower expected real rates, and lower real rates are the single biggest tailwind gold can get. Watch Monday’s open [Sunday evening interestingly] closely - a clean break and hold above $4,400 confirms the multi-week downtrend from January’s $5,586 high is actually reversing. A rejection right here, with gold stalling into the exact level it’s tested twice now, says the bounce is running out of room.
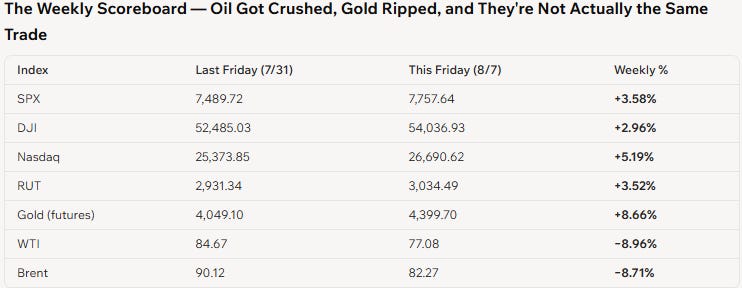
Nasdaq led every major equity index this week despite Tuesday’s AMD-driven wobble - a genuinely strong recovery. But the pairing that looks like one trade is actually two: oil’s ~9% weekly collapse was driven by war-de-escalation headlines (the Hormuz on-again-off-again saga), while gold’s ~8.7% weekly surge was driven by the jobs-report rate-cut repricing. They moved in opposite directions this week for unrelated reasons and just happened to land on similarly-sized moves. Don’t build an “oil down = gold up” mental model from this week - it’s coincidence, not causation, and next week could easily see them move together.
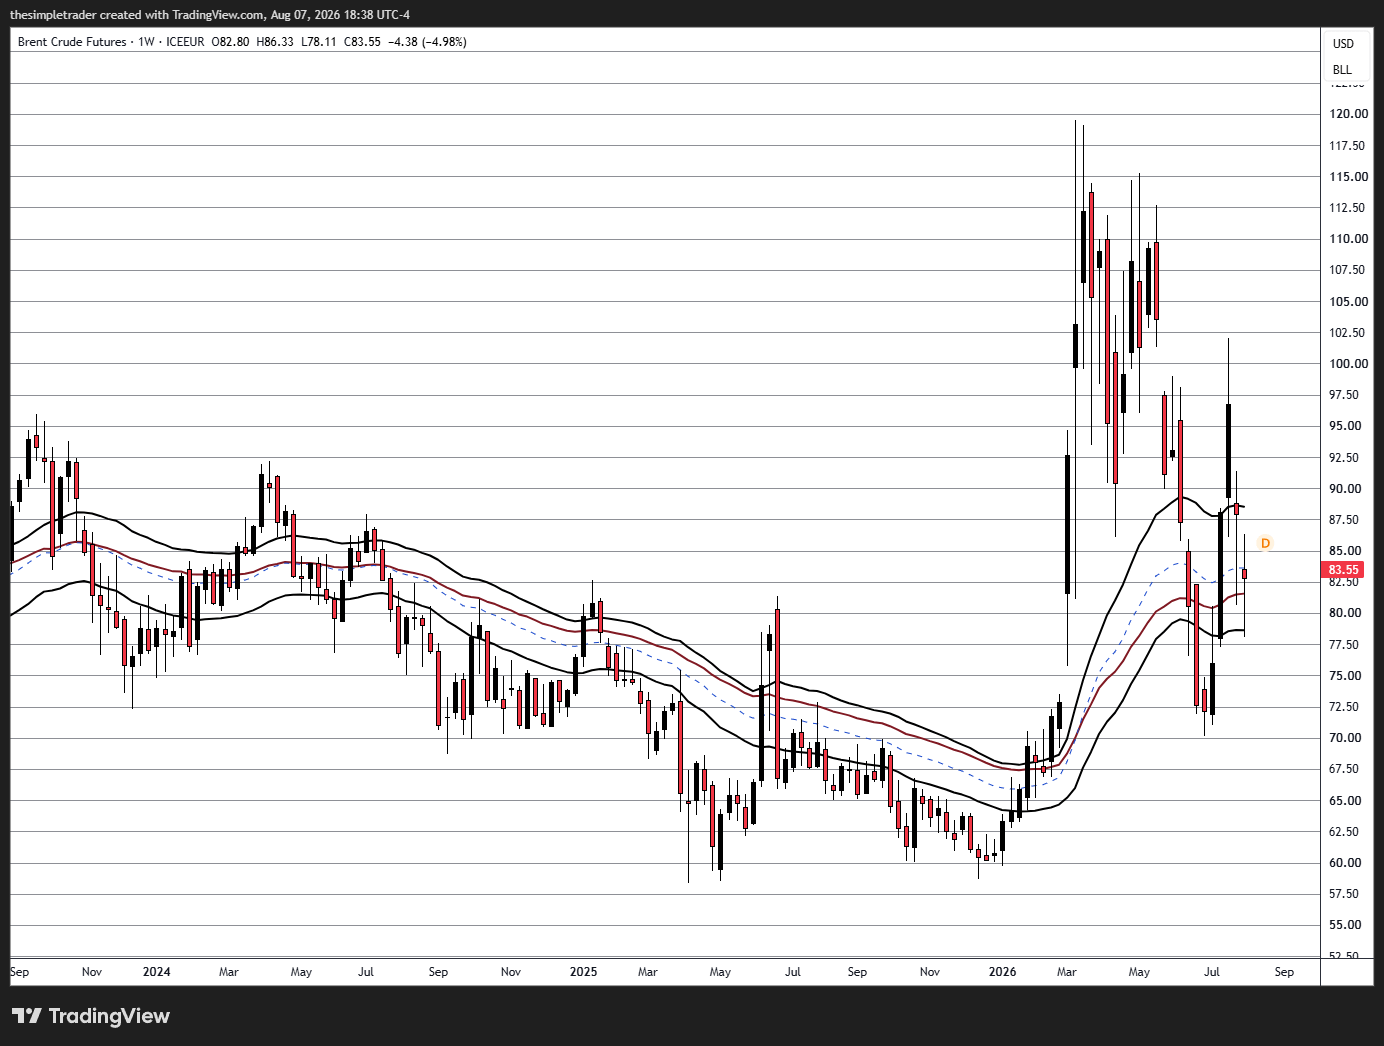
The Hormuz Situation Has a Weird Wrinkle: Iran Wants to Make $ Via a Toll
This deserves more attention than it’s getting. Iran and Oman are reportedly finalizing a deal where Iran would charge ships a fee of 5-7% of cargo value to transit the Strait of Hormuz - not simply reopening it for free passage. The draft deal is awaiting final approval from Iran’s Supreme Leader, and a senior Gulf official put the odds of a deal by Friday at “50-50.”
This is a fundamentally different outcome than what the market has been pricing all week. A toll isn’t the same as an open strait - it’s a permanent tax on global oil shipping that gets baked into the cost structure indefinitely, not a temporary risk premium that evaporates once tensions cool. If this structure actually gets implemented, oil doesn’t necessarily return to pre-crisis levels even after the “crisis” officially ends - there’s a new structural cost embedded in the supply chain. Today’s oil bounce (+1.29% Brent, +1.15% WTI) despite “deal is near” headlines might be the market starting to price that distinction in.
Next Week - CPI Is the Headline, But Watch the Hormuz Decision First
Monday, August 10: Markets open with the Hormuz deal decision still pending Supreme Leader approval over the weekend. Any resolution - approval, rejection, or continued delay - likely sets the tone before any US data even matters for the week.
Tuesday, August 11: HRB (H&R Block) reports after the close - the name I ran through yesterday… 22.5% short interest, new CEO’s first full-year commentary, worth watching for a squeeze setup.
Wednesday, August 12: CPI. This is now the single most important release of next week given today’s jobs shock. A soft CPI print stacked on top of a negative jobs number all but locks in a September cut narrative. A hot CPI print creates the most uncomfortable scenario of the cycle so far - weak labor market + sticky inflation - stagflation talk starts for real if that combination shows up.
Thursday, August 13: PPI - the upstream inflation read, useful for confirming or contradicting Wednesday’s CPI signal.
Friday, August 14: Retail Sales and University of Michigan Consumer Sentiment. With the labor market showing real cracks, retail sales becomes a direct read on whether consumers are already pulling back or still spending through the softening jobs backdrop.
The setup: this week’s rally was built entirely on “bad jobs data = more likely rate cut.” Next week’s CPI print is the test of whether that thesis survives contact with an actual inflation number. If CPI cooperates, the rally has real legs. If it doesn’t, the market has to choose between fighting inflation and defending a weakening labor market - and that’s the trade nobody wants to be positioned wrong for.
Enjoy your weekend.
E
⚠️ Disclaimer: This recap is for informational and educational purposes only. Not financial advice. Always conduct your own due diligence.
No posts
Comments
Nothing yet. Say the first thing.
Sign in to join the conversation.