- Published on
/
8 min read
Analysis#
I find file formats to be a pretty fascinating topic. Having written parsers for common formats like Mach-O binaries, Android DEX files, PNG and JPG images, PDF documents, and more, I've started to notice commonalities across file specs.
Being able to visualize files in a consistent way sounds like a neat experiment, so with the help of Claude, that's exactly what I did:
#!/usr/bin/env python3
"""
Visualize arbitrary files as fixed-size square images with color options.

Modes:
    byte        – grayscale-like (byte intensity), optionally colored via colormap
    entropy     – local entropy heatmap
    rgb-bytes   – interpret every 3 bytes as an RGB pixel
"""

from __future__ import annotations
import argparse
from pathlib import Path
from typing import Literal

import numpy as np
import matplotlib.pyplot as plt

Mode = Literal["byte", "entropy", "rgb-bytes"]


def load_bytes(path: Path) -> np.ndarray:
    data = path.read_bytes()
    if not data:
        raise ValueError(f"File is empty: {path}")
    return np.frombuffer(data, dtype=np.uint8)


# -----------------------------
# BYTE & ENTROPY GRID FUNCTIONS
# -----------------------------

def make_byte_grid(data: np.ndarray, size: int) -> np.ndarray:
    total = size * size
    if data.size == 1:
        arr = np.full(total, data[0], dtype=np.float32)
    else:
        idx = np.linspace(0, data.size - 1, total, dtype=np.int64)
        arr = data[idx].astype(np.float32)

    return (arr / 255.0).reshape(size, size)


def entropy_of_chunk(chunk: np.ndarray) -> float:
    if chunk.size == 0:
        return 0.0
    counts = np.bincount(chunk, minlength=256).astype(np.float32)
    total = counts.sum()
    if total <= 0:
        return 0.0

    p = counts / total
    p_nonzero = p[p > 0]
    h = -(p_nonzero * np.log2(p_nonzero)).sum()
    return float(h / 8.0)  # normalize to [0,1]


def make_entropy_grid(data: np.ndarray, size: int) -> np.ndarray:
    chunks = np.array_split(data, size * size)
    values = np.array([entropy_of_chunk(chunk) for chunk in chunks], dtype=np.float32)
    return values.reshape(size, size)


# -----------------------------
# RGB MODE
# -----------------------------

def make_rgb_grid(data: np.ndarray, size: int) -> np.ndarray:
    """
    Interpret file as RGB triples:
        [byte0, byte1, byte2] → (R, G, B)
    Missing bytes are padded with zeros.

    Output shape: (size, size, 3)
    """
    total_pixels = size * size
    total_bytes_needed = total_pixels * 3

    if data.size < total_bytes_needed:
        # pad zeros at the end
        padded = np.pad(data, (0, total_bytes_needed - data.size))
    else:
        padded = data[:total_bytes_needed]

    rgb = padded.reshape(total_pixels, 3).astype(np.float32) / 255.0
    return rgb.reshape(size, size, 3)


# -----------------------------
# RENDERING
# -----------------------------

def plot_grid(grid, mode: Mode, colormap: str | None, out_path: Path, title: str):
    plt.figure(figsize=(6, 6))

    if mode in ("byte", "entropy"):
        plt.imshow(grid, cmap=colormap, interpolation="nearest")
    else:  # rgb-bytes
        plt.imshow(grid, interpolation="nearest")

    plt.axis("off")
    plt.tight_layout(pad=0)
    plt.savefig(out_path, bbox_inches="tight", pad_inches=0, dpi=300)
    plt.close()


# -----------------------------
# CLI
# -----------------------------

def parse_args():
    parser = argparse.ArgumentParser(description="Visualize file structure with color.")

    parser.add_argument("file", type=Path)
    parser.add_argument("--mode", "-m",
        choices=["byte", "entropy", "rgb-bytes"],
        default=None,
        help="Visualization mode (default: generates all three)")
    parser.add_argument("--size", "-s", type=int, default=256)
    parser.add_argument("--colormap", "-c",
        type=str,
        default="viridis",
        help="Matplotlib colormap name (ignored in rgb-bytes mode).")
    parser.add_argument("--out", "-o", type=Path,
        help="Output path (only valid when --mode is specified)")

    return parser.parse_args()


def main():
    args = parse_args()
    path: Path = args.file

    # Determine which modes to generate
    if args.mode:
        modes = [args.mode]
    else:
        modes = ["byte", "entropy", "rgb-bytes"]

    # Validate --out can only be used with single mode
    if args.out and len(modes) > 1:
        print("Error: --out can only be used when --mode is specified")
        return

    data = load_bytes(path)

    # Generate visualization for each mode
    for mode in modes:
        # Auto-scale grid size if file is too small
        size = args.size
        if mode == "byte":
            # Byte mode needs 1 byte per pixel (no repeating)
            max_size = max(1, int(data.size ** 0.5))
            if size > max_size:
                size = max_size
                print(f"Note: File too small for {args.size}×{args.size} byte mode, using {size}×{size}")
        elif mode == "rgb-bytes":
            # RGB needs 3 bytes per pixel
            max_size = max(1, int((data.size / 3) ** 0.5))
            if size > max_size:
                size = max_size
                print(f"Note: File too small for {args.size}×{args.size} RGB mode, using {size}×{size}")
        elif mode == "entropy":
            # Entropy needs at least 16 bytes per chunk for meaningful analysis
            max_size = max(1, int((data.size / 16) ** 0.5))
            if size > max_size:
                size = max_size
                print(f"Note: File too small for {args.size}×{args.size} entropy mode, using {size}×{size}")
        if mode == "byte":
            grid = make_byte_grid(data, size)
            colormap = args.colormap
        elif mode == "entropy":
            grid = make_entropy_grid(data, size)
            colormap = args.colormap
        elif mode == "rgb-bytes":
            grid = make_rgb_grid(data, size)
            colormap = None  # ignored in rgb mode

        if args.out:
            out_path = args.out
        else:
            # Save to output/ folder in current directory
            output_dir = Path.cwd() / "output"
            output_dir.mkdir(exist_ok=True)
            filename = f"{path.stem}.{mode}.{size}.png"
            out_path = output_dir / filename

        title = f"{path.name} ({mode}, {size}px)"

        plot_grid(grid, mode, colormap, out_path, title)
        print(f"Saved: {out_path}")


if __name__ == "__main__":
    main()
This script produces three images:
- Bytes visualized with a colormap
- Entropy analysis of byte chunks
- Bytes interpreted as RGB color values
Results#
JPG#
In the spirit of Christmas, let's inspect this image:

And here it is visualized with our script:
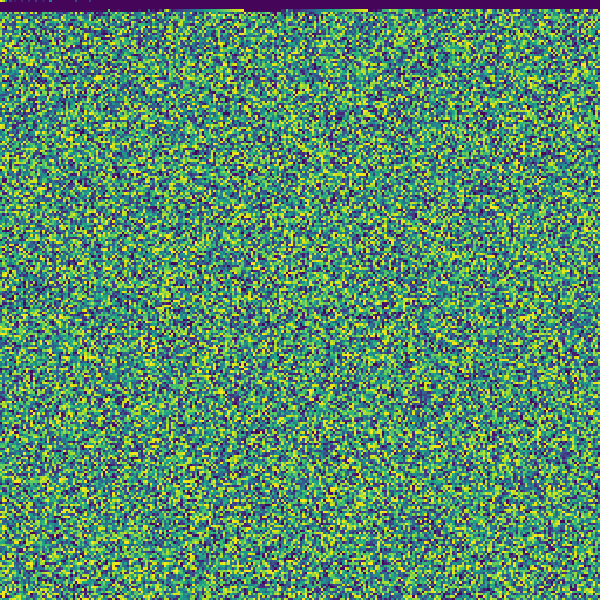
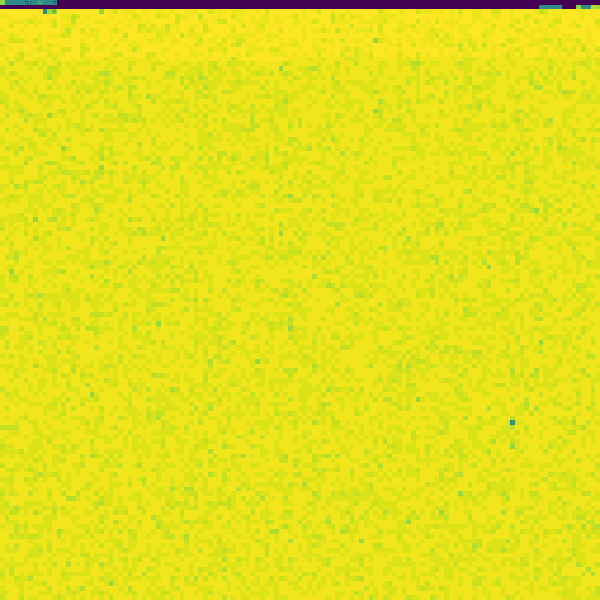
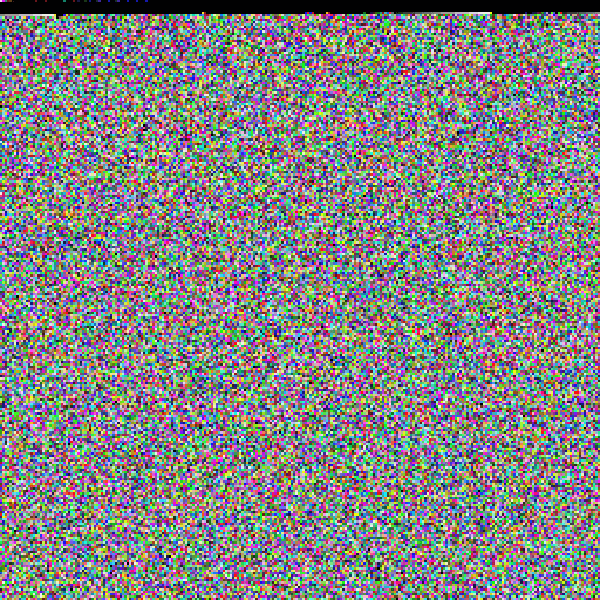
It turns out image files are actually not that interesting. Other than the header information at the start, it's largely a mix of random-looking data.
PNG#
Converting our image above into PNG:
magick convert /Users/telkins/Downloads/christmas-tree.jpg /Users/telkins/Downloads/christmas-tree-2.png
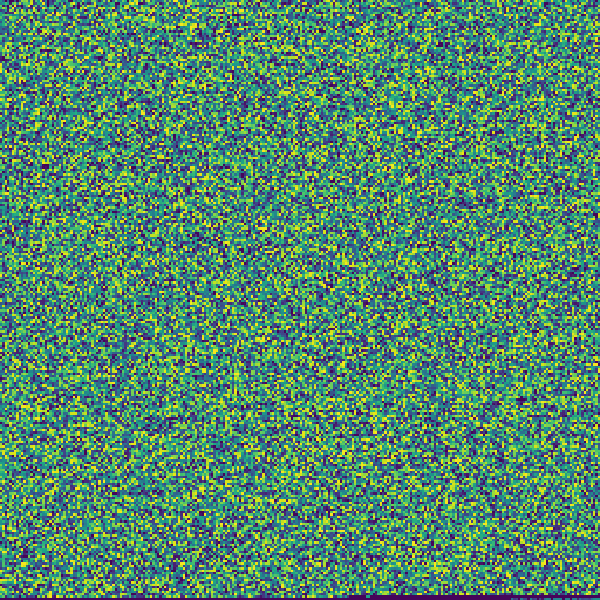
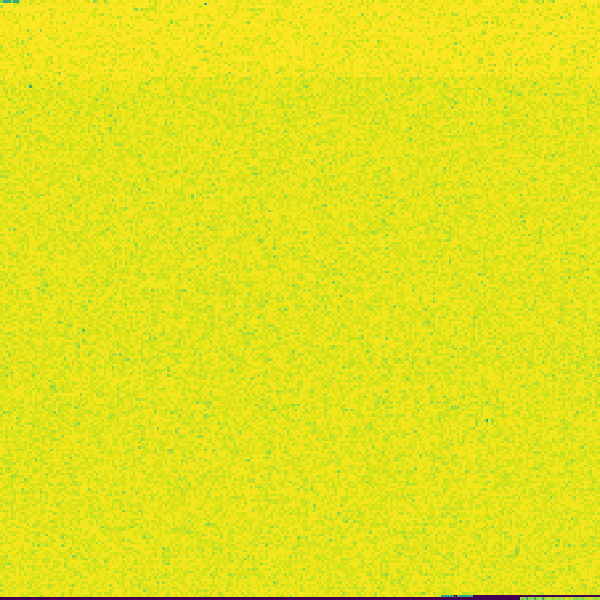
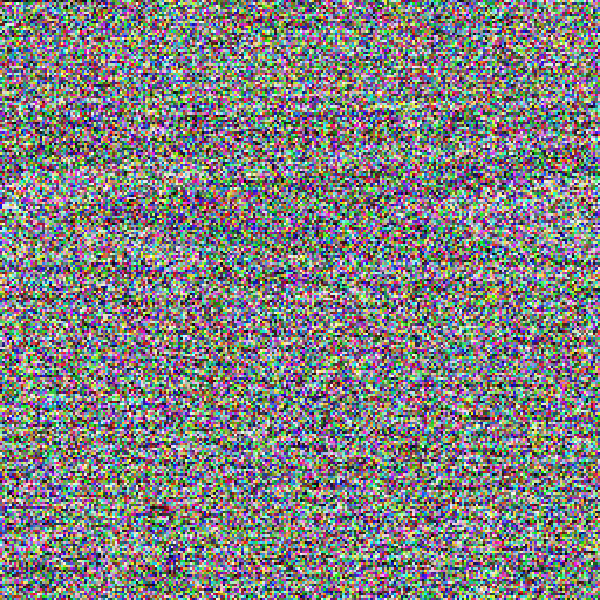
I'm surprised to see some kind of data added at the end of the file, I didn't realize that was allowed in the spec.
Testing on a different image from my generated iPhone:
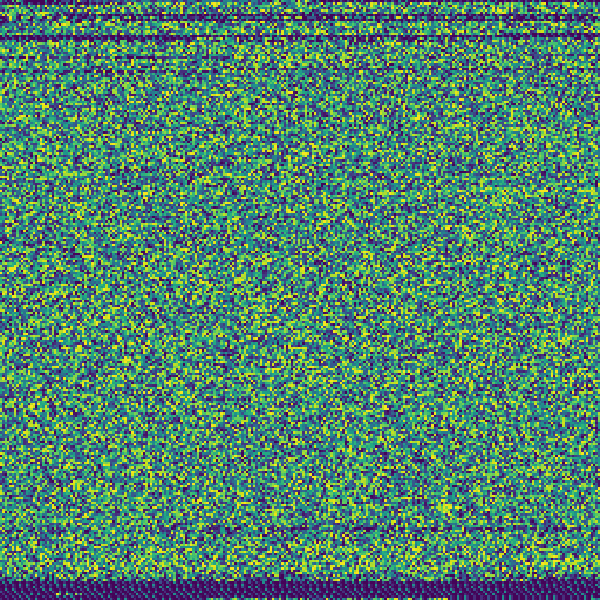
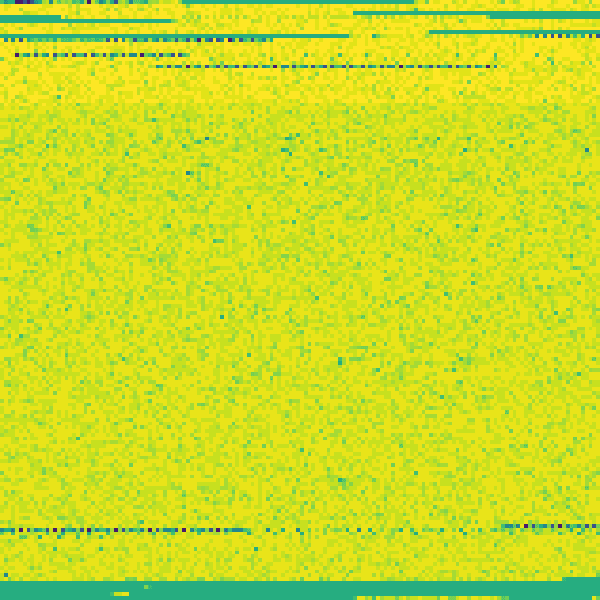
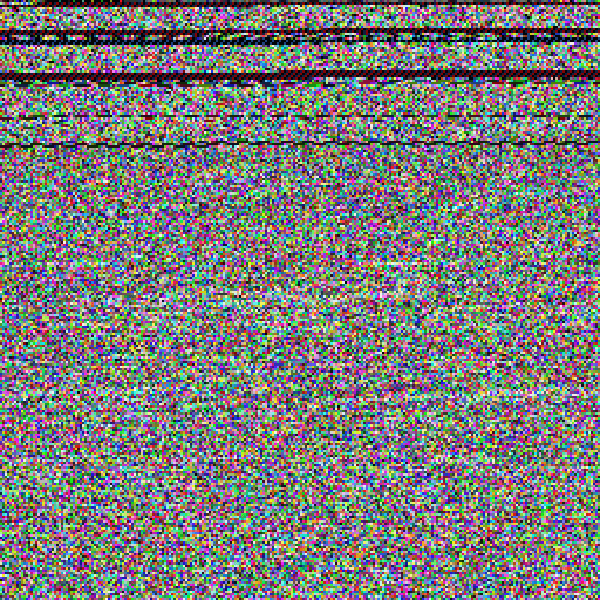
You can see some more patterns. I tested a few more images and PNG has a decent amount of variation, some of which have no data appended to the end.
Mach-O#
What about something like the vim executable?
file /usr/bin/vim
/usr/bin/vim: Mach-O universal binary with 2 architectures: [x86_64:Mach-O 64-bit executable x86_64] [arm64e]
/usr/bin/vim (for architecture x86_64): Mach-O 64-bit executable x86_64
/usr/bin/vim (for architecture arm64e): Mach-O 64-bit executable arm64e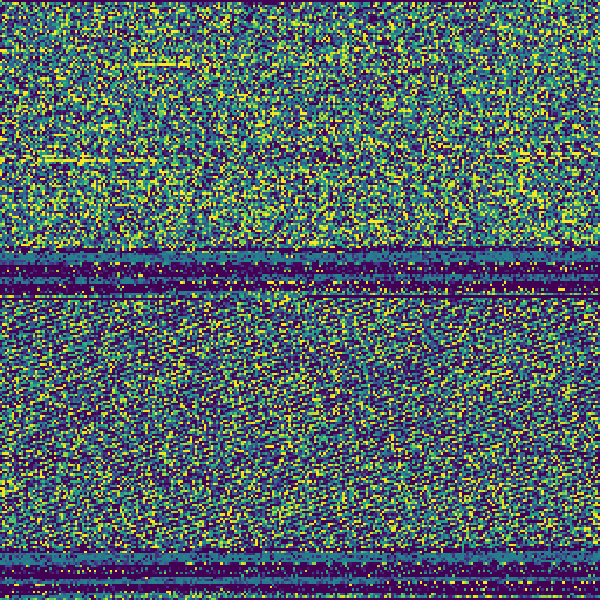
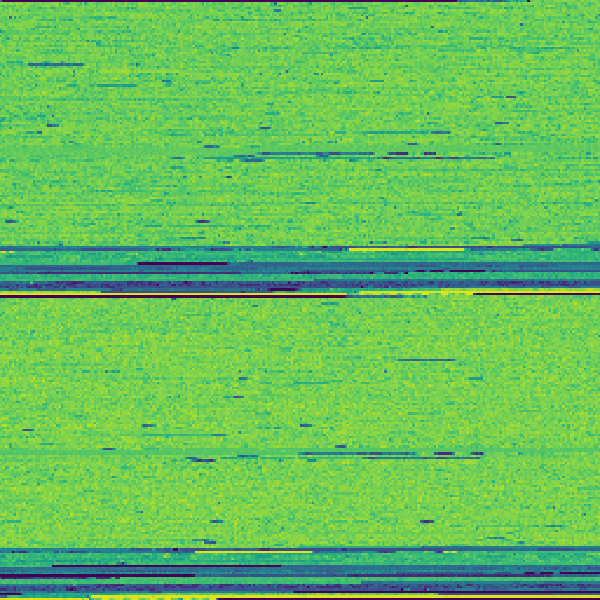
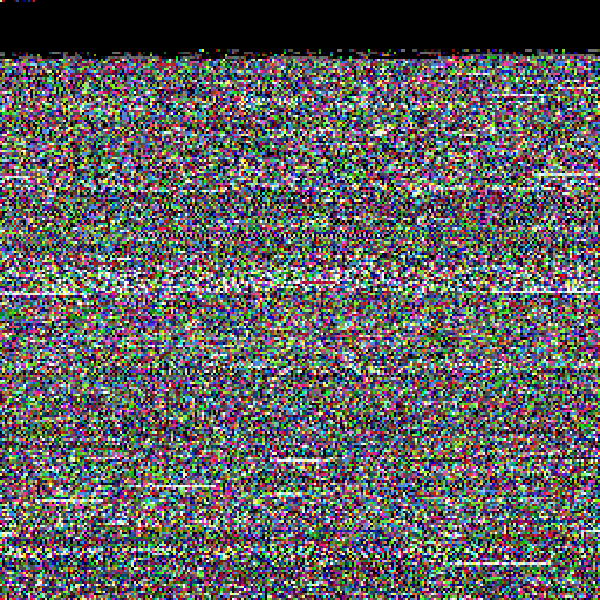
Right off the bat, you can see what appear to be the two architectures for x86_64 and arm64e packed into a single FAT binary.
Mach-O DWARF#
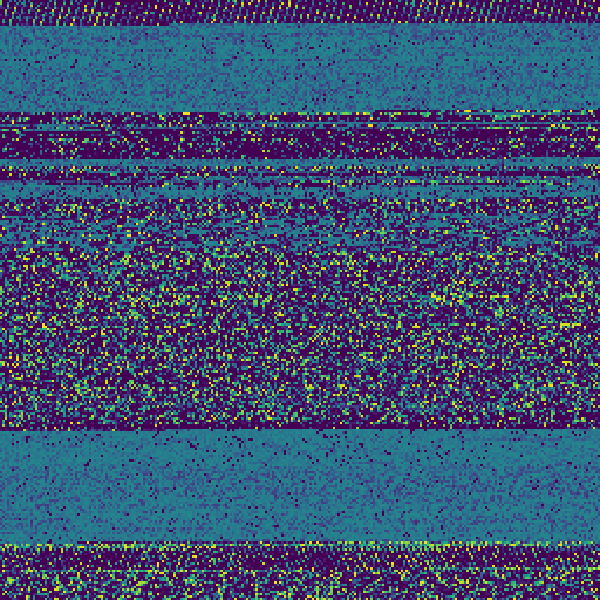
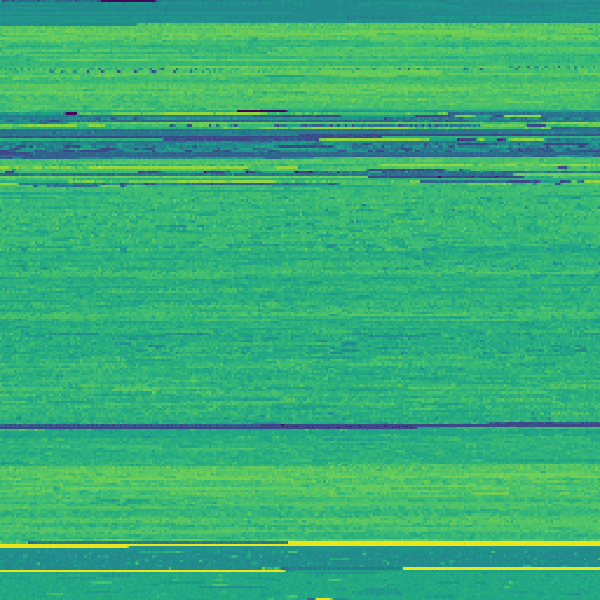
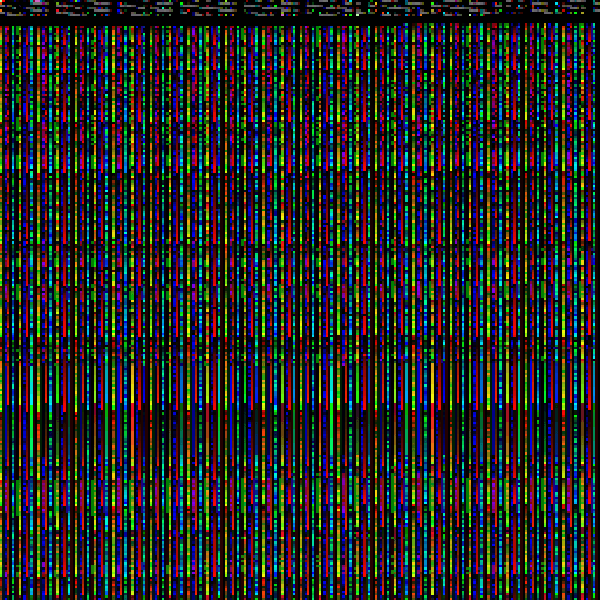
Naturally, I'm also curious what a DWARF debugging file looks like. This one is probably my favorite:
DEX#
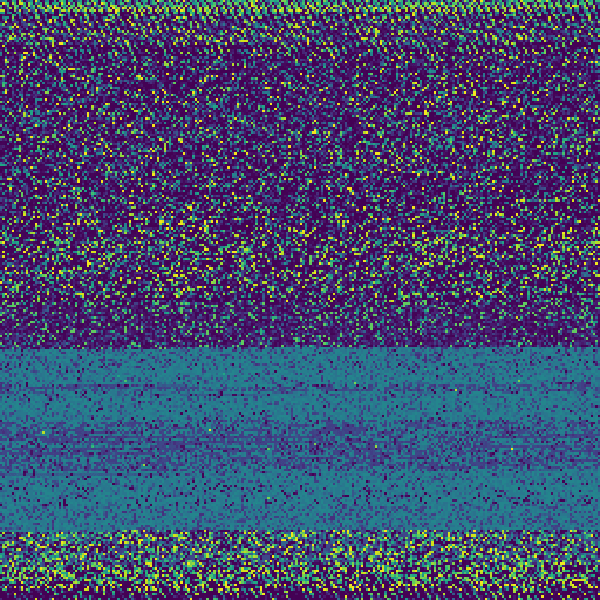
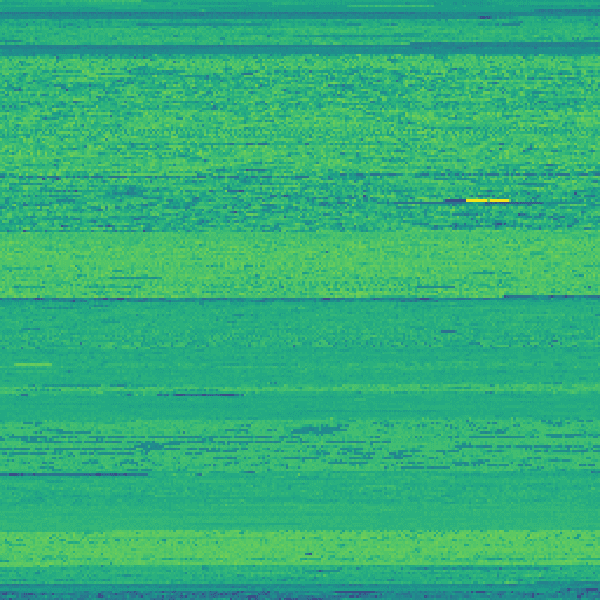
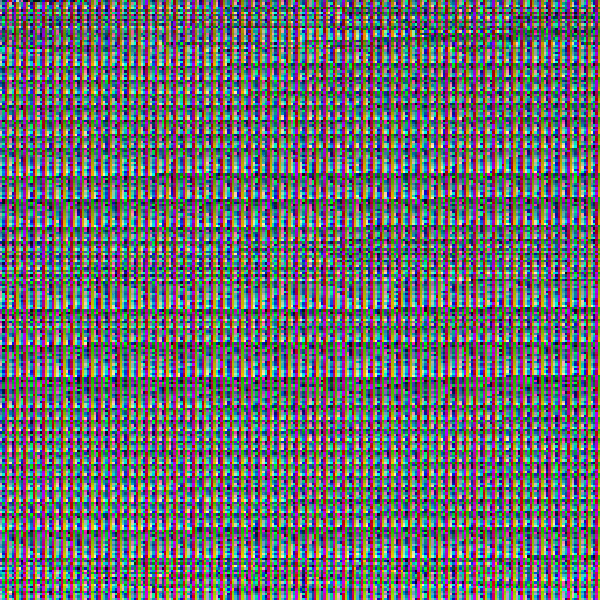
And to cater to the Android crowd, this is the DEX file from our HackerNews app:
MP3#
I found this retro arcade game music:
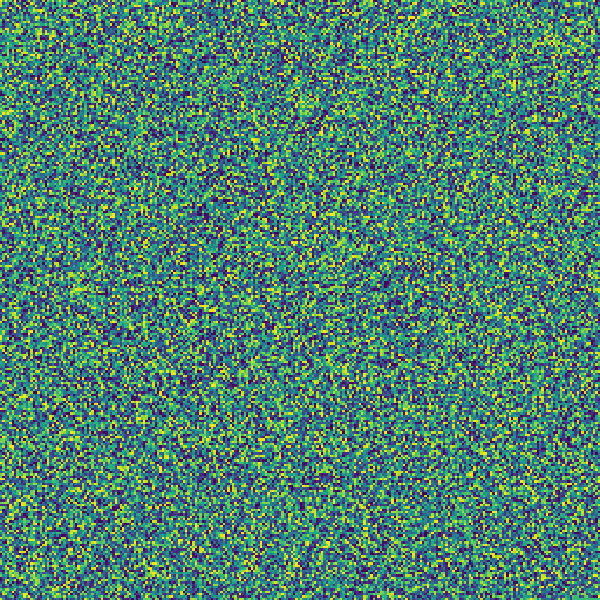
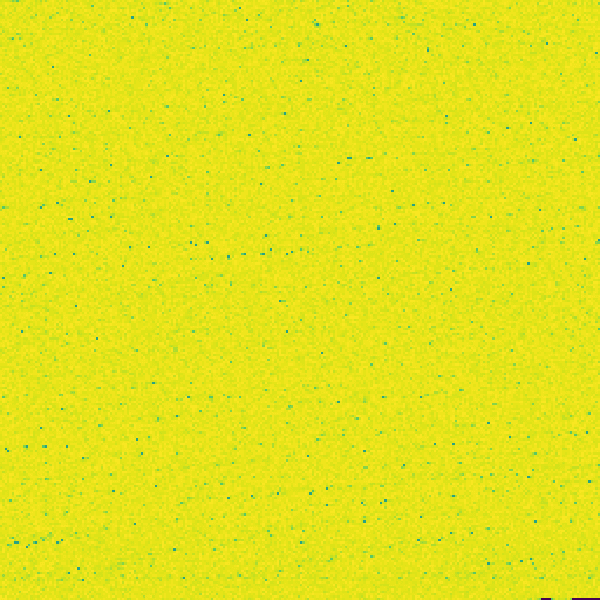
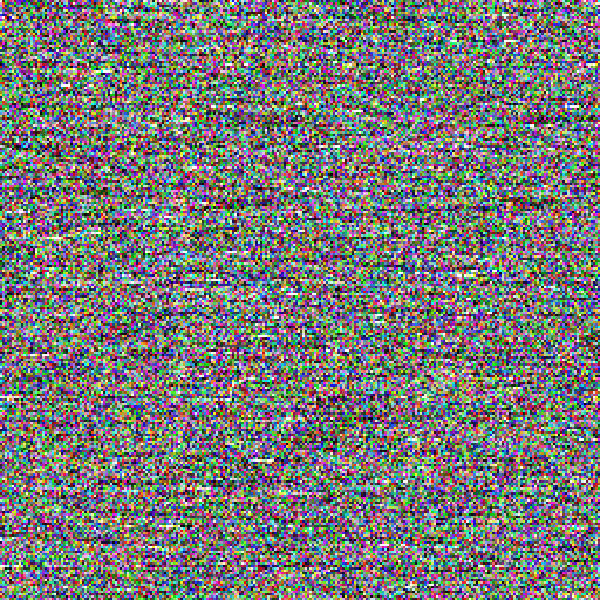
Unsurprisingly, there aren't many patterns here since MP3 uses compression.
EPUB#
In case you are curious what the Designing Data-Intensive Applications book looks like, don't worry, I have you covered:


TXT (with GZIP)#
I happen to have a text file from ICANN with a list of every registered .app domain. Here's the before/after of it being gzip'd:
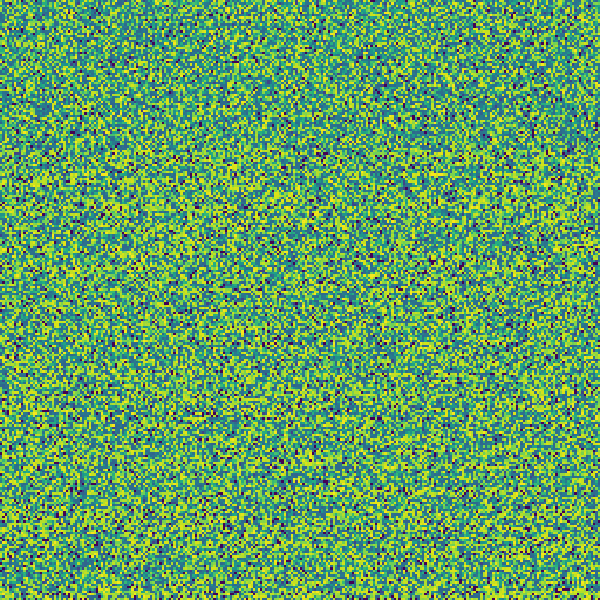
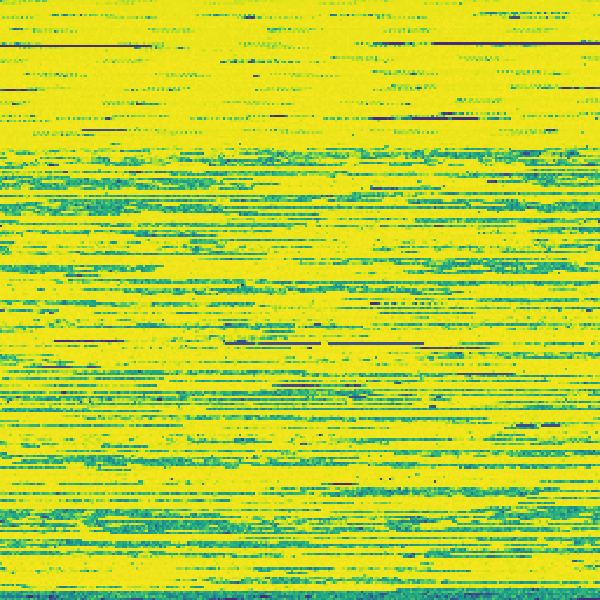
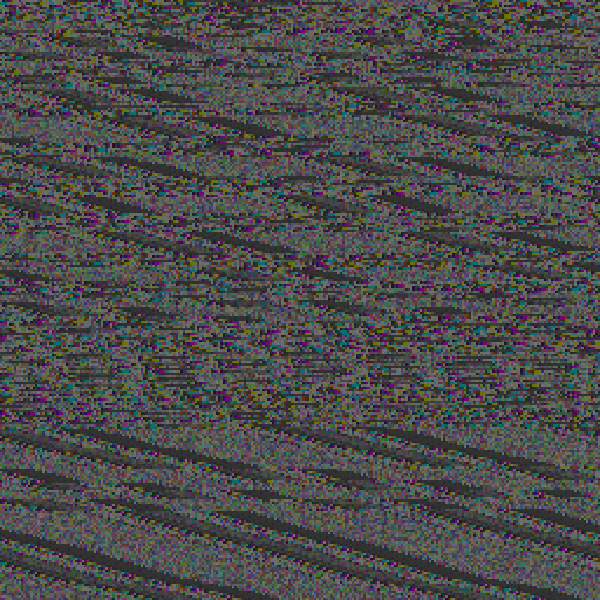
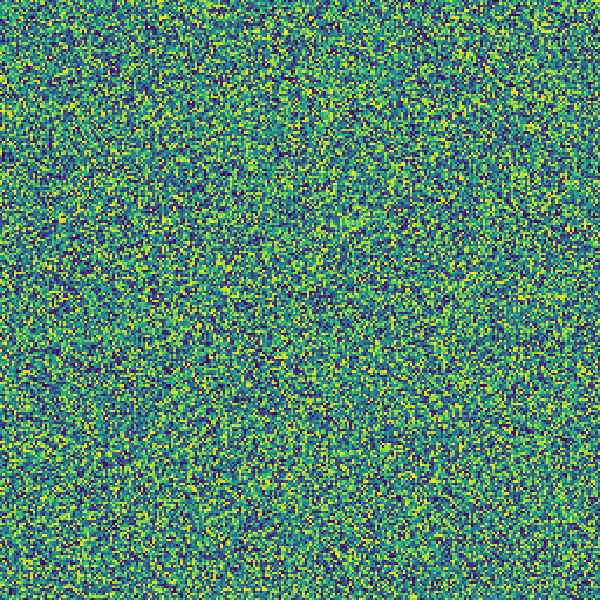

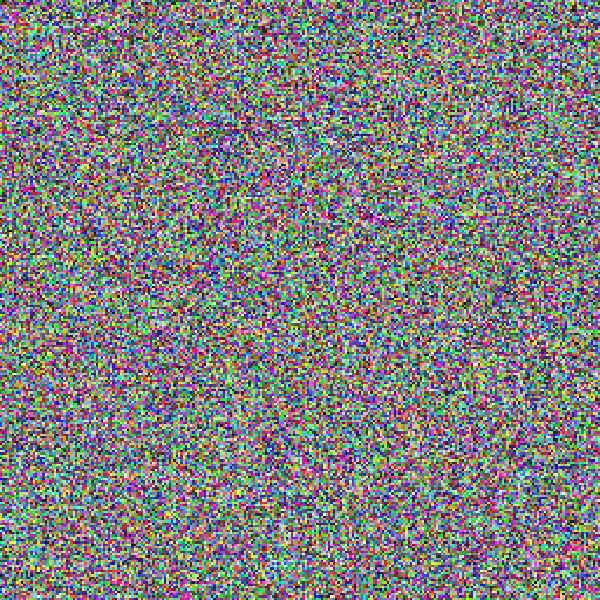
As expected, the compressed version has higher entropy.
Takeaways#
I didn't really know what to expect going into this. I did think I would find more variations between many of the file formats, but in hindsight it makes sense that most formats are really just a small header section followed by the data content. For more structured binary formats like Mach-O and DEX, the sections are much more visible.
Anyway, hope you found this interesting!
Comments
Nothing yet. Say the first thing.
Sign in to join the conversation.