
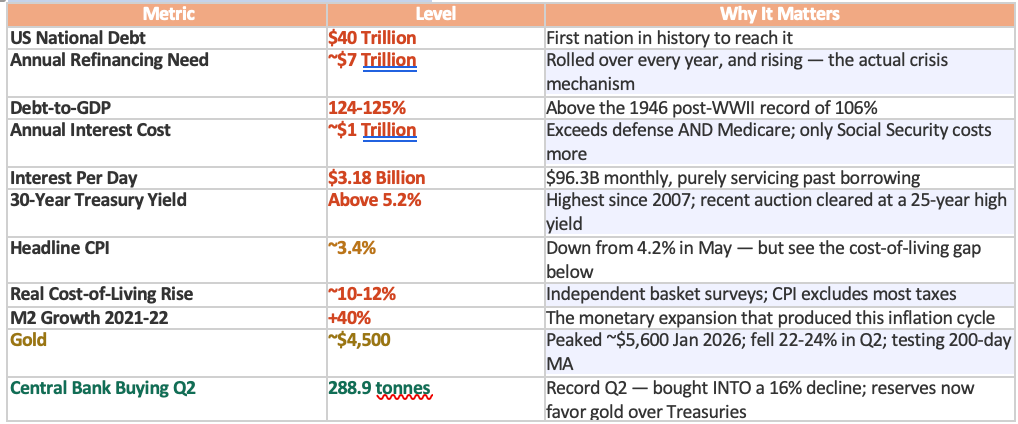
The United States has crossed $40 trillion in national debt. No country in history has reached this number. The first trillion took 192 years to accumulate; the most recent took roughly five months.
But the debt stock is not the mechanism that breaks things. The flow is.
The Treasury must refinance approximately $7 trillion every single year, and that figure is rising as more short-dated paper rolls into a higher-rate environment. This is the number that matters. A borrower with $40 trillion outstanding but no near-term maturities has a long-term problem. A borrower who must find buyers for $7 trillion annually has an immediate one, repeated every twelve months, forever.
Through the first ten months of fiscal 2026, net interest reached $963 billion — roughly $96.3 billion a month, or $3.18 billion every day. That single line item exceeds federal spending on national defense and on Medicare. Among all federal programs, only Social Security costs more.
Unlike war spending or pandemic relief, interest does not end when the crisis passes. It compounds. A growing share of new borrowing exists purely to service old borrowing. The CBO projects net interest totaling $16.2 trillion over the next decade, rising from $1.0 trillion in 2026 to $2.1 trillion by 2036.
The auction market is already pricing it. The Treasury recently sold $25 billion of 30-year bonds at the highest yield in a quarter century. That is not a forecast about future fiscal policy — it is buyers demanding more compensation, in real time, to hold long-dated US government paper.
The arithmetic is not a matter of opinion: a government cannot simultaneously carry 125% debt-to-GDP, refinance $7 trillion a year, pay $1 trillion in interest, and maintain a hard currency. One of those four has to give. Historically, it is always the currency.
The most revealing moment of the last FOMC cycle was not the decision. It was the explanation.
Asked why the committee held rates despite three dissenting votes favoring a hike, the chair pointed out that interest rates had already been rising for roughly forty days. The federal funds rate had not moved. The bond market had moved anyway — and had, in effect, done the committee’s tightening for it.
When the central bank does not need to tighten because bond investors tightened on its behalf, the market is setting the price of long-term money. The committee is ratifying, not deciding.
The specific failure mode is straightforward: a monetary crisis arrives when buyers stop wanting Treasuries, forcing rates dramatically higher to clear the auction.
The historical reference point is Sweden in 1992, where authorities briefly pushed short-term rates to 500% to defend the krona against capital flight. The United States enjoys a structural advantage Sweden did not — the dollar is the world’s reserve currency, which lets America export a large share of its monetary inflation abroad. But that advantage is a buffer, not an exemption.
There is already recent evidence the bond market constrains policy in practice. During the tariff escalation, the Treasury Secretary reportedly warned the President that the Treasury market was deteriorating and could unravel quickly. The tariff position was softened almost immediately. Whatever one thinks of the policy itself, the sequence is instructive: the bond market objected, and policy changed within days.
The threshold for genuine alarm is a 10-year yield sustained above 5%. The 30-year has already crossed 5.2%, its highest since 2007. Second-order damage is visible in housing, where brokers in parts of Florida describe transaction volumes comparable to 2008 — without the defaults yet.
The uncomfortable question: if the bond market does what it wants regardless of Fed policy, what is the Fed’s actual relevance? At $40 trillion with $7 trillion refinanced annually, the answer may be that the market takes control whether the committee consents or not.
The United States has entered an era of permanent inflation. This is not a forecast of hyperinflation. It is a claim about regime — and the distinction matters enormously for how you position.
Long-run historical work by Reinhart and Rogoff shows that US inflation oscillated up and down — spiking during wars, then reverting — for the entire period before World War II. After 1945 the pattern changes shape entirely into a one-way ascent. Prices stop mean-reverting.
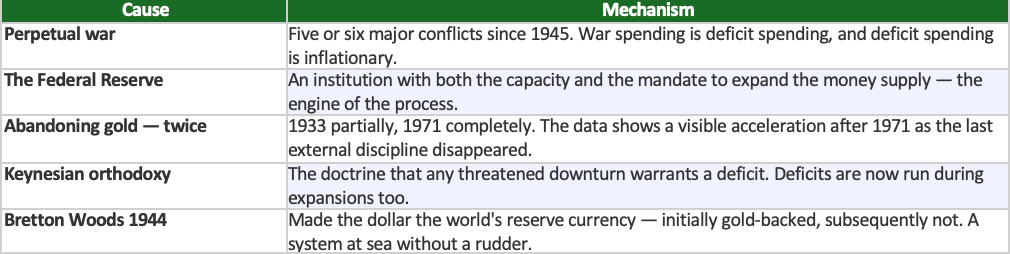
The final structural point is the most under-appreciated: the Fed’s stated target is 2% inflation, not zero. Its mandate refers to price stability, but the institution has redefined stability as steady 2% depreciation. And in practice it has begun cutting before reaching even that. A central bank targeting permanent 2% erosion is not fighting inflation; it is administering it.
Here is the practical consequence, and it is the single most actionable idea in this analysis.
A household needs roughly a 10% annual increase in wages, salaries and investment returns simply to hold its standard of living flat. Not to get ahead. To stand still.
That figure sits far above the 3.4% headline CPI, and the gap is structural rather than accidental. Independent basket surveys tell a different story than the official index — a widely cited holiday cookout basket, a July 4th meal for four, rose approximately 12% year over year to $81.
The deeper objection to CPI is what it leaves out. The index captures sales tax but excludes income tax, capital gains tax and estate taxes entirely. For a household budget, those are cost-of-living items. Anyone who has compared a grocery receipt or a fuel bill against the reported inflation rate has encountered this gap directly.
Reframe what gold is for. If your true cost of living rises 10% annually while your bonds yield 4% and your CPI-indexed Social Security rises 3%, you are losing purchasing power every year in assets that look safe on a statement. Gold’s role in that world is not speculation. It is the attempt to keep pace with a number the official statistics do not report.
Critically, and against the grain of most gold commentary, permanent inflation does not mean accelerating inflation. The more defensible case is that inflation settles into a 3-4% range rather than spiraling beyond it.
The institutional reasoning matters here. The current Fed leadership has restored money supply to the analytical framework after a period when it was effectively ignored, and leans toward supply-side and monetarist thinking. If money supply growth is managed toward the 2-5% range, inflation in the 3-4% band is the realistic outcome — uncomfortable, persistent, but not disorderly.
This distinction is the difference between a sound thesis and a slogan. Permanent inflation at 3-4% is a strong argument for owning hard assets as a meaningful sleeve. It is not an argument for $17,000 gold, and it is not an argument for abandoning equities.
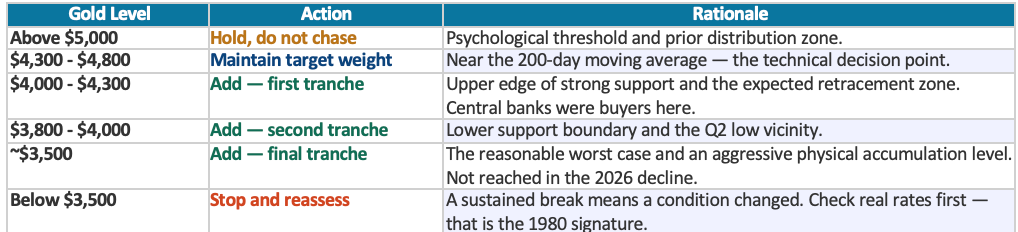
Gold set a record near $5,600 in January 2026, fell roughly 22-24% through the second quarter — its worst quarterly performance since 2013 — and had rebounded toward $4,500 by mid-August. It currently trades near its 200-day moving average, the technical decision point: sustained trade above it suggests the advance continues.
The proximate cause of the decline was not a failure of the debt thesis. The Iran conflict drove oil higher, lifting inflation expectations, pushing the Fed hawkish, raising real rates and strengthening the dollar. Gold competes directly with real yields and is priced in dollars, so it absorbed both blows simultaneously.

The pattern across both prior secular bull markets is consistent: a deep mid-cycle correction that removes leveraged and impatient holders, followed by the strongest leg of the advance. The technical structure supports continuation — a wedge pattern resolving upward with a decisive breakout, a broken downtrend, and emerging higher lows followed by higher highs. Institutional forecasts have converged nearby, with several major desks viewing the pullback as largely complete and targeting the $4,600 area for Q4 2026.
In the second quarter of 2026 — the quarter gold fell roughly 16% — the world’s central banks purchased a net 288.9 tonnes. That is the highest second-quarter total ever recorded. In Q1 they bought 244 tonnes, spending $37 billion, the highest single-quarter dollar value on record.
The threshold has already been crossed: central banks now hold more gold than they hold Treasuries. The world’s official sector has quietly reversed a reserve hierarchy that stood for generations. Institutions do not restructure reserves on a whim — they are planning for trouble.
Read the sequence again. Price fell. Sovereign buyers accelerated. These are institutions with multi-decade horizons, no performance benchmarks, and no redemption pressure. When they buy into weakness, they are not trading — they are reallocating reserves away from the borrower who must refinance $7 trillion a year.
The World Gold Council’s 2026 survey of 76 central banks found 89% expect global gold reserves to increase — a record response. The WGC forecasts roughly 850 tonnes of official-sector buying for 2026 against a pre-2022 average of 400-500 tonnes.
The data is contested, and presenting only the bullish read would be dishonest. Research from at least one major bank reports a materially different picture for the same period: central banks selling 129 tonnes in Q1 2026, headlined by Türkiye’s 60-tonne disposal in March, with net reported purchases of only 16 tonnes. A separate analysis notes first-half demand of roughly 345 tonnes — the weakest half-year since 2022 — and frames the record Q2 as a catch-up move after an unusually weak Q1.
These readings can partially coexist: gross versus net purchases, reported versus estimated flows, and disclosure timing all differ across methodologies. But the sovereign bid is strong on a multi-year view and genuinely contested on a quarterly one. Anyone selling certainty here is selling something.
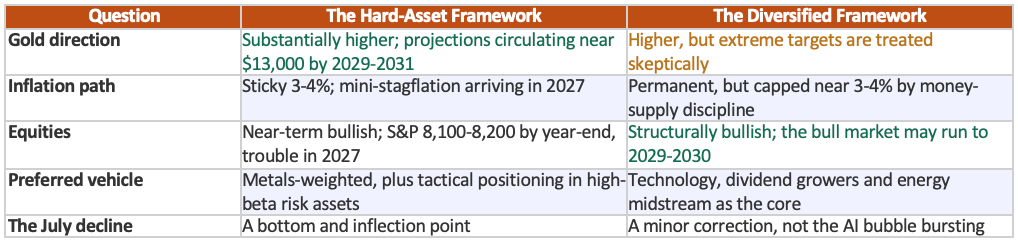
It is possible to agree entirely that the fiscal trajectory is unsustainable and still arrive at completely different portfolios. Two coherent frameworks currently circulate among strategists who share the same macro diagnosis. The gap between them is the most useful thing in this analysis.
This is the argument most gold commentary omits, and it deserves a fair hearing.
The diversified framework characterizes the present period as a new roaring twenties — a golden era of technology arriving a century after the original. The parallel drawn is to the 1990s NASDAQ: when irrational exuberance was first warned about in 1995, the index went on to double and then double again. The claim is that comparable potential exists now across AI, space technology, drones and defense, and that we are only halfway through.
The recommended positioning follows: technology exposure through broad sector funds, rising-dividend income names, and energy midstream. Not a metals-heavy portfolio.
This framework is equally clear about how it ends. Applying Austrian business cycle theory, the easy-money era is understood to have produced a genuine speculative bubble — and the parable of wheat and tares captures the problem precisely. Legitimate transformative technology grows alongside easy-money-driven overvaluation, and the two cannot be separated until harvest. The assessment is that technology stocks could fall by half and still be overvalued, with an eventual unwind resembling the NASDAQ’s 70% decline from 2000 to 2003.
What triggers that unwind, in this framework, is not the debt. It is the Fed. Aggressive rate increases popped the dot-com bubble in 1999 and precipitated the 2008 crash. The same mechanism is expected next time — which is precisely why the gold thesis and the equity thesis are linked far more tightly than most investors appreciate.
Every gold article should contain the strongest available argument against gold. Here it is.
In 1980, with inflation raging, gold reached roughly $800 an ounce. It then collapsed and entered a bear market lasting approximately twenty years. The cause was not a change in the debt trajectory — debt grew throughout. The cause was Paul Volcker imposing genuinely tight money and raising rates sharply.
The warning is direct: if that happens again, gold could go down and stay down for a very long time. The qualifier that matters is equally direct — it has not happened yet. The Fed has not raised rates, even as the 30-year signals it should. But ‘not yet’ describes the present. It guarantees nothing about the future.
This is the invalidation condition that dwarfs all others. Not fiscal consolidation, not central bank selling, not a rival reserve asset. A determined central bank willing to hold real rates positive for years can and did produce a two-decade gold bear market while every fundamental argument for owning gold remained intact.
A second observation should reframe how anyone holds a position sized on extreme price targets.
Predictions of $6,000, then $17,000 gold, circulate freely. The problem is not that the numbers are impossible. It is that gold at that level — with silver near $200 — would not describe a prosperous world. It would describe a country, and a global system, in serious trouble.
And then there is the part almost nobody thinks through: in a scenario where Treasuries have no bid and the funding market has genuinely broken, you could not actually realize $17,000 an ounce. The price presupposes a functioning market, a solvent counterparty, and a currency in which to settle. The very crisis that produces the number degrades the machinery required to collect it.
Extreme gold targets are not bull cases. They are catastrophe forecasts denominated in dollars — and partly self-negating ones. Gold at $13,000 does not mean your portfolio won 200%. It means the currency your portfolio is measured in lost roughly two-thirds of its purchasing power, and your job, home equity, bonds and cost of living all repriced against you simultaneously.
The practical consequence is a shift in what gold is for. Positioning for $13,000 as a return objective means rooting for a crisis you must also live through. Positioning for gold as insurance against currency debasement supports the same allocation with entirely different psychology — you are not hoping to be right, you are hedging against being wrong about everything else.
That distinction determines position sizing more than any price target. Insurance is sized to the loss it covers. A return objective is sized to conviction. Confusing the two is how investors end up with 60% of a portfolio in metals and no capacity to hold through a 45% drawdown.
The crisis-threshold framing has an obvious weakness, and it should be stated plainly.
Several years ago, with gold near $1,500-1,700, the prevailing view was that $5,000 gold would require crisis conditions. Gold reached $5,600 and the world did not implode. The threshold argument was simply wrong on that occasion.
The explanation is that gold overshoots the same way equities do, and that the 40% expansion in money supply during 2021-2022 was by itself sufficient to drive the move — with the United States able to export much of that monetary inflation abroad precisely because the dollar is the reserve currency.
The honest conclusion: crisis-threshold logic is directionally right but not precise. Gold can travel considerably further than that logic suggests without a crisis arriving, because monetary expansion alone can carry it. That cuts in favor of the bulls on the path, and in favor of the skeptics on the destination.
Both frameworks converge on one point despite their differences: bear markets — including in gold equities, which can decline 50% or more — are opportunities to buy rather than sell, provided the long-term trend remains intact.
The driver is a policy trajectory, not a price trend. Refinancing $7 trillion annually at 125% debt-to-GDP does not reverse within an investment horizon.
The marginal buyer is price-insensitive. Central banks bought at $4,000 and bought more as it fell. They now hold more gold than Treasuries. That is a structural floor absent in prior cycles.
Corrections preceded every major advance. The 45% drawdown of 1974-76 and the 30% drop of 2008 both looked terminal at the time. Both marked the midpoint.
Supply is inelastic. Above-ground gold grows roughly 1.5-2% annually regardless of price, because discovery-to-production runs 10-15 years.

‘Buy every dip’ without invalidation levels is how investors averaged down into the 2011-2015 bear market — a 45% decline that occurred while US debt grew every single year. The 1980-2000 bear was worse and lasted a generation. Conditions, not slogans.
During a gold rush, the durable fortunes were made selling shovels. The modern equivalent is not a single instrument — it is a ladder, and each rung solves a different problem. Differences in cost, tax treatment and counterparty exposure are material over a multi-year hold.

What physical actually buys you: elimination of counterparty risk. No custodian, no trustee, no exchange, no settlement failure. That is the entire value proposition, and it is exactly what matters in the no-bid Treasury scenario. What it costs: 2-8% on entry, a comparable spread on exit, storage and insurance, and zero yield. Physical is insurance, not a trading vehicle.
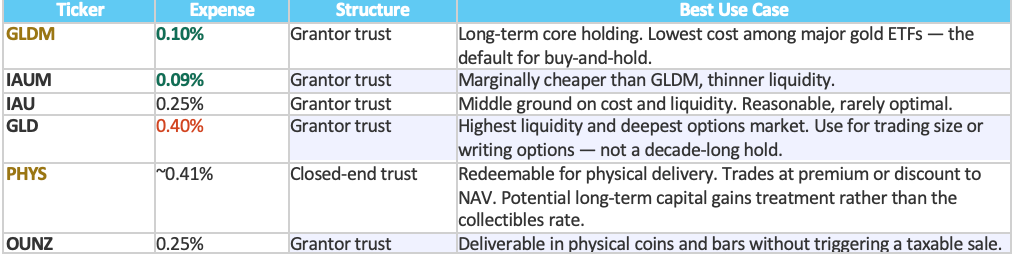
Tax note for US investors: physically-backed gold ETFs structured as grantor trusts (GLD, GLDM, IAU) are taxed as COLLECTIBLES — a maximum long-term rate of 28%, not the 15-20% applying to equities. PHYS, a Canadian closed-end fund, may qualify for standard long-term capital gains treatment with an annual Qualified Electing Fund election. Over a multi-year hold with a large gain, that difference dwarfs any expense ratio comparison. Confirm with a tax professional.
In 2025, gold rose 64.6% while gold mining equities rose 163.0% — roughly 2.5x torque. GDX gained about 123% year-to-date in 2025 against gold’s 51%.
That leverage cuts both ways, and gold equities can experience 50%-plus bear markets. Current technical work on GDX identifies an incomplete bearish sequence from the March 2, 2026 high with a downside target zone in the $33-59 range — miners can decline substantially even while the metal stabilizes.
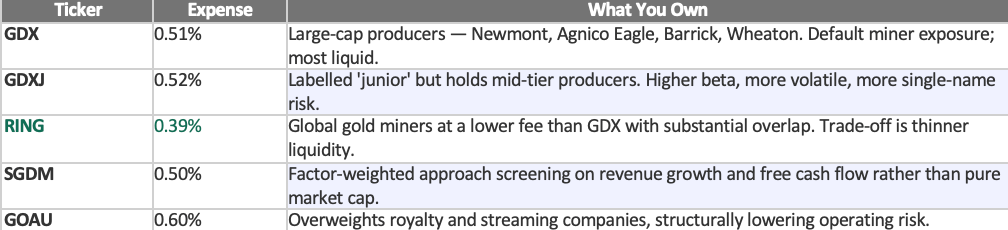
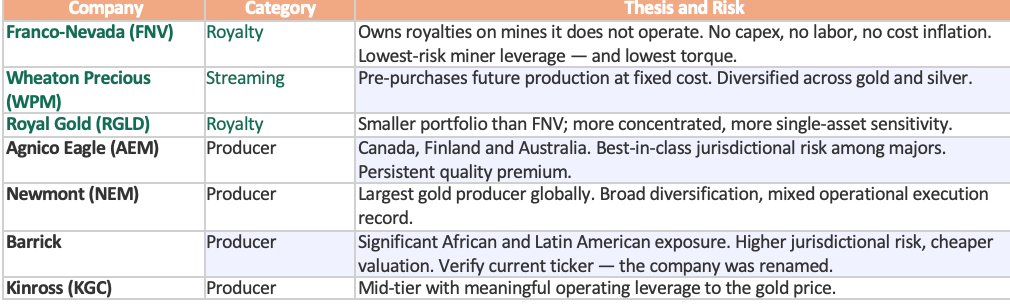
Royalties and streamers are the real shovels: revenue rises with the gold price while costs are contractually fixed. A conventional miner facing 8% energy and labor inflation sees margins compress even as gold rises. FNV, WPM and RGLD do not.
Silver reached a record near $116 in January 2026, collapsed roughly 50% into the mid-$50s during Q2, and had recovered toward $85 by mid-August. It is the most violent asset in the complex.
Silver enters its fifth consecutive year of structural undersupply per Silver Institute and Metals Focus forecasts. Roughly 60% of demand is industrial — solar photovoltaics, electronics, electrical contacts, and increasingly AI infrastructure. That industrial floor did not exist in prior monetary cycles.
Silver also carries a mechanical advantage: valued at January 2026 prices, annual gold mining output exceeds silver’s by roughly 6.5 times. A modest reallocation from gold investors into silver moves the price disproportionately, because the market cannot absorb the flow. Historically silver outperforms gold late in precious metals bull markets and underperforms sharply in corrections.
Major bank research has cut the silver outlook, arguing lower investment demand, softer industrial consumption and higher mine supply will dramatically narrow the deficit through 2026. Other desks flag overcrowded positioning and rank platinum and palladium as higher-conviction opportunities.
The industrial component is double-edged. In the recession both frameworks ultimately describe, roughly 60% of silver demand contracts precisely when the monetary case is strongest. Gold has no such vulnerability. Note also that crisis framings pairing $17,000 gold with $200 silver carry the same self-negating logic examined in Part VII.
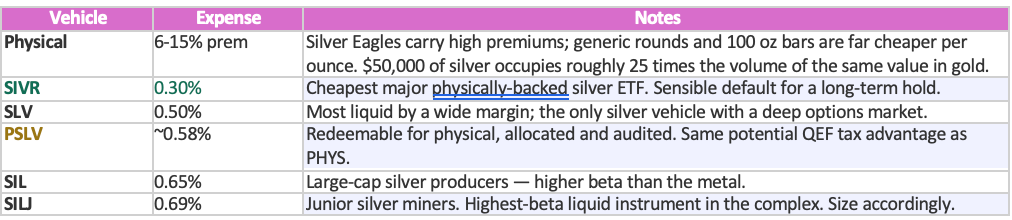
Individual names: Pan American Silver (PAAS) is the largest primary silver producer with diversified Latin American operations. Hecla Mining (HL) is the largest US-based primary producer with lower jurisdictional risk. Coeur Mining (CDE) and First Majestic (AG) offer higher operating leverage with correspondingly higher risk. Wheaton (WPM) provides silver exposure through streaming, avoiding operating risk entirely.
Platinum runs a persistent structural supply deficit. Production is heavily concentrated in South Africa, where operational disruptions and chronic power grid instability have repeatedly tightened availability. Industrial demand has been robust — catalytic converters remain the anchor, renewed Chinese consumption has added support, and strategic stockpiling has drawn investor interest.
The mining cost floor is the underappreciated feature. All-in production cost currently sits close to the bullion market price. When the marginal producer cannot profit, supply exits, supporting price. Gold has no such floor — its miners have been profitable across an enormous price range.
Institutional forecasts have lifted 2026 platinum projections toward an annual average near $2,063 per ounce, and several desks now rank platinum and palladium as their highest-conviction precious metals opportunities for 2026 — above both gold and silver.
EV transition. Battery electric vehicles use no catalytic converter. Every point of BEV share permanently removes demand. The bull case rests on hydrogen and hybrid growth offsetting it — real but unproven.
South African concentration. Supply concentration that tightens the market is also single-country political and infrastructure risk.
Liquidity. Combined platinum and palladium output is worth roughly one-thirty-fifth of gold’s. Spreads are wider and exits harder in stress.

These frameworks describe the precious metals sleeve of a portfolio, not a whole portfolio. Total metals exposure of 5-15% is a common institutional range — and it is worth noting that the diversified framework outlined in Part VI would sit at the low end of that, with the balance in technology and dividend equity.
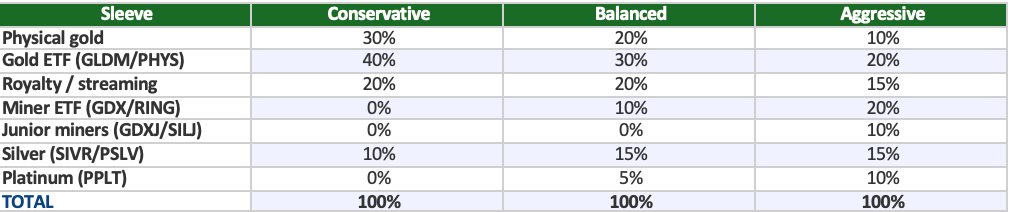
Physical is insurance; paper is the position. Physical solves for counterparty failure — the no-bid Treasury scenario. It is expensive to enter and exit and should not be traded. Above 30% of the metals sleeve is a lot of premium for insurance most investors never claim.
Royalties before producers, producers before juniors. FNV and WPM give most of the equity torque with a fraction of the operating risk. Juniors give the most torque and the highest probability of permanent capital loss. Move down the ladder only with capital you can lose entirely.
Metals are one sleeve, not the portfolio. A 10% annual cost-of-living increase is not beaten by gold alone; it is beaten by a diversified portfolio in which gold is the hedge and productive assets are the engine. Believing in permanent inflation is entirely compatible with holding technology, dividend growers and energy as the core.
The 1980 scenario is the one that matters. Volcker’s tightening produced a twenty-year gold bear market while every fundamental argument for owning gold remained intact. Debt grew the entire time. If the Fed proves willing to hold real rates positive for years, nothing else in this article saves the position.
Gold has had long dead periods more than once. From the 1980 peak it took 27 years to reclaim its nominal high. From 2011 to 2015 gold fell 45% while US debt grew every year. Debt growth is necessary but not sufficient.
Central bank demand is genuinely contested. The same period produces a record-buying narrative and a weakest-since-2022 narrative depending on source and methodology.
Miners are not gold. Gold equities can fall 50% or more. Technical work identifies a $33-59 downside zone for GDX. A correct gold call can still produce a losing miner position.
The moderate case may simply be right. Inflation capped at 3-4% under a money-supply-focused Fed, an equity bull market running to 2029-2030, and technology as the better vehicle is a coherent view — and it implies a much smaller metals allocation than gold-focused commentary suggests.
These are scenarios, not certainties. Every projection in this analysis is probability-weighted. Being directionally right about the macro and wrong about the timing is the most common way investors lose money in this trade.
The $40 trillion milestone is a headline. The $7 trillion annual refinancing requirement is the mechanism.
A government rolling over $7 trillion a year, paying $3.18 billion a day in interest, running deficits at 5.8% of GDP, and facing $2.1 trillion in projected annual interest by 2036 has three exits: growth that outruns the debt, austerity that shrinks it, or currency depreciation that inflates it away. The first is arithmetically implausible at this scale. The second has no political constituency. The third requires no legislation and no vote.
The bond market has already begun choosing. A 30-year auction clearing at a 25-year high yield, a Fed chair explaining that the market tightened on the committee’s behalf, and a Treasury Secretary warning that the funding market could unravel — these are the same story told three ways.
The most important evidence remains behavioral: in the exact quarter gold fell 16%, central banks bought a record 288.9 tonnes, and the official sector now holds more gold than Treasuries. Institutions with no benchmark and multi-decade horizons accelerated into weakness. Retail sold the dip. Sovereigns bought it — and quietly reversed a reserve hierarchy that had stood for generations.
But hold the position for the right reason, and size it for the right outcome. The strongest argument in this entire analysis is not the bull case. It is that gold at $17,000 describes a broken world — and that in a genuine Treasury no-bid crisis, you could not actually realize that price anyway. Own gold as insurance against a cost of living rising roughly 10% a year while official statistics report 3.4%. Insurance is sized to the loss it covers, and that discipline is what lets you hold through the drawdowns this asset has delivered twice — once for four years, once for twenty.
Dips are accumulation opportunities while three conditions hold: suppressed real rates, a continuing debt trajectory, and a persistent official-sector bid. Check them at every tranche. The first is the one that killed gold in 1980, and it is the one the Fed could change at any meeting. That is what separates an investment thesis from a slogan.
Data and Methodology
Fiscal data is sourced from the US Treasury, the Congressional Budget Office and the Joint Economic Committee. Precious metals demand and central bank reserve data is from the World Gold Council. The long-run inflation series referenced in Part III draws on published work by Reinhart and Rogoff. Price levels, expense ratios, fund structures and dealer premiums are point-in-time as of mid-August 2026 and change continuously. Institutional price forecasts referenced are the published views of the firms concerned and are included for context rather than endorsement.
Disclaimer
Tasty Stocks is not a licensed financial advisor. The information presented is for educational and analytical purposes only and is not a recommendation to buy or sell any security or commodity. Precious metals are volatile and can decline substantially — gold fell 45% between 2011 and 2015, and following its 1980 peak entered a bear market lasting roughly two decades. Mining equities carry additional operational, jurisdictional and management risk beyond metal price exposure, and can lose value even when the underlying metal rises. Expense ratios, premiums and price levels are point-in-time and change continuously — verify against issuer documentation before acting. Tax treatment of precious metals vehicles is complex, varies by structure and jurisdiction, and requires consultation with a qualified tax professional. Always conduct independent research and consult a qualified financial professional before making investment decisions. Past performance does not guarantee future results.
No posts
Comments
Nothing yet. Say the first thing.
Sign in to join the conversation.