
It’s that time of year again: the first real mile-marker of the NHL season. For decades, analysts, talking heads, and fans have sworn by the power of American Thanksgiving as a line in the sand: be in a playoff spot (or at least knocking loudly on the door) by late November, or start prepping for the draft lottery.
Last year, I wanted to know whether that long-held belief was anything more than an anecdotal cliché. So I built a model. And, to my own shock, it actually was rooted in truth. Looking at past seasons, then comparing those trends to where teams stood at Thanksgiving last year, the numbers showed that teams sitting in a playoff spot by Game 20–22 had roughly a 75% chance of securing a postseason berth. Myth: confirmed…sort of.
This season, I wanted to raise the bar. I expanded the data, strengthened the methodology, and pushed the model to answer more specific, more demanding questions.
To make this year’s version more accurate (and more fair) I upgraded the training data in several important ways:
A significantly more complete scrape of play-by-play data
Special teams metrics collected and aligned at the game level
Training data split at the Thanksgiving cutoff vs. season-end results
Six seasons of full, “normal” NHL schedules (no pandemic anomalies)
I wanted apples-to-apples comparisons. That means the dataset used to train the model needs to look exactly like the data pulled from Thanksgiving this season.
I also removed the COVID seasons. Between irregular schedules, divisional realignments, and condensed play, those years were statistical outliers; interesting, but not helpful.
And the cleanest, most complete historical data I scraped stretches back to 2014-2015, so the model is living in that window.
With more robust and higher-quality inputs, the model became more conservative and less chaotic. Variability shrank.
For example:
Teams that were teetering last year (only a point in or out) now fall into tighter margins. The risk bands have narrowed. That means bubble teams are at greater risk of falling out, and teams slightly behind are being evaluated more critically.
In short: teams need a slightly larger cushion to be considered “safe.”
But there’s a twist.
In the West, being two points out at Thanksgiving this year gives a team a better chance of climbing in compared to last year. In the East, nothing really changes; the chaos levels remain high, as usual.
Overall:
East playoff probability at Thanksgiving: 76%
West playoff probability at Thanksgiving: 78%
Those numbers fluctuate year by year, but the trend remains consistent: the East has more volatility; the West is more predictable.
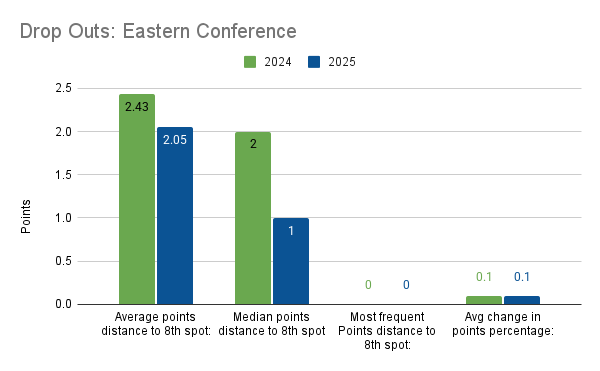
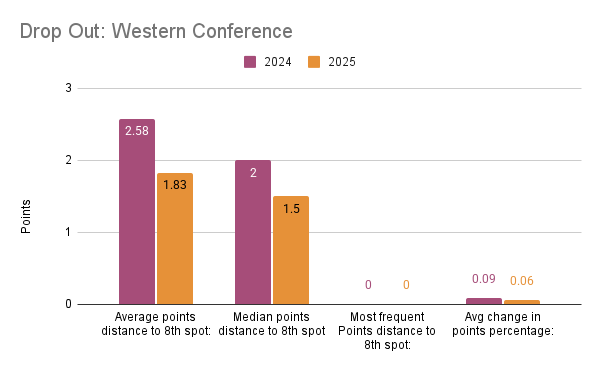
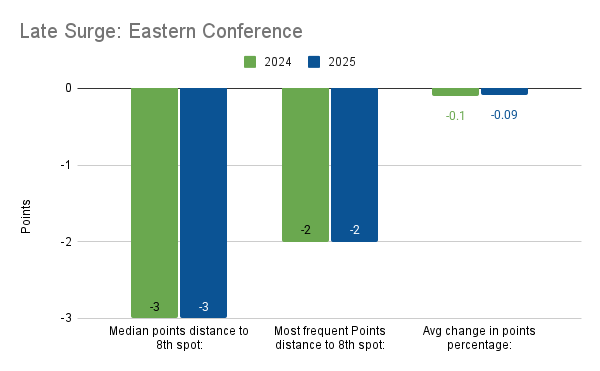

No one will be shocked: Colorado, Tampa Bay, and Dallas are in the strongest position.
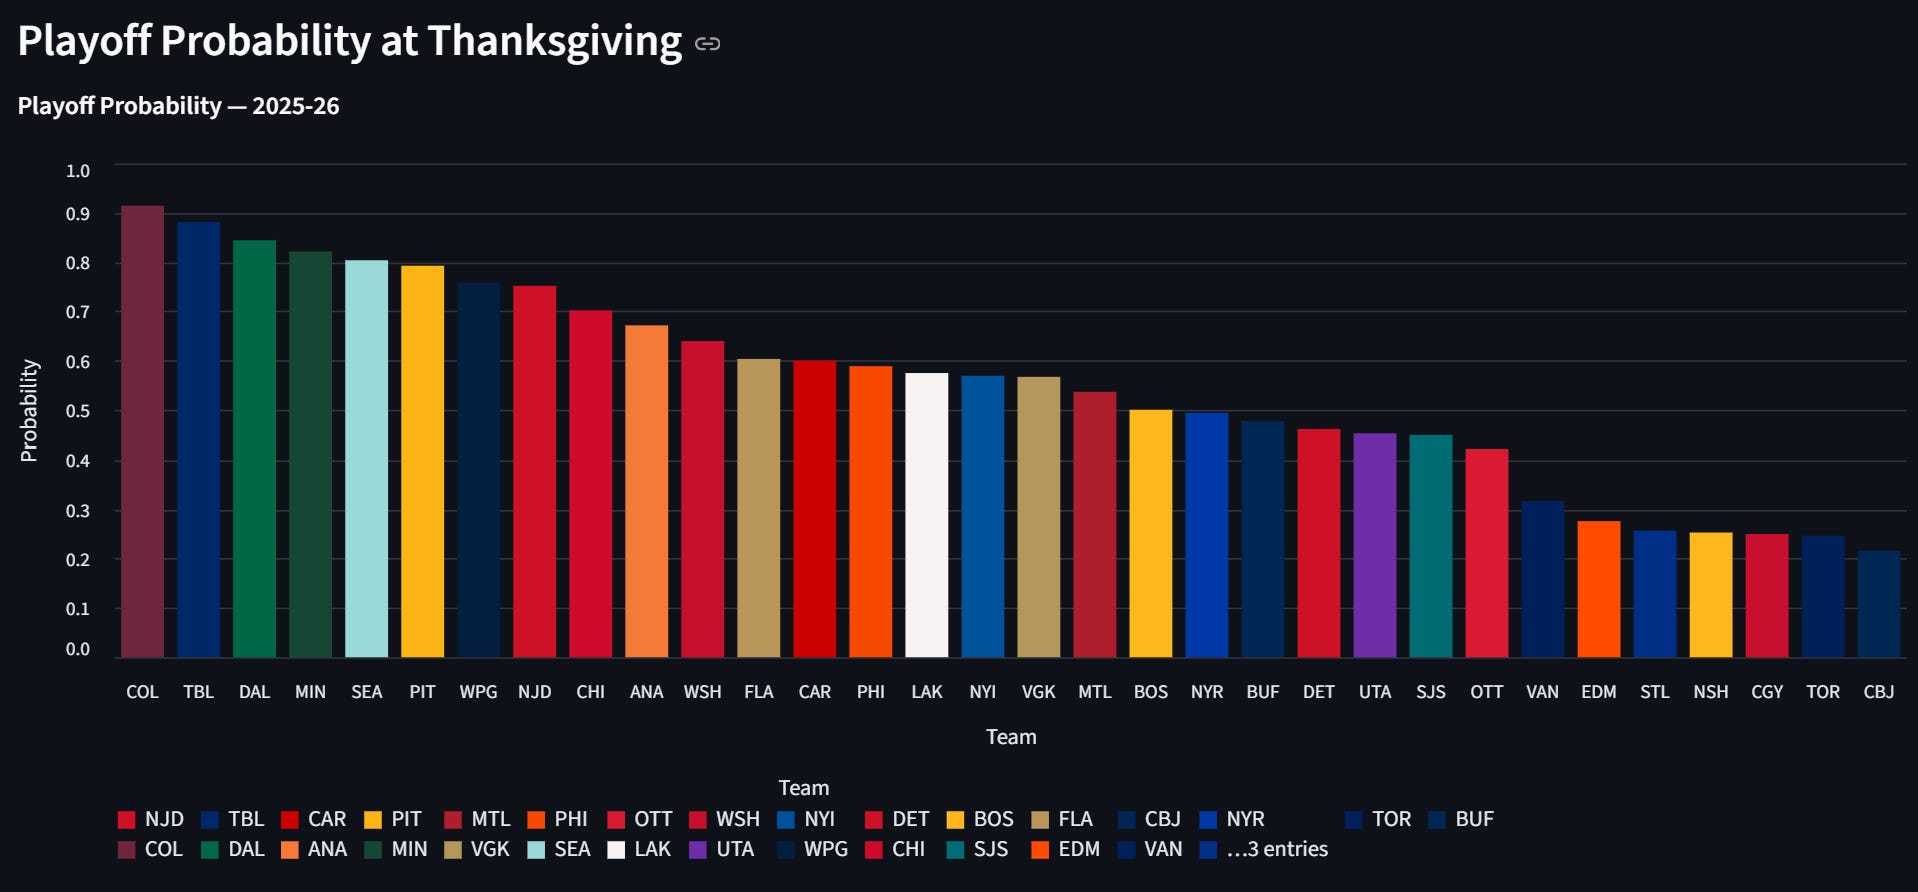
Colorado, in particular, entered Thanksgiving with a 91% chance of making the playoffs.
On the other end of the spectrum, St. Louis, Toronto, and Columbus were almost guaranteed to miss. But remember: “almost” is not “certain.” Historic outliers prove that dramatic jumps happen:
2015–16 Flyers: climbed in from -6 at Thanksgiving
2023–24 Oilers: surged from -10 to make the playoffs
Nothing is sealed in November… it’s just heavily foreshadowed.
To define a proper bubble team, I used both algorithms (Random Forest and XGBoost). A team becomes a bubble when:
Its consensus playoff odds fall between 0.35 and 0.75, and/or
The two models disagree by 0.20 or more on their playoff probability
That disagreement is the basis of the Bubble Risk Index. A team can be “projected in” but still be classified as unstable.
Utah, LA, Anaheim, Vegas, San Jose
Yes, that San Jose.
The surprise here is that LA, Anaheim, and Vegas all had 100+ projected points at Thanksgiving, yet their risk flags still triggered.
Islanders, Flyers, Rangers, Panthers, Red Wings, Capitals, Hurricanes, Bruins, Canadiens, Sabres, Senators, Penguins
If you watch Eastern hockey, this will not surprise you. The conference is a blender every season, and the model reflects that. Five of these teams also had 100+ projected points.
These bubble tags aren’t about vibes, they’re about the underlying data that triggered red flags in the model.
The biggest culprit this season?
PDO is the sum of a team’s shooting percentage and save percentage at even strength, used as a quick indicator of whether a team is riding good luck or bad luck. But don’t let the phrase ‘luck’ fool you. PDO can be dragged down by:
Low shooting percentage: not finishing chances, poor shot quality, or cold streaks from key scorers
Low save percentage: goaltending struggles, defensive breakdowns, or facing too many high-danger chances
Extended time spent on the penalty kill: opponents get higher-quality looks, dragging down team save percentage
Allowing excessive rush chances or odd-man breaks: increases high-danger shots against
Injuries to top scorers or starting goaltenders: reduces finishing ability and shot suppression
Poor special teams transitions: turnovers on the PP or PK leading to quick, high-danger attempts against
Heavy defensive-zone time: fewer controlled exits results in more shots against and lower-quality shots for
Bad puck luck: posts, whiffs, deflections off skates, weird bounces, etc
It’s what’s dragging down teams like Vegas, Ottawa, Boston, Carolina, and several others.
Meanwhile:
LA is flagged primarily because of low shooting percentage
NY Islanders are flagged because of their lack of net power play percentage
Every bubble team has at least one structural weak point the model interprets as a significant risk. Think of the Bubble Risk Index as a warning:
“If this issue doesn’t improve, this team is vulnerable.”
I’ll be releasing the full dataset, charts, and team-by-team breakdowns in an interactive site by the end of the year.
Make sure you’re subscribed so you don’t miss the full release.
So Who is Looking Safe?
It should be no surprise that Colorado, Tampa, and Dallas are in the best shape. In fact, Colorado had a 91% chance of making the playoffs at Thanksgiving this season. At the other end, teams like St.Louis, Toronto, and Columbus are almost a guarantee out. But, just because there is a very high or very low probability by late November, doesn’t mean a 100% certainty. Since the 2013-2014 season, the biggest jump in the East was made by the 2015-2016 Philadelphia Flyers (-6 points out at thanksgiving) and in the West the 2023-2024 Edmonton Oilers (-10 points out at Thanksgiving).
Who is on the Bubble?
First, a note on how a Bubble team is defined in the model. I ran two different kinds of algorithms (a random forest and xgBoost). A bubble is defined as consensus odds are between 0.35 and 0.75 and/or the random forest and XGboost disagree strongly (i.e., there is 0.20 or more absolute difference in the playoff probability). This is the “bubble risk index”. A team might be listed as “making the playoffs” and still be a bubble team - because of the bubble risk index.
There are obly 5 teams in the West that can be classified as bubble teams - Utah, LA, Anaheim, Vegas, and San Jose (wow). This might be a big surprise, especially considering that LA, Anaheim, and Vegas all had 100+ projected points values at Thanksgiving.
In the East, 12 teams have a bubble risk index - which is no surprise to us at this point. The NY Islanders, Philadelphia, NY Rangers, Florida, Detroit, Washington, Carolina, Boston, Montreal, Buffalo, Ottawa, and Pittsburgh all have a bubble risk index value. And just like in the West, there are teams that had a 100+ points projection at Thanksgiving (5 teams).
So what does this mean in reality?
These teams are on the bubble because of how the two algorithms evaluate and weigh the different variables. Something in the data for each team tolld the model that it was a liability and could sink the team if not corrected or if it gets worse. A lot of these teams are at risk beacuse of their PDO value.It’s certainly what plagues Vegas, Ottawa, Boston, and Carolina (among other teams). But some teams might sink because of their shot percentage (LA) or their lack of power play (NY Islanders).
The full data will be available by the end of the year in an interactive website, so make sure you are subscribed so you dont miss it!

Like what you read? Check out these other posts:


Comments
Nothing yet. Say the first thing.
Sign in to join the conversation.