
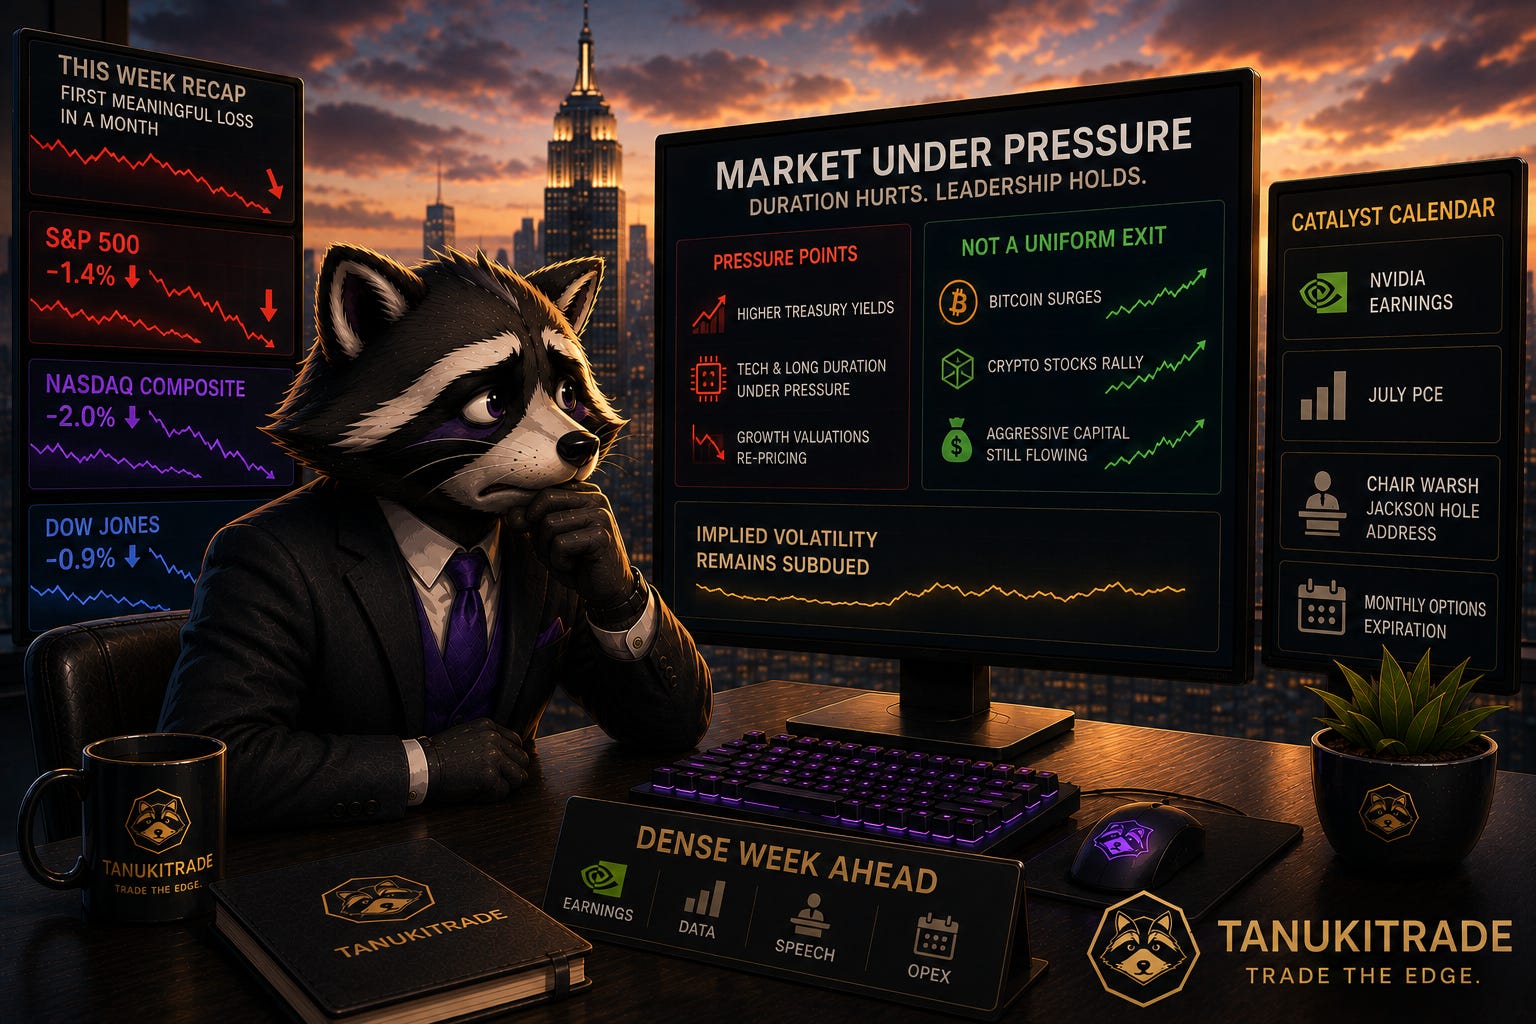
The market enters the new week with its first meaningful loss in a month and a much denser catalyst calendar ahead.
The S&P 500 fell about 1.4% and the Nasdaq Composite lost roughly 2.0%, ending three-week winning streaks for both indexes. The Dow declined about 0.9% for a second consecutive weekly loss. Friday's rebound improved the close, but it did not reverse the pressure that higher Treasury yields placed on technology and other long-duration assets.
This was not a uniform exit from risk. Bitcoin surged, crypto-related stocks rallied, and parts of the market continued to attract aggressive capital. The weakness was concentrated where valuation and duration are most exposed to the bond market.
Now the tape has to process Nvidia earnings, July PCE, and Chair Warsh's first Jackson Hole address after monthly options expiration. Implied volatility remains subdued. The event calendar does not.
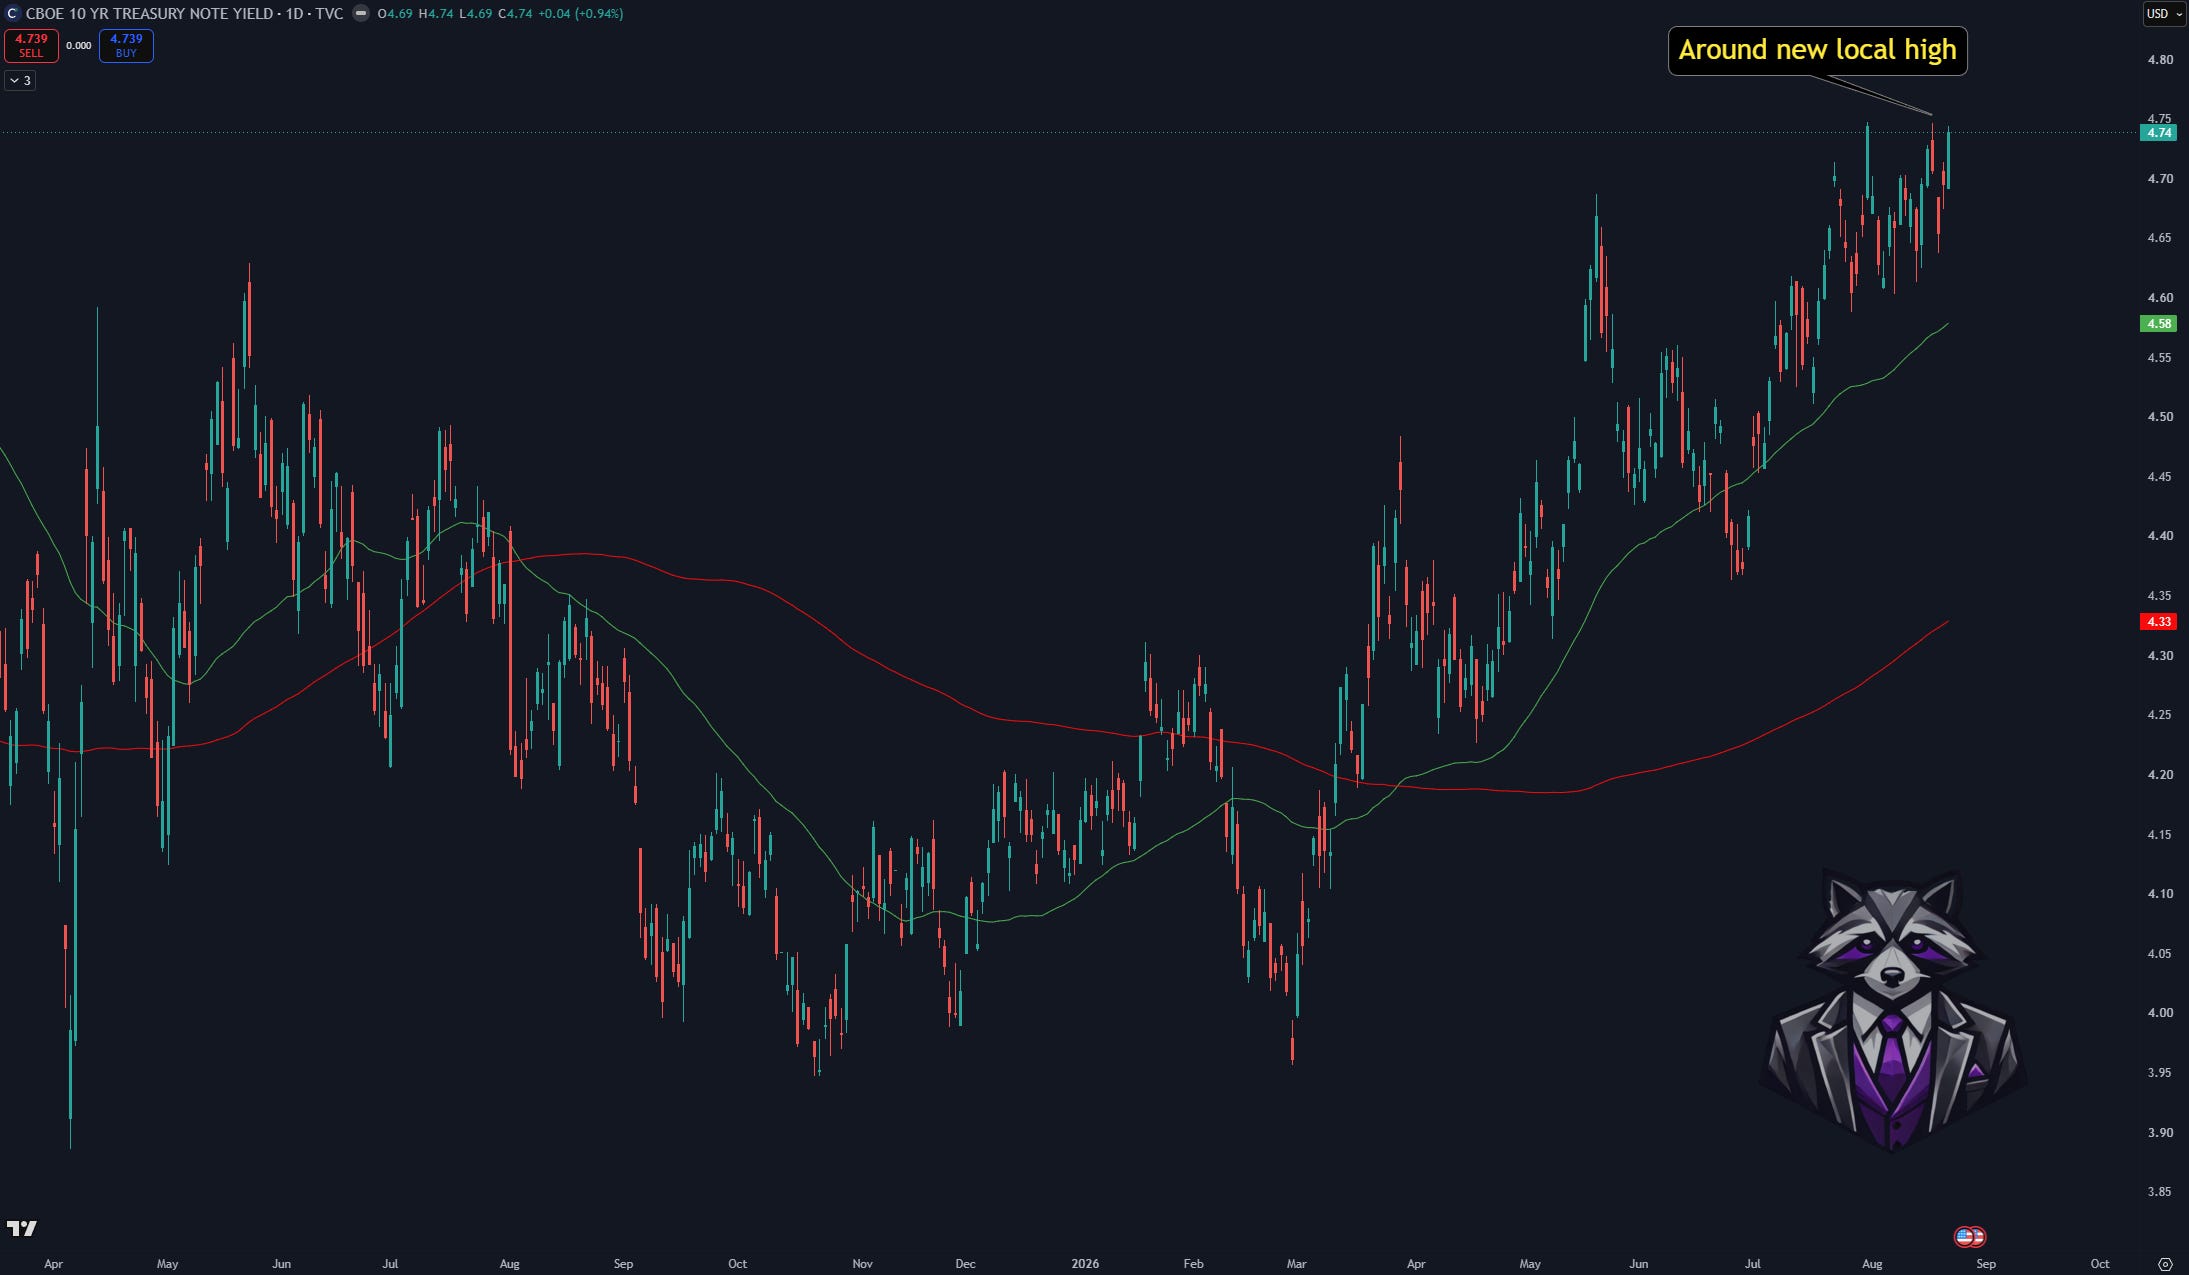
The bond market set the tone last week and remains the main transmission channel for the week ahead. The 10-year Treasury yield finished near 4.73% and the 30-year moved toward 5.27%, its highest area since 2007; a larger Treasury buyback briefly pushed yields lower, but the relief faded as the long end recovered.
Walmart's roughly 9% decline added a consumer warning while the market was already reassessing the cost of capital and the durability of growth. Oil added a second pressure point, with Brent up about 6.4% and WTI roughly 5.7% as Middle East supply risk returned. Higher crude does not restart the inflation trade by itself, but it gives the rates market less room to relax.
Technology absorbed most of the damage. The Philadelphia Semiconductor Index lost about 5%, and the Nasdaq returned to its 50-day moving average after the yield-driven decline. Bitcoin moved the other way and lifted several crypto-related names by 20% or more. That split looks more like an aggressive rotation in risk than a broad exit from it.
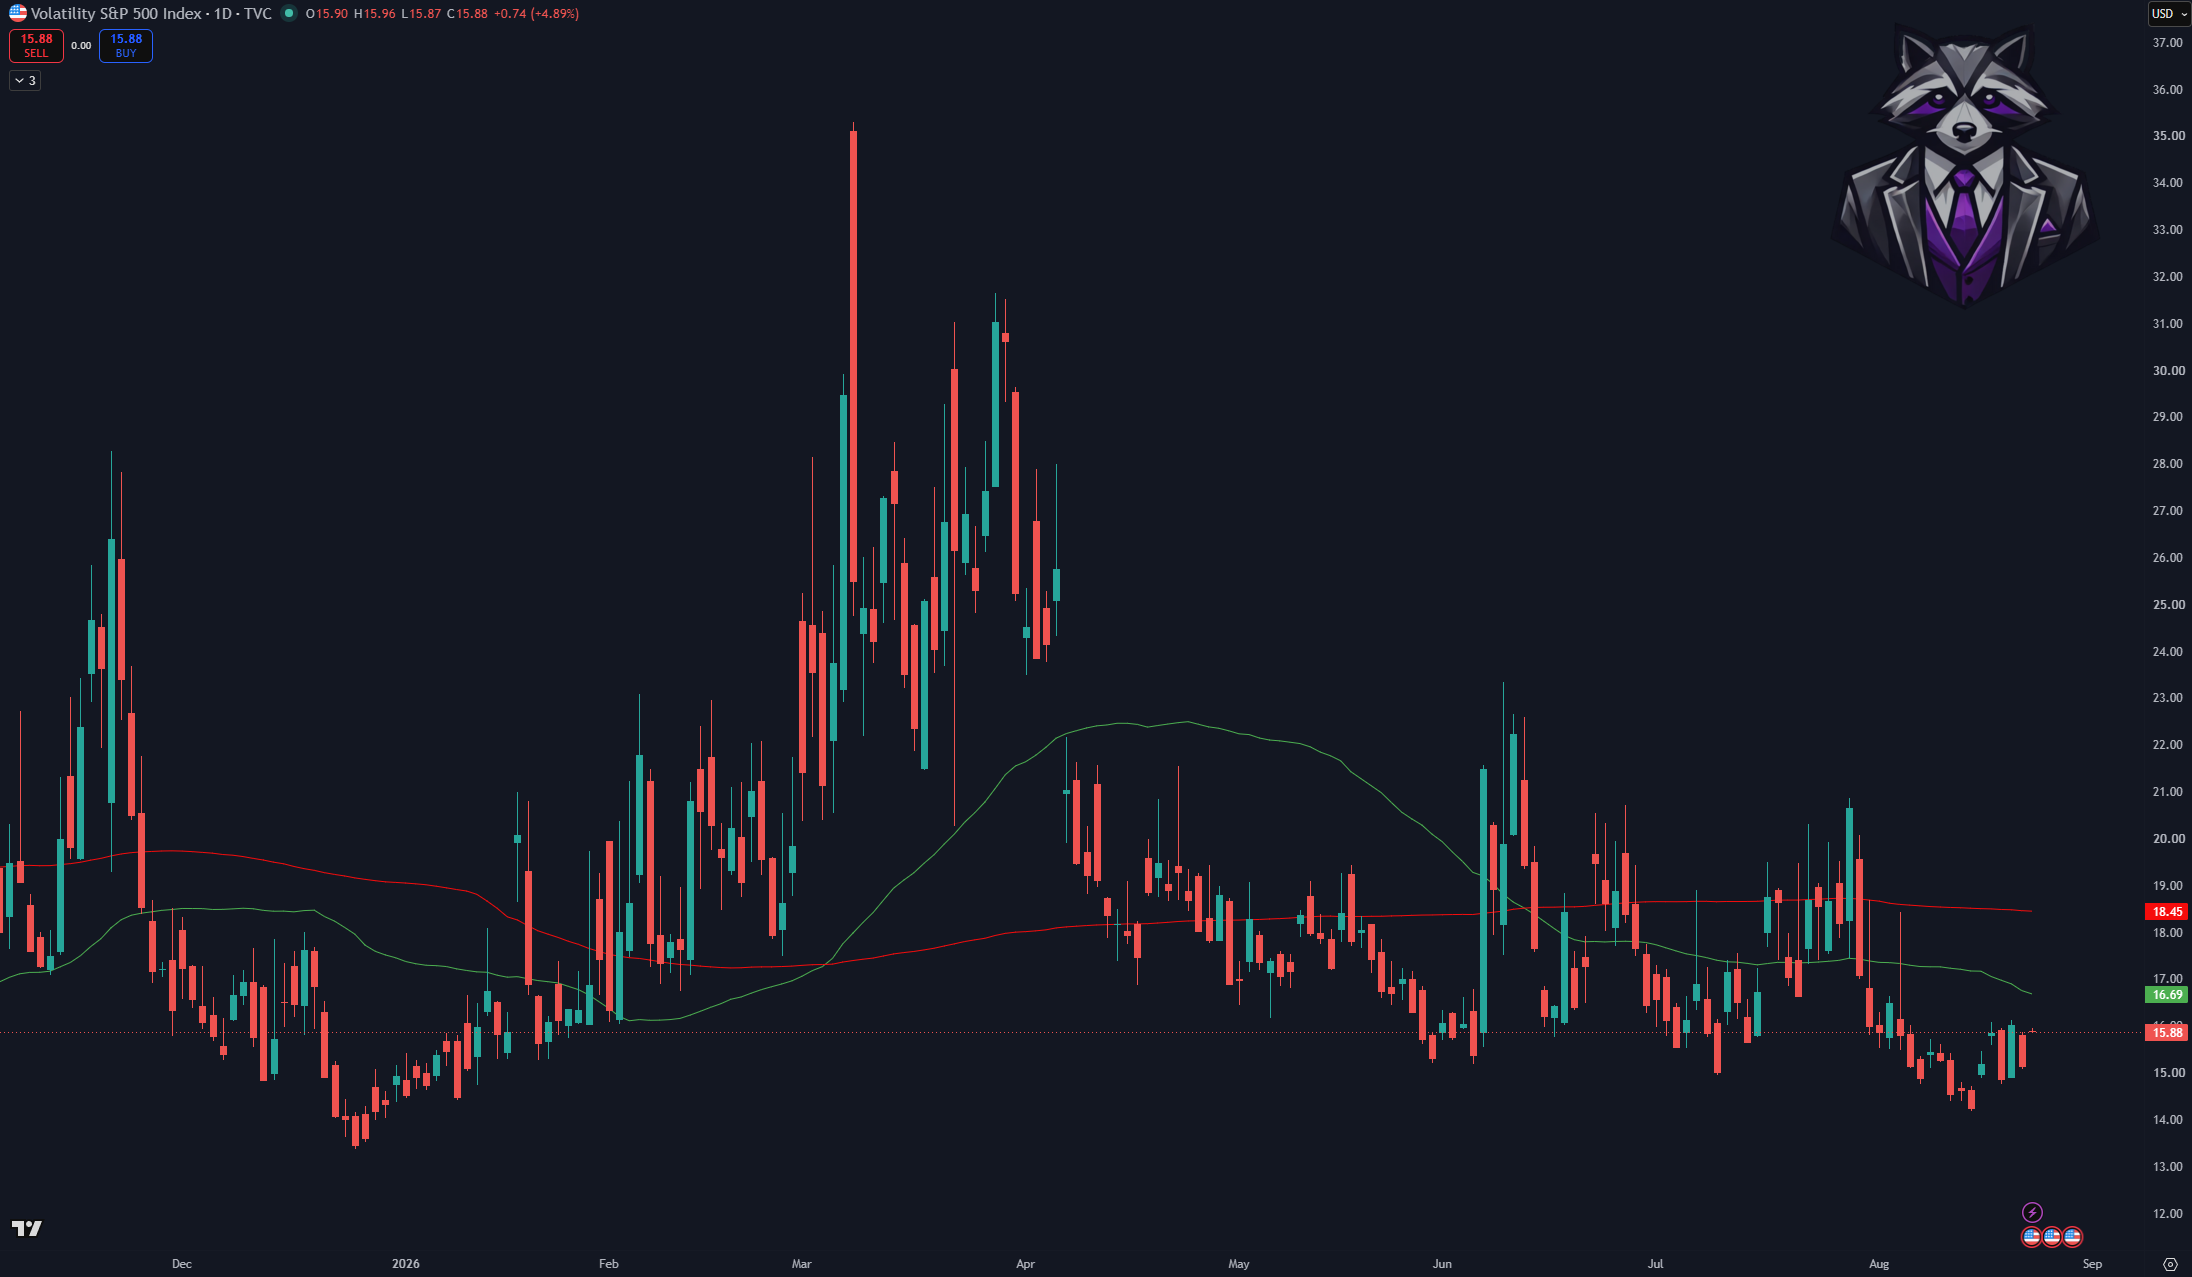
Volatility rose during the selloff, yet the VIX still finished near 15 after Friday's rebound. The options market continues to price a manageable environment rather than sustained stress.
Monthly options expired on Friday, removing part of the positioning that had helped contain recent index movement. The next gamma profile now has to rebuild around fresh strikes and fresh event exposure. That does not guarantee a volatility spike, but it can make the market more responsive when new information forces hedges to adjust.
The compressed setup now meets July PCE, Nvidia earnings, and Jackson Hole in the same week. Chair Warsh will test the rates narrative, while Nvidia will test whether AI growth can still support premium valuations at a higher cost of capital. If yields settle and earnings hold, low volatility can support a controlled recovery. If either side disappoints, the next move may travel faster than the last one.
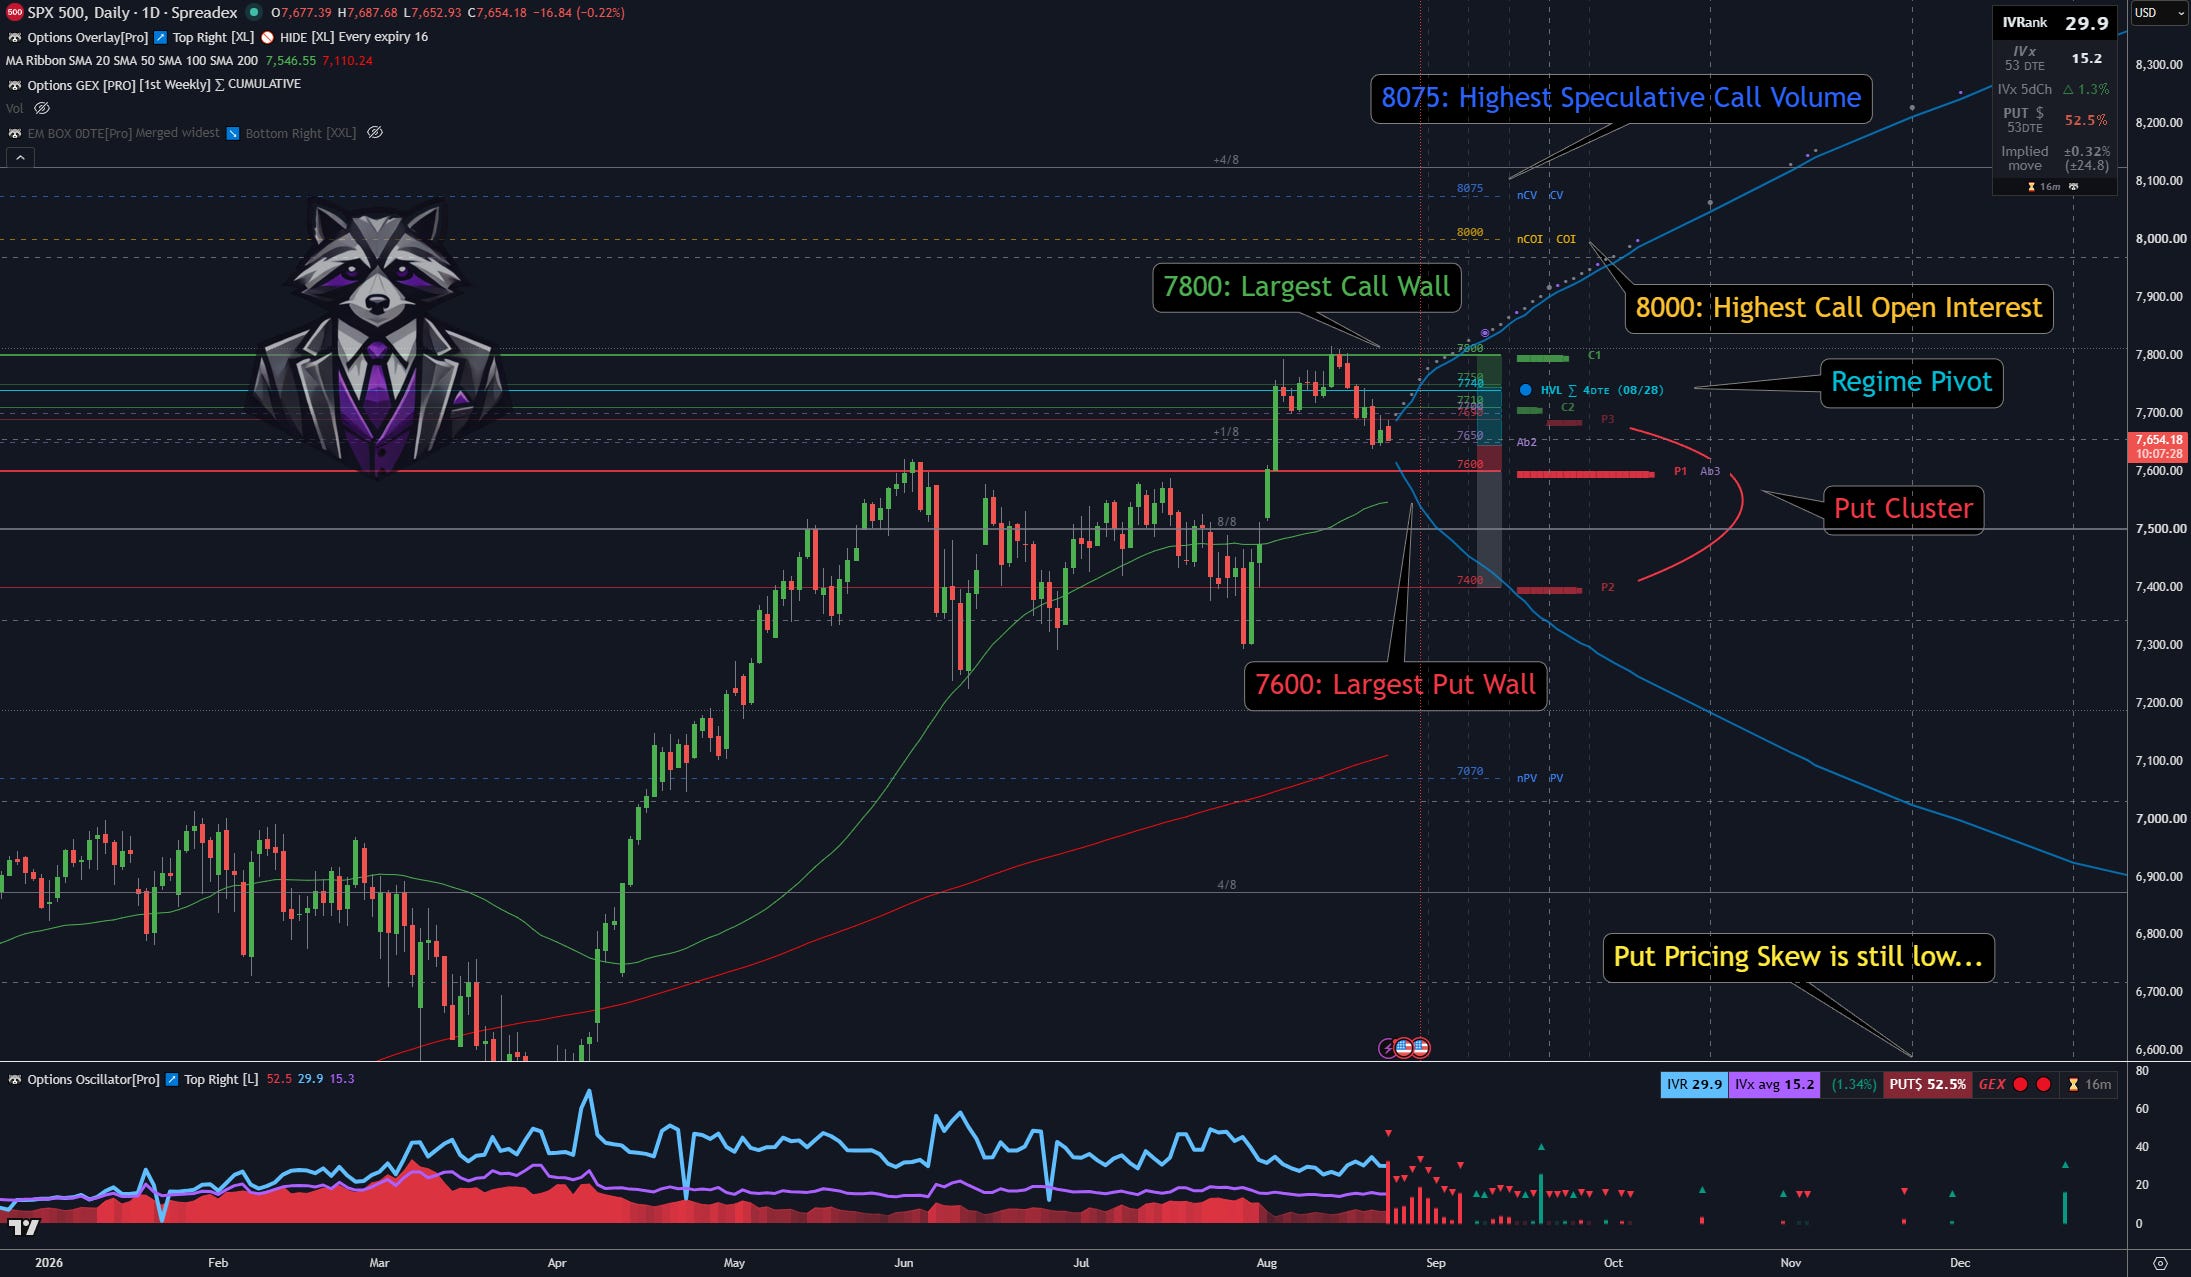
SPX sits near 7654.93 on the August 28 cumulative profile, below the 7740 HVL gamma flip. That places the index in a negative GEX regime, with price starting the week just above the 7645 lower transition boundary and the 7600 Put Wall.
🔵 Regime
· 7740 HVL — gamma flip and primary regime pivot
· 7645 pTrans — lower transition boundary near current price
🟢 Call GEX
· 7710 C3 — first call-side reference above spot
· 7750 C2 — sits just above the gamma flip
· 7800 C1 — Call Wall and largest cumulative call NETGEX
🔴 Put GEX
· 7600 P1 — Put Wall and largest cumulative put NETGEX; the price chart also marks this as a prior breakout high that may act as technical support
· 7400 P2 — next major put-side reference if 7600 fails
⭐ Call OI and volume
· 8000 COI + nCOI — largest call open interest and net call open interest
· 8075 CV + nCV — strongest call-volume concentration, including the August 28 expiry
📊 Panel
· IVRank 29.9 · IVx 15.2 · IVx 5d change +1.3% · PUT$ 52.5%
· Put pricing remains relatively restrained despite the negative GEX backdrop. The options market reflects caution, not panic.
🟢 Upside Scenario — Reclaim the Pivot
An upside recovery first needs to clear 7710 C3 and then reclaim 7740 HVL. Holding above the 7740-7750 area would move SPX back into a more supportive regime and place 7800 C1 in focus. Sustained acceptance above the Call Wall would shift attention toward the large call open interest at 8000 and the speculative call-volume peak at 8075.
🔴 Downside Scenario — Test the Breakout Support
Failure to reclaim 7710 and 7740 would keep the index in negative GEX and leave 7600 P1 as the main downside test. That strike is reinforced by the prior breakout high on the price chart, so it has both options-based and conventional technical relevance. A clean break below 7600 would weaken that support and expose the lower put structure toward 7400, with negative gamma increasing the risk of wider intraday swings.
🔹 What the Current Structure Tells Us
The profile is fragile, but it is not one-way bearish. SPX is below the gamma flip while sitting only about 55 points above a Put Wall that also aligns with prior price structure. The key range is 7600-7740. Holding 7600 can keep the pullback contained, while reclaiming 7740 would restore a more constructive regime.
Amazon, IBIT, and Nvidia enter the week with three different structure tests. Amazon is sitting at its gamma flip, IBIT has surged into a call cluster, and Nvidia faces earnings near its regime pivot.
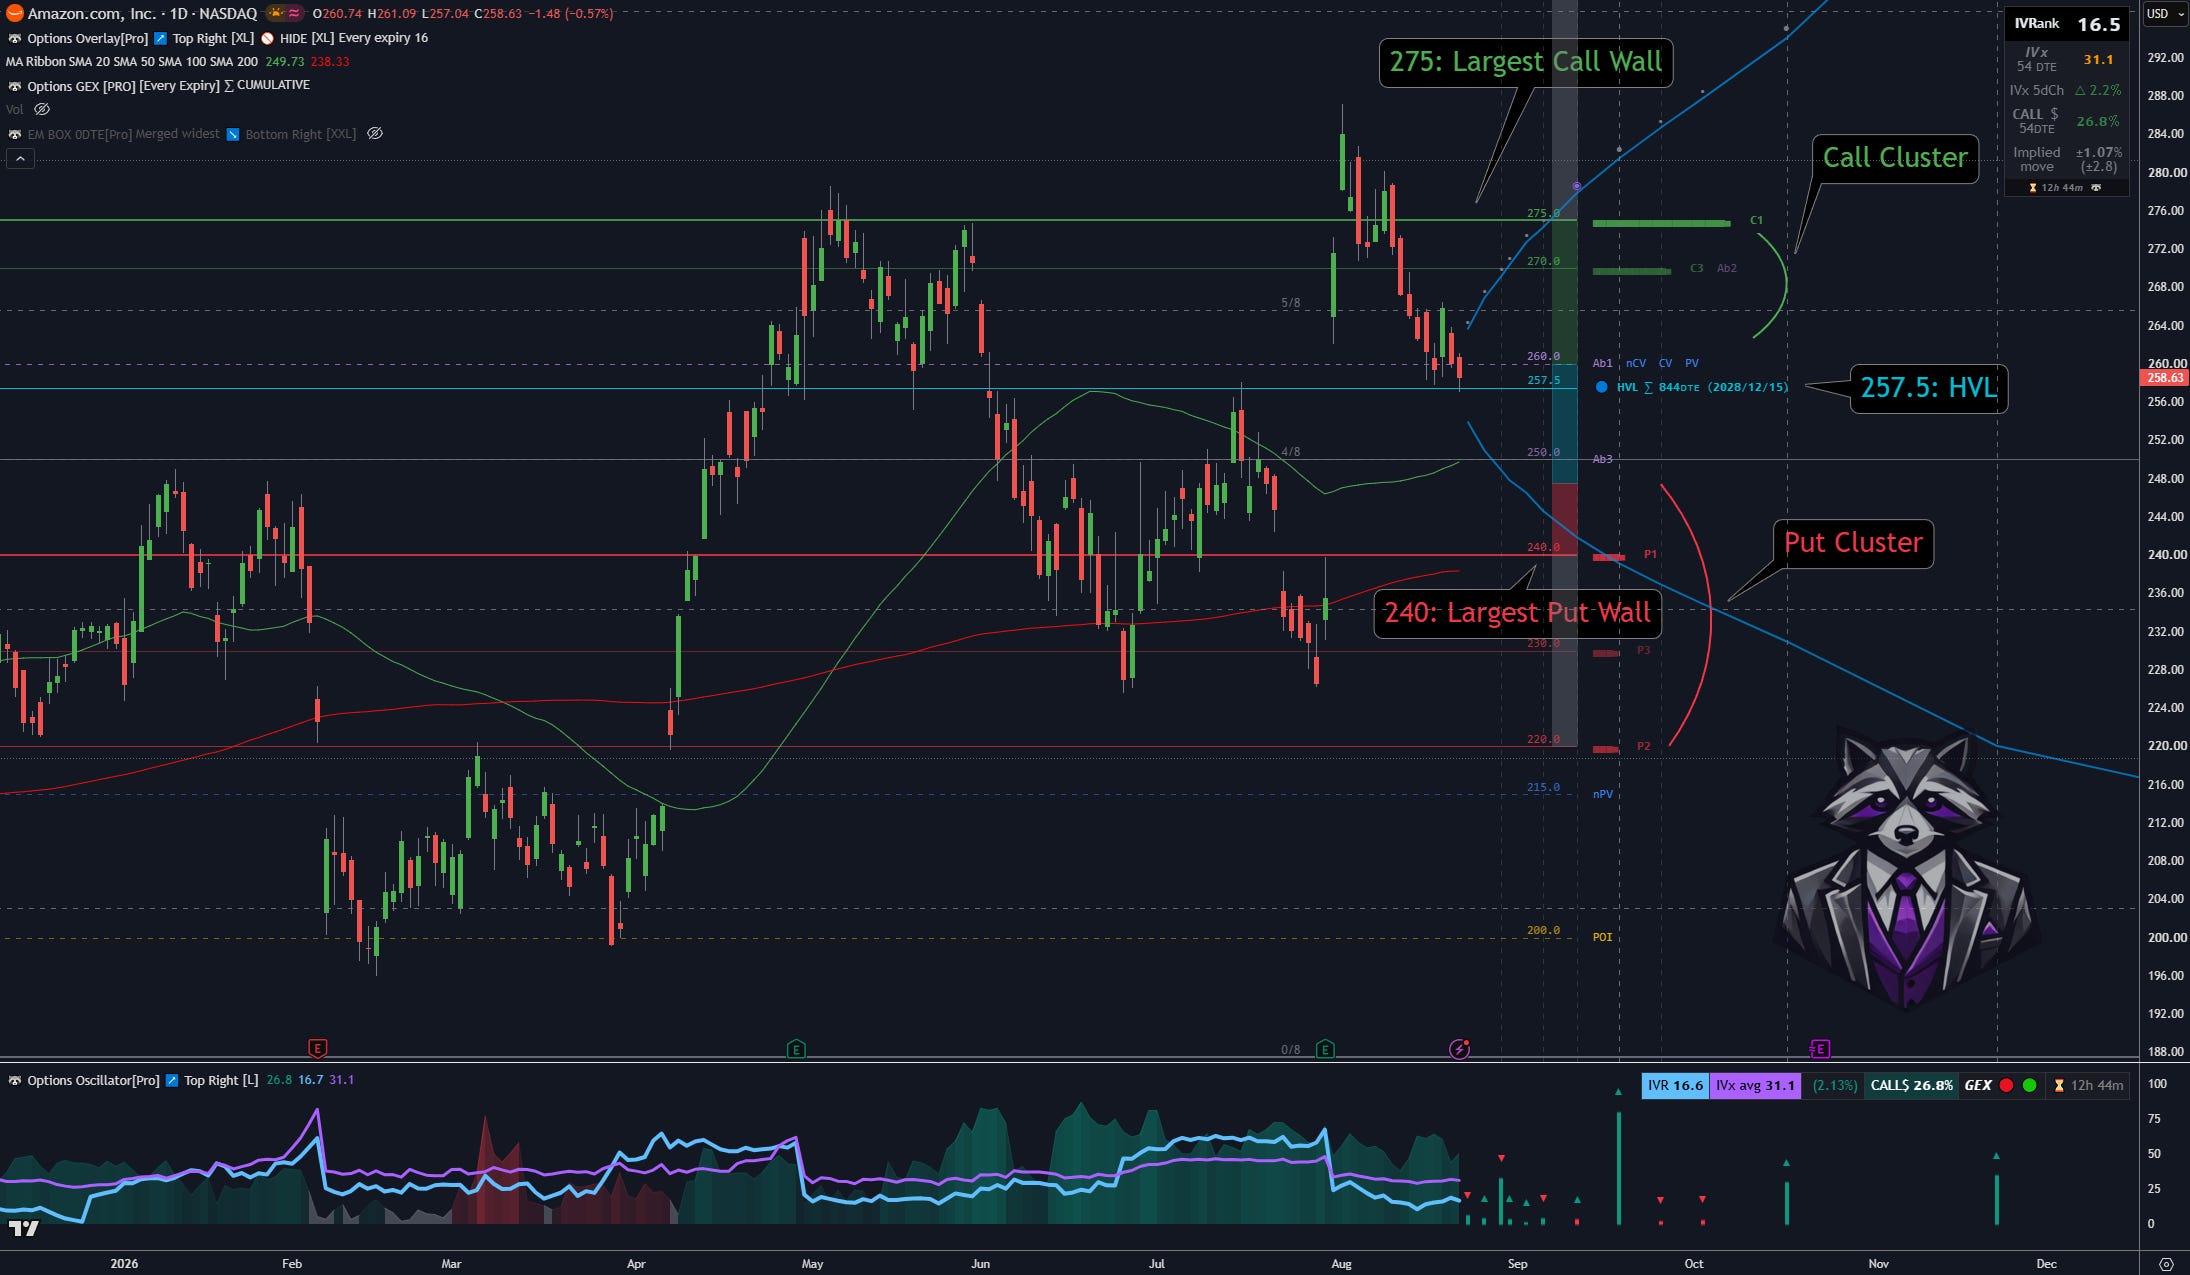
On the long-dated December 15, 2028 profile, HVL sits at 257.5. Spot near 258.6 is resting almost directly on that line. Amazon remains in positive GEX while price holds above HVL, but the margin is now very narrow. This is a regime test rather than a comfortable positive-gamma setup.
The 260 strike is the first area to watch above the flip. It carries Ab1, the largest absolute GEX, and the strongest call-volume concentration on the chart. That places the heaviest nearby gamma and the most active call flow just above current price. A recovery through 260 would move Amazon back above that immediate inventory cluster and improve the quality of an HVL hold.
The larger call structure sits higher. The 275 strike is C1, the Call Wall and largest call NETGEX, with the broader call cluster building into that area. On the downside, 240 is P1, the Put Wall. The distance between HVL and P1 leaves a meaningful gap in the lower map if 257.5 fails.
For now, the earnings gap has been filled and the positive GEX regime is still intact. The next information comes from how price behaves around 257.5-260. Holding that zone would keep the recent decline inside a constructive reset. Losing HVL would move Amazon into a less stable gamma environment and shift attention toward the put-side structure below.
IBIT is BlackRock's iShares Bitcoin Trust ETF, a spot Bitcoin product. It holds bitcoin and is designed to reflect the asset's price before fees and expenses, giving investors exchange-traded exposure through a regular brokerage account. It removes the need to manage a crypto wallet, but it still carries Bitcoin's volatility, tracking, custody, and gap risk.
The catalyst for last week's rally started in the bond market. The Treasury said it would at least double selected long-dated bond buybacks, which briefly pushed long yields lower and weakened the dollar. Bitcoin reacted strongly to that easing signal. The move then accelerated as roughly $2.7 billion of crypto shorts were liquidated and spot Bitcoin ETFs attracted heavy inflows. IBIT captured a large share of that demand. The bond move was the trigger, while forced covering and ETF buying supplied the follow-through.
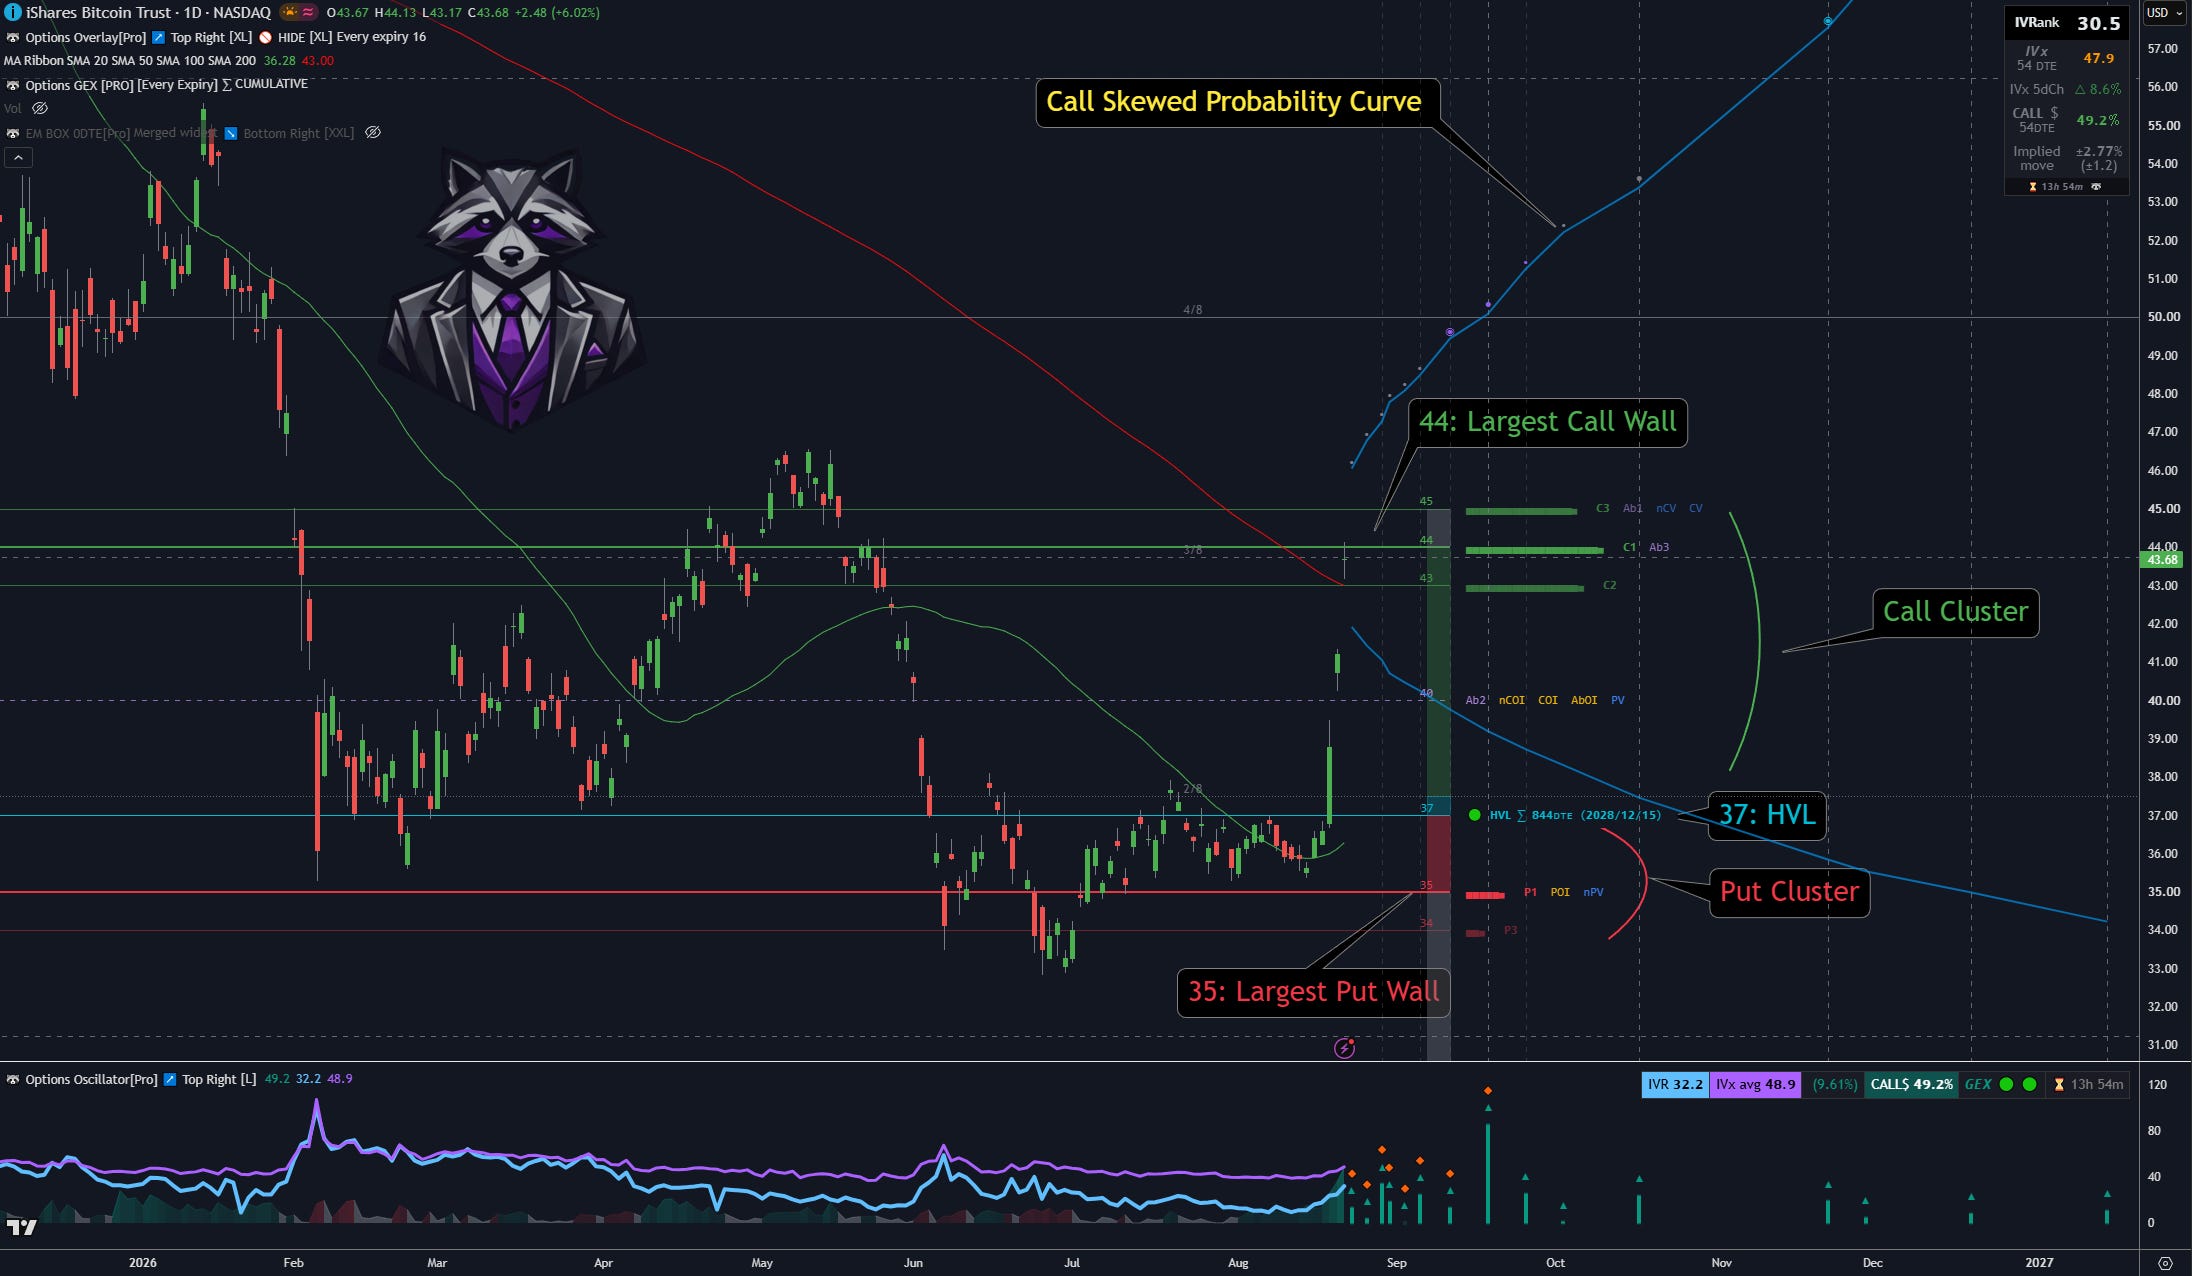
The long-dated December 15, 2028 GEX map shows IBIT arriving at resistance with momentum still intact. Spot near 43.65 is directly under 44 C1, the Call Wall and largest cumulative call NETGEX. The next strike, 45, carries C3, Ab1, the largest absolute GEX, and both the call-volume and net call-volume peaks. Together, 44-45 forms the main call cluster after the rally.
The broader regime remains positive. HVL sits well below price at 37, with the 35 Put Wall as the larger downside reference. Holding above HVL keeps the long-dated gamma structure supportive, but location matters after a vertical move. The first test is whether IBIT can accept above the 44-45 call cluster or begins digesting the squeeze below it.
Implied volatility expanded with price. IVx is near 47.9, up about 8.6% over five days, while IVRank is 30.5. Options are no longer pricing the same quiet environment that existed before the breakout.
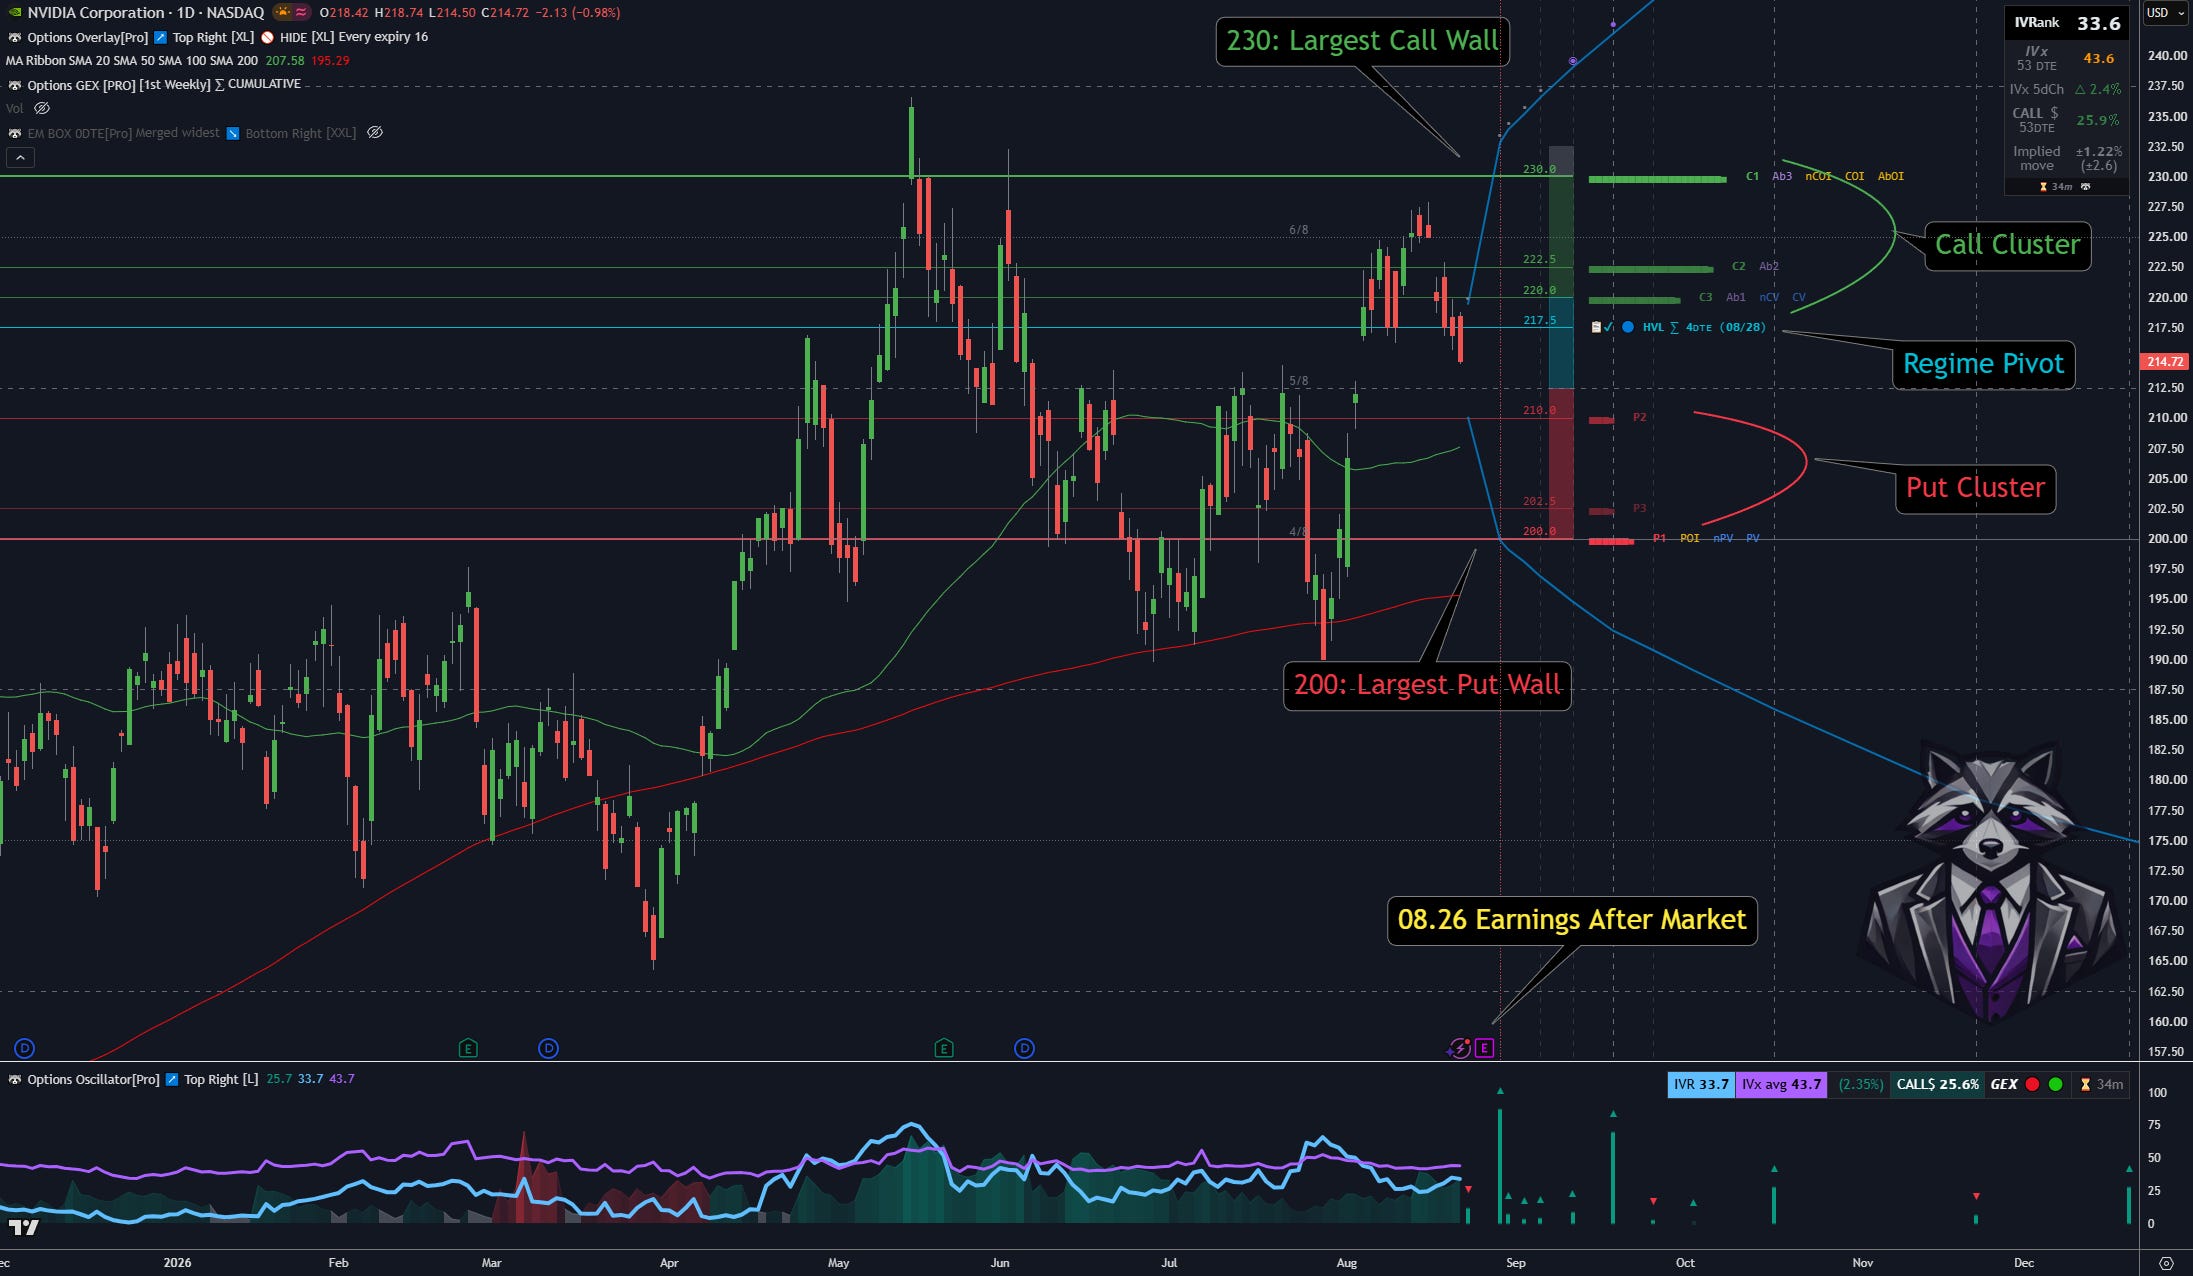
Nvidia reports after the close on August 26. Spot near 214 sits below 217.5 HVL, leaving the stock in transition ahead of the event.
The first upside test is 217.5-220. The 220 strike combines C3, Ab1, and the strongest call volume, followed by 222.5 C2 and the 230 Call Wall. Below price, 210 is the first support and 200 is the Put Wall with the largest put open interest and put-volume concentration.
Call pricing skew is positive but modest. IVRank is near 33.6 and IVx is around 43.6, while CALL$ is roughly 25.9%. Acceptance above 220 would improve the structure toward 222.5 and 230; weakness below 210 would shift attention toward 200.
🏛️ Policy & macro
· July PCE — Wednesday, alongside the second Q2 GDP estimate and durable-goods orders
· Jackson Hole — August 27-29, with Chair Warsh's first keynote address Friday
· Consumer confidence and new-home sales — Tuesday
📉 Vol & rates
· Long-end Treasury yields — can technology stabilize while the 10-year and 30-year remain elevated?
· VIX — does compressed volatility survive a week with both macro and mega-cap catalysts?
🏗️ Structure
· Nasdaq — can buyers defend the 50-day moving average after last week's rate-driven decline?
· SPX — can 7600 P1 and prior-high support hold while 7740 HVL remains the regime pivot?
📅 Earnings
· NVDA — Wednesday after the close
· CRM and CRWD — Wednesday after the close
· MRVL — Thursday after the close
🛢️ Energy / geopolitics
· Crude oil — does last week's advance hold as Middle East supply risk stays in focus?
Last week's decline was selective rather than indiscriminate. Higher yields hit technology and semiconductors, while crypto attracted one of its strongest bids in years. The market did not abandon risk. It changed where it was willing to hold it.
The major indexes are no longer moving with the same internal support, and implied volatility remains low relative to the number of catalysts ahead. Calm pricing can support a recovery if the news cooperates. It can also leave the market under-hedged if yields, inflation, or Nvidia force a faster reassessment.
This is a week to think like a risk manager first. Let price show whether the Nasdaq can defend trend support, whether the new SPX gamma map can absorb the event flow, and whether Amazon can hold its own flip after filling the gap.
GEX is not a crystal ball. HVL is not a mechanical trigger. A call wall is not a guaranteed top, and a put wall is not a guaranteed bottom. These levels define where positioning may change market behavior. They do not decide the outcome in advance.
Structure comes before strategy. The goal is not to predict every catalyst. It is to know which regime the market is in when the reaction begins.
This week's case study reviews an Oracle position built after a sharp decline toward the 140 area. The structure combined a cash-secured 120 short put with a 20-point-wide upside call butterfly aimed at 160 C2. The put premium helped finance the butterfly while the position waited for Oracle to stabilize.
Oracle initially moved below the short-put strike, then recovered. The short put was bought back and one butterfly leg was rolled from 140 to 145, removing the uncovered downside while preserving positive delta for a continued recovery.
The rally stalled at 150, where C1, call volume, net call open interest, and the largest absolute GEX formed a strong confluence. One butterfly was scaled out there. The remainder was closed with roughly 10 days left after the rejection increased the risk of a move back toward HVL and the Put Wall. The final result was a $790 profit. The main lesson is simple: GEX helped manage the position and define the exits, not just frame the original setup.
Full step-by-step breakdown — including adjustment ideas — in this week's video:
⚠️ Trade with flat-delta, high risk-reward structures, keep your positioning adaptable, and always monitor the GEX levels and the surrounding gamma environment — they'll tell you more about the path ahead than the headlines ever will!
You can find additional valuable content on our YouTube channel, and if you feel like trying out our
⭐ GEX-Live Charting View, you can do so with a 7-day free trial here: ⭐
https://tanukitrade.com/
This material is for educational purposes only; TanukiTrade is not a financial advisor, and nothing here constitutes investment advice or a recommendation.
No posts
Comments
Nothing yet. Say the first thing.
Sign in to join the conversation.