
This week opens on a headline, and a headline is not a structure.
Last week kept traders busy. Traders moved through Wednesday CPI, Friday’s record SpaceX IPO, and a steady stream of Iran-related headlines. Sessions swung. Premium expanded in spots that had been quiet for weeks.
Over the weekend, Trump signaled progress toward an Iran deal. /ES and /NQ futures gapped sharply higher before the cash open. Oil pulled back. The tape looked less defensive than it did heading into the close on Friday.

VIX had corrected higher during the volatile stretch, reaching toward 23 at one point. The relief headline brought implied vol back down. Good geopolitical news can compress vol fast when the prior move was headline-driven.
Can that gap hold into Kevin Warsh’s first FOMC meeting as Fed Chair and quarterly options expiration on June 18?
Iran stayed at the center of the macro story all last week. By the weekend, the tone shifted. Headlines around easing tensions and potential progress at the G7 Leaders’ Summit in France (June 15–17) helped fuel the futures gap higher and took some pressure off crude.
That is a different opening tone. Geopolitical risk can reverse quickly. The market is pricing relief, not a finished story.
The SpaceX IPO landed last week as one of the largest listings on record. With that event behind us, some participants expect the index range to open up again after weeks of event stacking. The IPO also kept tech and innovation sentiment in the conversation even on days when the broad tape was choppy.
Underlying all of this is still the rates channel. The 10-year yield (TNX) pulled back on Friday but remains on an upward slope near 4.5%. Midweek saw another push higher in yields before that fade. When yields run, large-cap growth and Russell 2000-style small caps often feel it first. If the 10-year breaks higher again, SPX can hold a gap and still struggle beneath the surface. Russell-heavy names can feel it sooner.
Retail sales, industrial production, and housing starts land in a shortened calendar alongside G7 and the Fed.
VIX corrected higher as last week’s events stacked up. The index reached toward 23 during the volatile stretch. That was not a full crisis print, but it was a clear step up from the compression that had been masking how thin hedges had become.
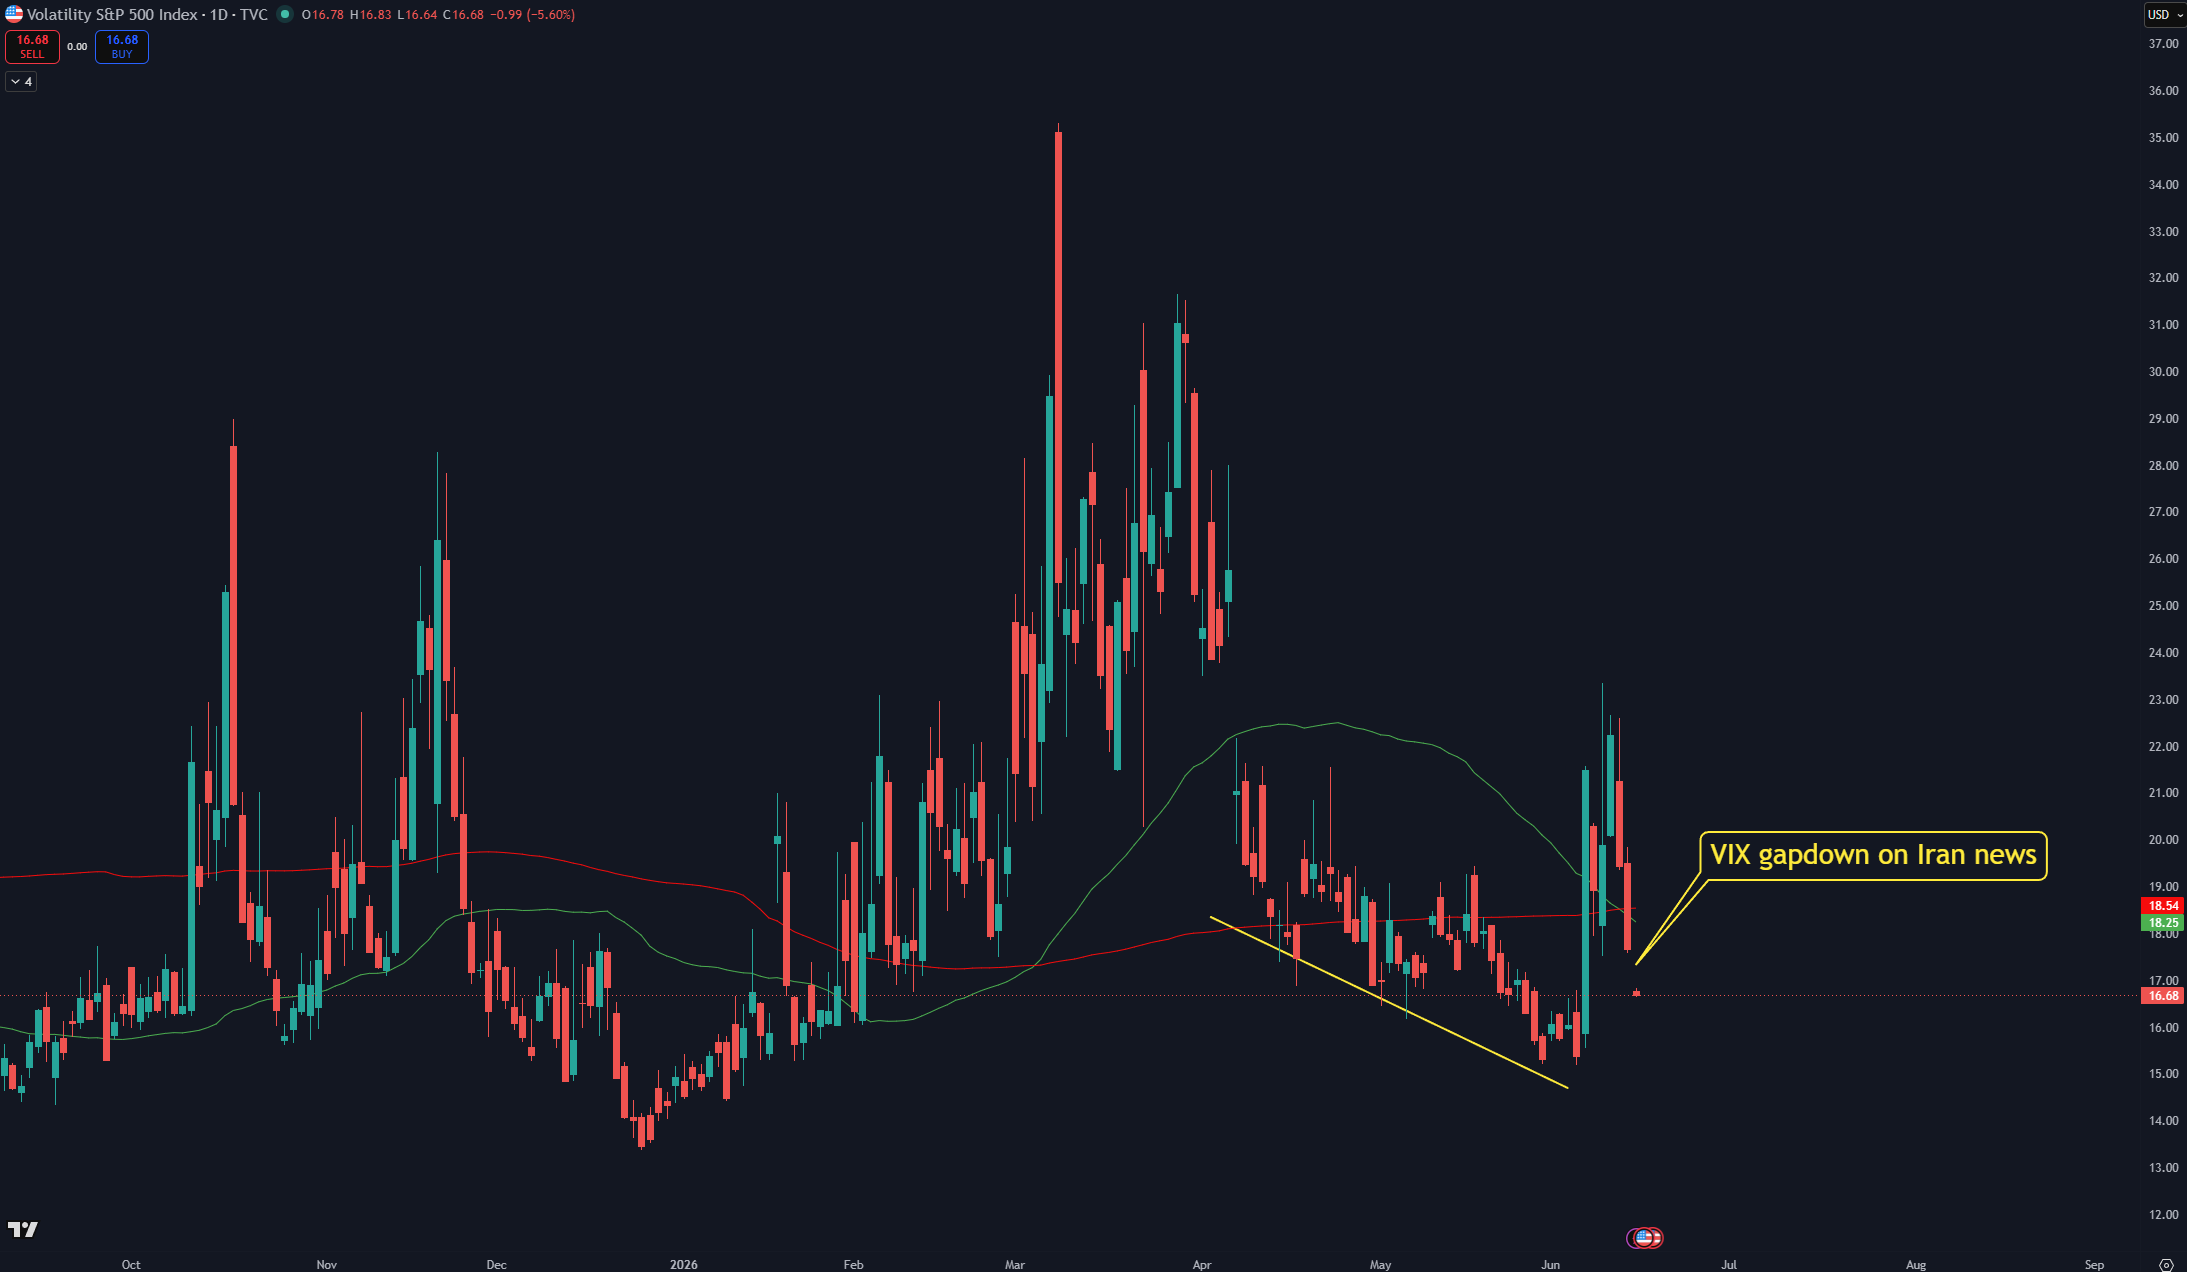
The weekend Iran headline brought VIX back down. Relief gaps and vol compression often arrive together when the catalyst is geopolitical rather than financial.
The test is whether compression sticks. FOMC on June 16–17 and triple witching OPEX on June 18 are the next vol events. A VIX that drifts lower would help the gap hold. A renewed bid in vol would fit a market that is still event-heavy even after the weekend headline.
Yields deserve their own line item this week.
TNX spent part of last week grinding higher, then eased into Friday. The broader trend is still up toward the 4.5% area. Fed messaging under Kevin Warsh’s first meeting as Chair will be watched alongside the dot plot and any shift in rate expectations.
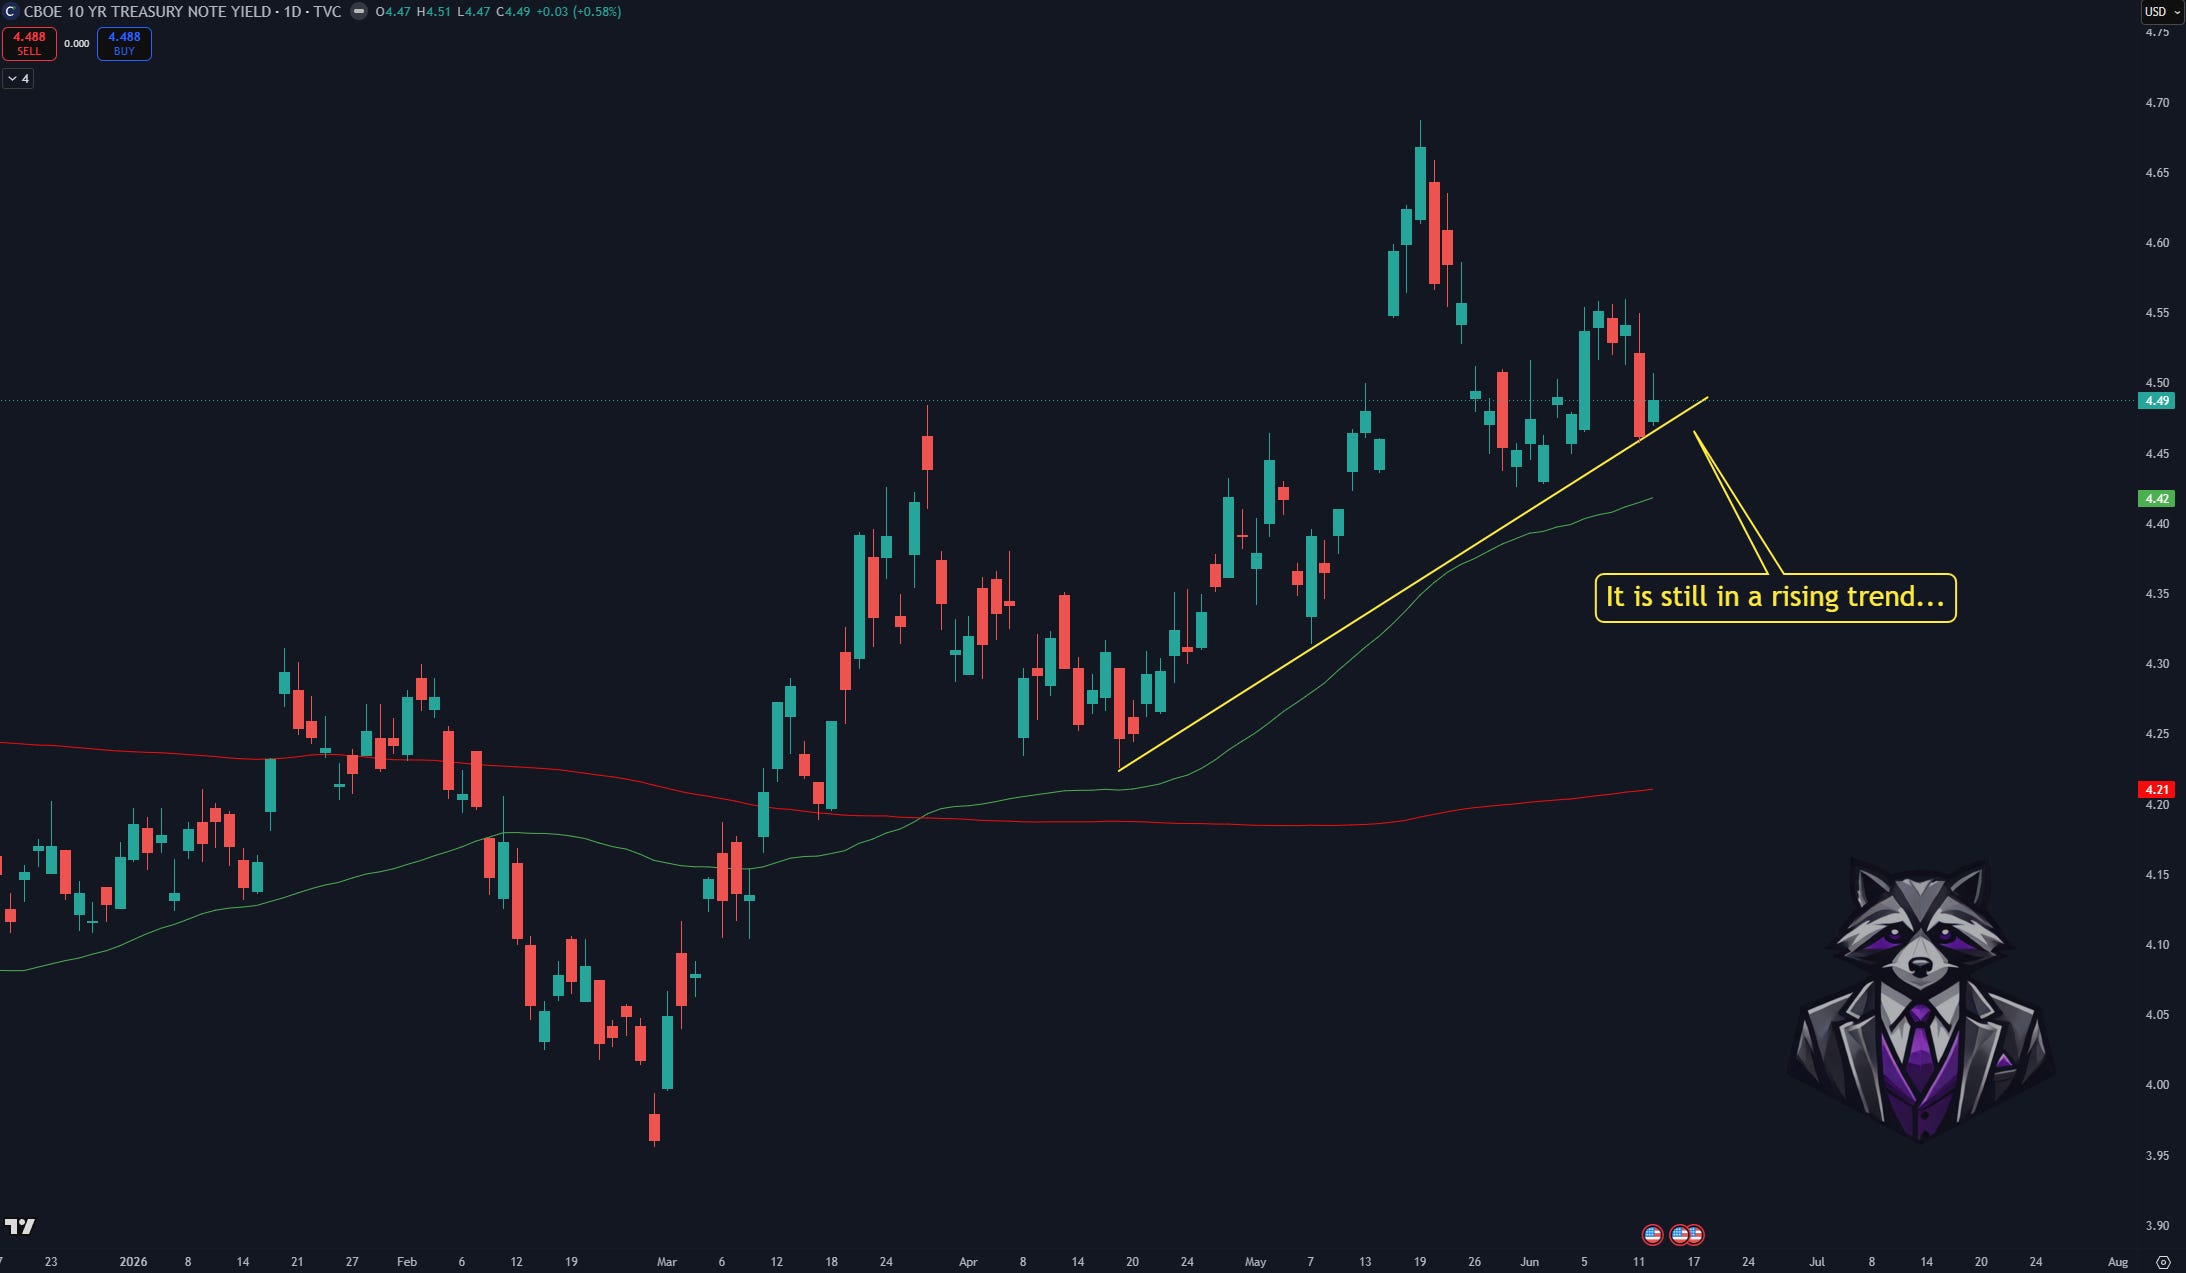
Higher yields do not automatically kill a relief rally. They do change which pockets lead. Growth and long duration can lag even when SPX futures gap up. Russell 2000 and small-cap beta often react first when the 10-year pushes.
Watch TNX in the same window you watch SPX structure. They are not the same trade, but they often rhyme on risk-off days.
For this week’s Thursday, June 18 expiration (triple witching in a shortened week; Friday is a holiday, so this profile reflects the Thursday expiry, not a standard Friday weekly roll), SPX is starting from a constructive position.
Spot at 7523 sits above HVL at 7420, which puts the index in positive gamma. Moves can still be fast around headlines, but the broad regime favors more controlled two-way trade than a pure negative-gamma tape.
The call-side map is stacked in a tight band above spot. 7500 carries C2 + Ab1 on the same strike, a confluence zone spot has just reclaimed after the bounce. 7550 C3 is the next overhead test, only a few handles above cash. 7600 C1 is the dominant call wall on this expiry.
On the downside, 7355 P2 is the first put reference below spot, then 7200 P1 and 7100 P3. 7000 stacks POI, COI, and AbOI (peak put open interest, call open interest, and absolute open interest), which makes it a major structural magnet if the tape gives back the gap.
Key levels from the current structure:
🔵 Regime
7420 — HVL (gamma flip · positive above)
🟢 Call side
7600 — C1
7550 — C3 ← next overhead test
7500 — C2 + Ab1 ← spot / confluence
🔴 Put side
7355 — P2
7200 — P1
7100 — P3
⭐ Open interest hub
7000 — POI + COI + AbOI (peak OI)
📊 Options panel
IVRank 42.9 · IVx 17.5 · Implied move ±0.44% (±33.1 pts) · Put skew 41.8%
Put skew at 41.8% is again very low. That is not a bearish signal by itself, but it leaves little cushion if the gap fails or FOMC disappoints.
The constructive path starts with spot staying accepted above 7420 HVL and holding 7500 C2 + Ab1 (highest absolute gex) after the rebound.
In positive gamma, a hold above the flip keeps the tape rotational rather than purely reactive. The immediate test is whether price can accept 7550 C3 rather than stall at the 7500 confluence. A clean hold above C3 opens room toward 7600 C1, the main call wall on this expiry.
Triple witching on Thursday adds pin risk around the heaviest strikes. With the call stack compressed between 7500 and 7600, OPEX can reinforce that band if buyers keep paying for upside into the Fed.
In simple terms:
SPX above 7420 HVL keeps the regime supportive.
Holding above 7500 C2 + Ab1 keeps the short-term bounce structure alive.
The next major upside references are 7550 C3, then 7600 C1.
The downside path turns on losing the 7500 C2/Ab1 zone or failing to accept 7550 C3 from below.
A slip back under 7500 raises the odds of a retest toward 7355 P2, then 7200 P1 and 7100 P3. Losing 7420 HVL would shift the profile back toward negative gamma, where moves can widen into FOMC and the Thursday roll.
The 7000 confluence (POI, COI, AbOI) sits as the deepest major cluster on the map if the gap fills hard. Low put skew at 41.8% fits that fragility: hedges are thin, so a disappointment can travel faster than the headline gap suggested.
The downside map is:
First warning: failure to hold 7505 C2 + Ab1
Next support: 7355 P2
Put references: 7200 P1, then 7100 P3
Regime line: 7420 HVL
Below HVL: structure becomes more reactive into triple witching
Deep cluster: 7000 (POI + COI + AbOI)
SPX entered the week on a headline, and the profile confirms part of the relief move. Spot is above 7420 HVL in positive gamma and has reclaimed 7500 C2 + Ab1, which is constructive. The index is now pressing 7550 C3 with 7600 C1 close behind.
That is not a broken setup. It is a crowded one into FOMC and a Thursday triple witching expiry. The gap helped; the structure still has to choose whether to accept the call stack or rotate back through 7500 toward 7355 P2.
The key level is 7420 HVL. Above it, the regime stays supportive even if the tape pauses at C3. Below it, the Iran gap becomes a reflex inside a more fragile profile.
Quarterly expiration hits June 18.
Index, equity, and futures options settle together. That removes a large slice of positioning and can change hedging behavior into the close. When the week already includes FOMC and a geopolitical gap, OPEX is not a footnote.
Watch whether SPX gravitates toward a major GEX cluster into Thursday and Friday, or whether Fed messaging overrides pin dynamics.
🏛️ Policy & macro
· G7 Leaders’ Summit — June 15–17, France
· FOMC — June 16–17: Warsh’s first meeting as Fed Chair; rate path and projections
· Data: retail sales · industrial production · housing starts
📉 Vol & rates
· VIX — relief fade, or a renewed bid into the Fed
· TNX near 4.5% — another leg up vs stable yields
🏗️ Structure
· Iran gap — hold or fill?
· SPX — hold 7500 C2 + Ab1 vs rejection toward 7355 P2
· 7550 C3 acceptance into Thursday triple witching (06/18 expiry)
🌊 Flows
· Post-SpaceX IPO — does the index range open up as event risk clears?
Headlines gapped the market higher. Gamma structure still decides what holds.
A relief open is not the same as a repaired regime. Yields near 4.5% can cap rallies even when futures look strong at premarket.
We map levels and reaction zones. We do not trade the headline. FOMC and OPEX run on their own calendar.
Patience beats conviction in a shortened macro week. A level is not a prediction. GEX is not a crystal ball. It shows where reactions cluster when the auction catches up to the gap.
This week’s release is a conversation with Christopher Creamer, an intraday Nasdaq futures trader who uses TanukiTrade alongside order-flow tools.
The goal is not to turn GEX levels into blind entries. Chris opens TanukiTrade early to read whether the session sits in positive or negative gamma, maps spot against HVL, put walls, and call walls, and builds scenarios before the New York open. Positive gamma sets expectations for slower, more rotational trade. Negative gamma sets expectations for expansion, speed, and wider ranges. That shapes size and patience, not direction by itself.
He combines the gamma map with footprint charts at decision zones. Walls are treated as areas to watch for acceptance or rejection, not magic fade lines. When open interest and volume stack at the same strike, the level gets more attention, not more certainty.
The full video includes four historical NQ sessions walked bar by bar.
Full conversation and case studies:
⚠️ Trade with flat-delta, high risk-reward structures, keep your positioning adaptable, and always monitor the GEX levels and the surrounding gamma environment — they’ll tell you more about the path ahead than the headlines ever will!
You can find additional valuable content on our YouTube channel, and if you feel like trying out our
⭐ GEX-Live Charting View, you can do so with a 7-day free trial here: ⭐
https://tanukitrade.com/
This material is for educational purposes only; TanukiTrade is not a financial advisor, and nothing here constitutes investment advice or a recommendation.
No posts
Comments
Nothing yet. Say the first thing.
Sign in to join the conversation.