
There were many papers that caught my eye when I was looking at the program for SoCC (ACM Symposium on Cloud Computing) held in November 2022, but the paper How to Fight Production Incidents? An Empirical Study on a Large-scale Cloud Service from Microsoft seemed the most interesting. The paper was also declared the Best Paper at SoCC, which made it all the more intriguing to me.
This is a review of the paper, along with several of my own thoughts. All in all, I found the paper to be a tad underwhelming, and it very much buried the lede until the very end when a multi-dimensional analysis proved to be the most revealing section of this paper.
It’ll be useful to folks who want to back up proposals with some empirical data (“a Microsoft study showed that 15% of software bugs are due to backwards compatibility issues” or that “a Microsoft study showed that 25% of all alerts that fail to fire are due to static thresholds, proving the need for more dynamic tuning of alerts”), but for the most part, the paper doesn’t scratch beneath the surface of the 152 incidents it analyzed.
The paper examined 152 high severity production incidents in Microsoft Teams (a service used by many companies as an alternative to Slack) and has summarized many of the learnings.
In particular, it examines incidents “caused by many types of root causes”, and analyzes detection and mitigation strategies by looking at the entire life-cycle of the incident. By “life-cycle” of the incident, the authors refer to the stages of:
detection
root-causing
mitigation.
Anyone running distributed systems deals with incident response. As such, this paper, in theory, sounds relevant to anyone running infrastructure software.
NB: The paper very liberally uses the term “root cause” (and even “root causes”), which is something a bête noire in several influential circles of the systems reliability community. My own thoughts on this term are rather nuanced, but for the purposes of this post, I intend to use it the spirit the authors of the paper use it.
The paper is a summary of 152 incidents of severity levels 0, 1 o 2, not all of them customer impacting, with the breakdown being reported as:
30% of incidents in our study have a severity level of "0" or "1" (only one incident has a "0" severity level) and the rest 70% of incidents have a severity level of "2".
Once the incidents were picked, they were then studied via a framework devised to allow for the categorization of these incidents:
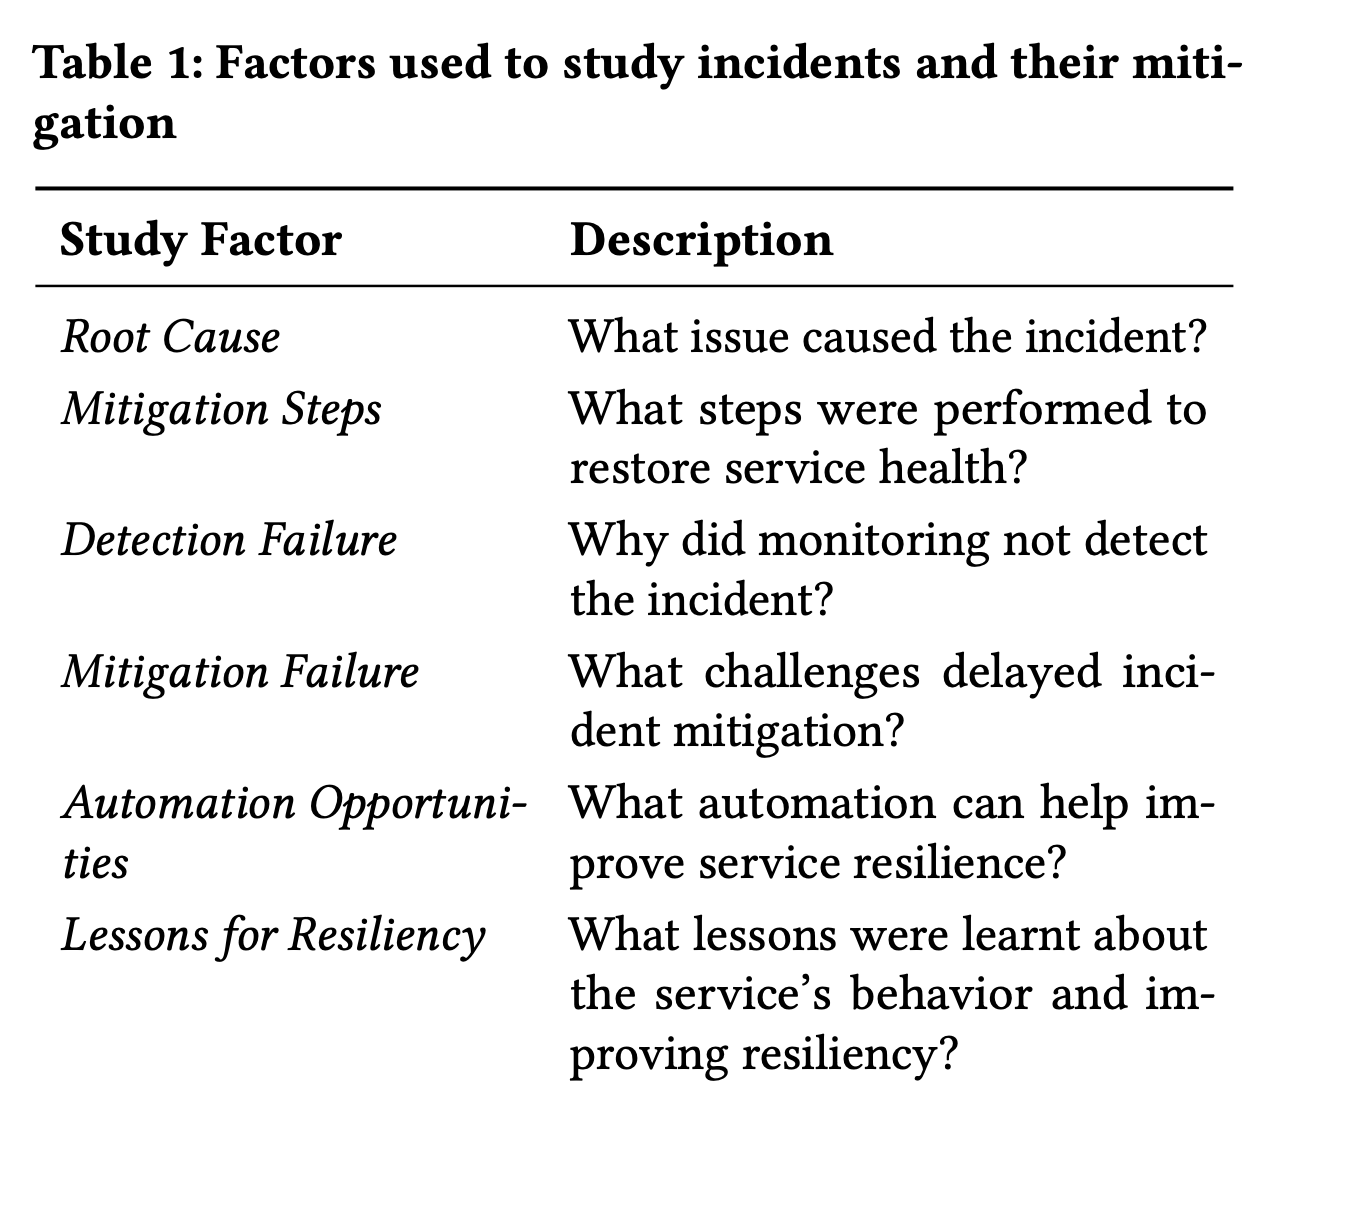
The study did not double count an incident into multiple categories. If an incident is caused by “multiple root causes”, then the incident is categorized into “the most specific category that first occurred in the summary”.
This is clearly a category that was devised specifically for the Microsoft-Teams service, and the paper even warns that “the insights generated from root cause, mitigation strategy and automation opportunities may not replicate in other cloud systems”. This becomes more obvious as we dig deeper into the study.
The paper identifies 7 types of “root causes”

Again, it’s worth mentioning here that if this study were performed on a different type of system, the taxonomy of “root causes” might look somewhat different. Some types of “root causes” like software bugs, dependency failures or configuration changes impact nearly all kinds of systems, whereas some like “auth failures” typically have some assumptions baked in viz. trusted networks, authentication or authorization modes etc.
The breakdown of various categories also doesn’t universally follow the same distribution summarized here. There are systems I’ve worked on where configuration changes alone have contributed to over 70% of incidents, whereas something like “database failures” wouldn’t even figure anywhere in the wash-up of years’ worth of incident analysis.
24.4%: Code change or buggy features
24.4%: Feature Flags and Constants (I’d personally categorize this as a configuration change, not a code change, even if the configuration is baked into the codebase)
19.5%: Code dependency
17.1%: Datatype, validation, and exception handling.
This isn’t surprising, given there’s previous research that has shown that “almost all (92%) of the catastrophic system failures are the result of incorrect handling of non-fatal errors explicitly signaled in software.”.
The 92% number reported in the paper linked above as opposed to the 17.1% (of the overall 27% of code bugs!) described here should also serve as a cautionary tale that reading or extrapolating too much from a single study or paper isn’t terribly useful, as the results of a study are entirely contingent on specific systems under study.
14.6%: Backwards compatibility
33.3%: CPU Capacity issues
41.7%: Traffic changes causing capacity issues
16.7%: Infrastructure scaling
Over-utilization of resources due to poor utilization of capacity
8.3%: Infrastructure maintenance
Migrations causing cache invalidations
55.0%: Certificate Expiry, Rotation etc.
25.0%: Faulty Deployment and Patching
20%: Human Error
47.4%: Misconfiguration
Bad existing configuration not adapting to new traffic patterns
42.1%: Configuration Change
Introducing new configuration
10.5%: Configuration Sync
Eg, “If two or more flighting configuration settings operate within the service, then the updated configuration could expire, and the old configuration is used that fails to fetch the right tokens.”
To me, this sees like a very niche use case, and it’s not typically the sort of config issues I’ve dealt with.
Where a “dependency” could be anything from external APIs, to some other service like a cache or a database service, to the underlying IaaS
24.0%: Version incompatibility
20.0%: Service Health
Not detecting failures of downstream dependencies in time
28.0%: External code change applied to dependencies
28.0%: Feature dependency
A new feature is rolled out by the dependency or an existing feature is deprecated
mostly capacity related when the cloud system cannot handle higher than normal or expected user request and throttle user’s request.
25%: network latency due to high round trip time (RTT) or latency spike in a dependent service
31%: network availability or connectivity issues causing multithreaded servers to see increased latency or timeouts
25%: outages of database that impacted the file operations
19%: insufficient scaling of database capacity after user request load increased.
42.9%: Authz errors
28.6%: Certificate Rotation
28.6%: Authn errors
The main takeaway reported by the paper in identifying these 7 root causes is that:
While 40% incidents were root caused to code or configuration bugs, a majority (60%) were caused due to non-code related issues in infrastructure, deployment, and service dependencies.
As you can see, this taxonomy is rather fluid. Several “database” problems look very much like infrastructure issues or configuration issues (number of open file descriptors) or even code issues (lack of throttling or rejection of requests based on dynamic health checks). Likewise, several “auth” issues look like configuration issues.
Dependency failures in several cases can be papered over by code, in which case, outages due to dependency issues become more a “code” problem.
As such, the “7 types of root causes” are probably best treated as a very loose grained classification, as opposed to a hard-and-fast guideline.
It’s also questionable as to how much the main “finding” is generally applicable. The 40-60 split to me looks like something that might not necessarily pan out when the taxonomy is tweaked, or if the authors hadn’t tried to neatly fit every incident into a single “root cause” bucket.
The most interesting and frustrating challenges in running distributed infrastructure often arise at the confluence of various intersecting “layers”, and I felt the taxonomy devised here did little to explore the nuance or the intricacy in such interactions.
Having identified 7 types of “root causes”, the paper then goes on to identify 7 types of mitigation strategies.

Three types of “rollbacks”
35%: Rollback of code change
New PR is opened, merged, new code is built and deployed
I’d call this a “roll forward”
24%: Rollback of configuration change
41%: Rollback of build
Redeploying an old build artifact
Typically this is what I personally think of when I think of rollbacks.
44%: Traffic Failover
16%: failover to another healthy node
9%: failover to another healthy cluster
19%: fail-over to another cloud region
56%: node scaling or node reboot operations
31%: upscaling the node infrastructure to tackle overutilization problems
10%: node downscaling strategy
15%: restarting the faulty or unhealthy nodes
29%: external teams simply rolled back the recent changes, including code/configuration change and deployment of a new build
17%: partner team identified the bug in code/configuration and manually fixed them
54%: partner team executes a wide variety of mitigation steps
fixing metadata
rebooting nodes/clusters
traffic rerouting
sending notifications to customer/users asking for disabling unsupported plugins
25%: mitigated by either cert renewal or rotation
20%: changing and redeploying the erroneous configuration files
20%: restoring the previous steady configuration files
25%: fixing the faulty features
disabling the new feature
reverting the feature change
failover to other similar but stable feature
10%: syncing the dependent configuration files for different services
45%: resolved with code change
17%: magic number problem
If the issue is related to bad setting of binary flags and constant values (magic number problem), then they are solved by changing the magic numbers
25%: additional exception handling logic
17%: entire code module or abstract method is added to include new resources (e.g., certificates) that are rolled out recently.
When the “root cause” is complex and on-call engineers are not familiar with the issue, they execute a series of ad-hoc commands
Incidents triggered by automated alerts if certain health check metrics crossed a pre-defined threshold, and are automatically mitigated for 3 main reasons
Auto healing of infrastructure (e.g., network recovered)
Updating or restarting the app from the user side resolved the problem
Service health metric automatically recovered
The paper lists the main takeaways from identifying the 7 types of mitigations as:
Mitigation via roll back, infrastructure scaling, and traffic failover account for more than 40% of incidents, indicating their popularity for quick mitigation.
Although 40% incidents were caused by code/configuration bugs, nearly 80% of incidents were mitigated without a code or configuration fix.
Even among incidents triaged to exter- nal teams, only a minority 17% of incidents were mitigated using a code/configuration fix.
Again, this shouldn’t be massively surprising to anyone with any experience running infrastructure services. Despite the paper’s assertions that code changes account for only a minority of the mitigations, if the “life cycle” of the incident also took into account action items listed in the postmortem, I’m pretty certain code changes will account for more than the percentage reported here.
The other rather odd thing about this paper is that it seems to conflate widely different approaches and ends up drawing somewhat underwhelming conclusions.
For example, code and configuration changes are so semantically different that reporting numbers like “40% incidents were caused by code/configuration bugs” seems to muddy the water a lot, and this risks seriously undermining the ability to unearth real insights from this data. The risk profile for code changes and configuration changes (even if it’s applied as a code change) typically tend to be different, as is the blast radius of such changes.
The paper introduces the terms time to detect (TTD) and time to mitigate (TTM).
55%: automated alerts
29%: external users
10%: partner teams
6%: developers themselves
25%: static thresholds set for alerts didn’t adapt
50%: misdiagnosis of the severity level of an incident by an alert
50%: buggy/noisy alerts or bad configs in alerts
31%: Certain environments don’t have enough telemetry
38%: No alerts set for telemetry on resource utilization
31%: Missing alerts for certain types of telemetry data (eg, error codes)
The main finding here is that the detection and mitigation time for both code bugs and dependency failure is significantly higher than other root cause types.
On the other hand, for deployment errors, detection took longer than the mitigation time. Manually fixing code and configuration take significantly higher time-to-mitigate, when compared to rolling back changes. This supports the popularity of the latter method for mitigation.
~17% of incidents either lacked alerts or telemetry coverage, both of which result in significant detection delays.

25%: Engineers needed external manual approval to deploy
25%: Engineers didn’t have certain deployment related permissions
50%: Config change/hotfix/code change etc took longer than expected to take effect
19%: On-call engineer had a “knowledge gap”
50%: Quality of runbooks
31%: Poor infra setup didn’t allow for autoscaling or failovers
18%: “Rare occurence”
27%: No telemetry
55%: Took time to figure out actual bug in code change
14%: Multiple on-call engineers simultaneously executed several steps without having a proper communication
29%: Initial misdiagnosis lead to execution of wrong resolution methods
36%: deployment of configuration errors needing manual intervention takes longer than expected
The paper reports that incidents with “complex root causes” take the longest to mitigate; poor documentation, procedures, and manual deployment steps can also significantly increase mitigation time.
This echoes well with my own personal experience, and it’s good to have empirical evidence as opposed to just anecdotal data, as it can help steer conversations around the need to automate more of the deployment process or spruce up runbooks.
The paper proposes 6 types of strategies from analyzing the 152 incidents.

12.8%: Use chaos engineering techniques for load or stress testing; system test
23.1%: end-to-end testing to verify system functionality
30.8%: Test edge cases!
12.8%: validation test for auth failures
7.7%: Integration Tests
12.8%: Unit Tests
30%: Fine-tune alerts
52%: Improve health checks
18%: Automated Triaging
44%: Automation of failover
56%: fully automate the release pipeline to avoid any human intervention that will eliminate delay or error in manual steps.
Personally, I was left a tad unimpressed with most strategies proposed here.
“Just test more or add more alerts” seem to be the de-facto action item of almost every incident, but the more interesting questions, IMO, are vis-à-vis:
how and why the code change PR was approved with the level of testing it had
what the incidents revealed to the engineers about gaps in their knowledge of the systems they are building.
Were these emergent properties in systems that manifested themselves?
Why did the system lack end-to-end testing in the first place?
And so forth.
These are the kind of questions that reveal fascinating insights about the systems themselves or the organizational dynamics. Ideally, trying to find answers to these questions is the main purpose of the postmortem.
Without more context, “just write more tests” isn’t a terribly useful finding.
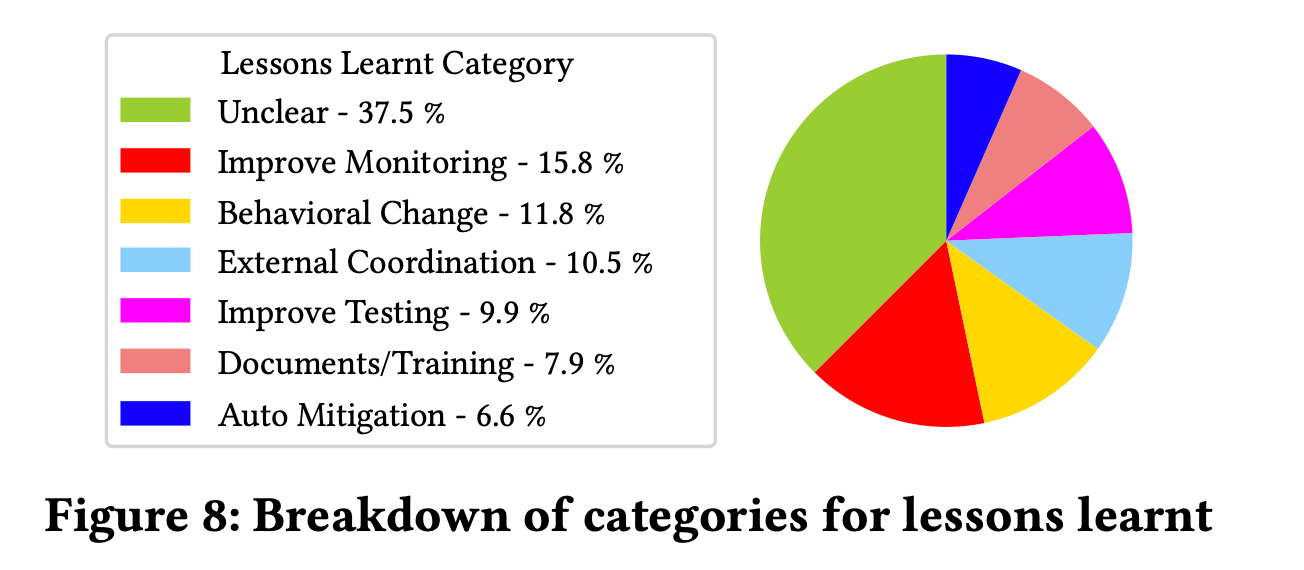
54%: Add telemetry
33%: Fix or tune alerts
13%: Better dashboard
13%: Monitor testing
33%: System Testing
20%: Configuration Testing
20%: Edge case testing
27%: Version testing for backwards compatibility
33%: Deployment practice
operators should be careful while rolling out configuration change or certificates in sensitive environment
34%: Programming practice
developers should be careful while turning on flags in some scenario, and they should carefully block all unsupported scenarios to avoid customer impact
22%: RCA and Mitigation Practice
operators should verify they have right permissions and knowledge before executing any rollback or restart operation in sensitive environments
11%: Monitoring practice
Operators should pay attention in health dashboard and re-evaluate capacity measure before changing incident severity level.
50%: Better Runbooks
17%: Better Postmortems
eliminate dependency among postmortems to quickly get insights from historical similar incident postmortems
33%: Better API documentation and API test coverage
30%: Automate Cert renewal
20%: Audit certificate updates, testing and validation
20%: Automate traffic failover
30%: Automate autoscaling
56%: establish a clear communication channel with partner teams
44%: need better escalation mechanism to proactively reach the partner team
Again, no groundbreaking new insights here, but some things stood out to me nonetheless. It’s notable how prominently certain “sociotechnical” aspects stand out - such as better communication and coordination between partner teams, or the need for better runbooks and training.
It’s only in the very final section does the aper acknowledge that the true challenge with distributed infrastructures often lies at the intersection of myriad systems and organizations, and what leads to delays in mitigation. A more holistic approach to analyzing incidents would require a multi-dimensional analysis.
It’s in this analysis that some of the truly fascinating observations are found.
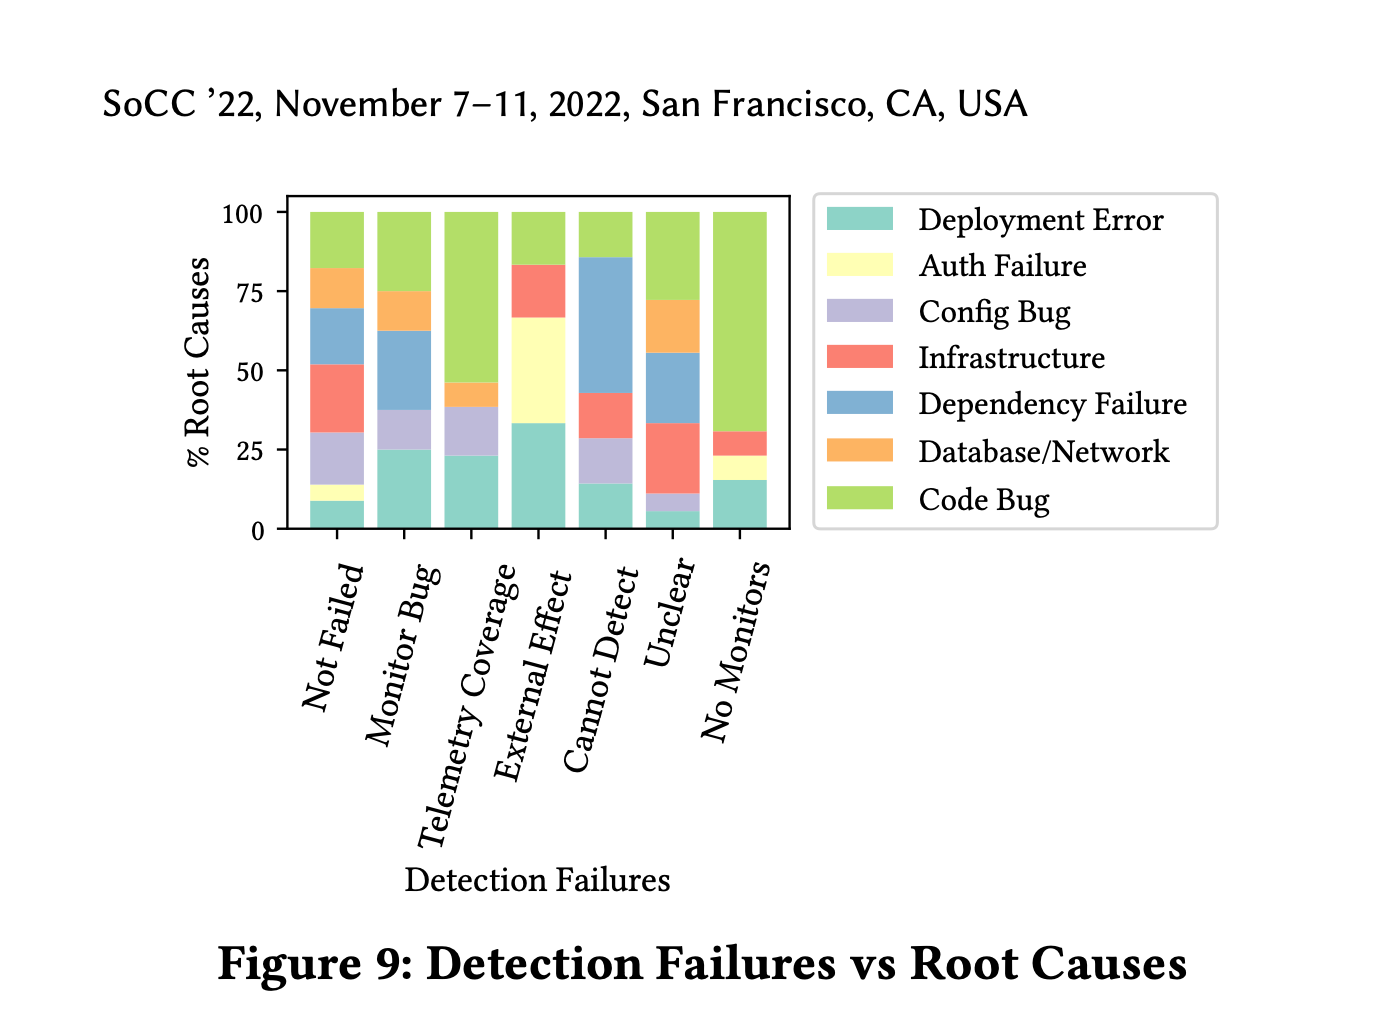
70% of incidents without alerts were due to code related changes
54% of incidents due to lack of telemetry were also code related changes.
This also checks out with the conventional wisdom that the majority of outages are due to code changes.
Another finding is that 42% of incidents not discoverable via alerts pertain to dependency failures, which underscores the necessity of setting up alerts to probe dependencies. This, in turn, begs the very interesting question of how that can be done, and why it hasn’t been done as yet (and the paper, alas, doesn’t cover much of this).
Tools for monitoring RPCs that span several services have existed for more than a decade now (distributed tracing), but why Microsoft Teams isn’t leveraging it to discovery dependency failures is anyone’s guess.

47% of configuration bugs mitigated with a rollback
A large portion of misconfigurations can be identified if tested
Static configuration validation is disconnected from the dynamic logic of the service’s source code
Need to develop more systematic methods for configuration testing, that not just validate values but also test syntactically/semantically valid configuration changes that may result in unexpected service behavior
30% of incidents with deployment errors were mitigated with a configuration fix
mainly deal with deployed service certifi- cates expiring
for 50% of database and network failures, client services depend on the external team to fix the failing infrastructure
client service reliability can be further improved with auto-failover mechanisms to use alternative networks or database replicas configured during deployment.
21% of incidents where manual effort delayed mitigation, expected improvements in documentation and training.
We need to design new metrics and methods to monitor documentation quality.
Automating repeating mitigation tasks can reduce manual effort and on-call fatigue.
25% of incidents where mitigation delay was due to manual deployment steps, expected automated mitigation steps to manage service infrastructure (like traffic-failover, node reboot, and auto-scaling).
Over 50% of incidents that alerts could not detect, could be fixed with manual testing over automated alerts
This enforces that a “Shift Left” practice with automated tools to aid testing can reduce on-call effort and expenses
A lot of the findings reported in this paper weren’t particularly insightful or surprising in my opinion
The main reason why most of this paper seemed so lacklustre to me was due to some of the approaches taken to classify the incidents (try to fit every incident into “one single root cause” bucket) as well as some of the analysis of this data.
Without access to the underlying incident reports, it’s hard to figure out how useful findings like “write more tests” or “set more alerts” will truly prove to be.
Some of the more useful insights that I found here are the need for dynamic thresholds for alerts, as well as the need for more advanced configuration testing mechanisms (as opposed to just testing the validity of the configuration).
I also wish the paper had dug deeper into the “sociotechnical” conundrums - such as strategies for better post mortems spanning various teams and orgs
All in all, if you’re a numbers person, who wants some empirical data to back up some of your own beliefs or something you’re trying to pitch your boss, this might be a good reference paper.
No posts
Comments
Nothing yet. Say the first thing.
Sign in to join the conversation.