
At the request of many readers, this report officially launches our U.S. Tech Stocks Deep-Dive Analysis series.
Going forward, more in-depth reviews of individual stocks, including their price-volume structures and cycle projections, will be featured in the U.S. Tech Stocks Deep-Dive Analysis series. Stay tuned for future updates.
Stocks covered in this report: Micron Technology (MU), SanDisk (SNDK), and Microsoft (MSFT).
Let’s get straight into the analysis.
Thanks for reading! This post is public so feel free to share it.
💡 About the Subscription: If you find and enjoy this type of in-depth research, feel free to like, share, and subscribe. For non-subscribers, for just the price of one cup of coffee (10 USDT), you can unlock the full weekly deep-dive reports, real-time intraday strategy alerts, and exclusive educational resources.
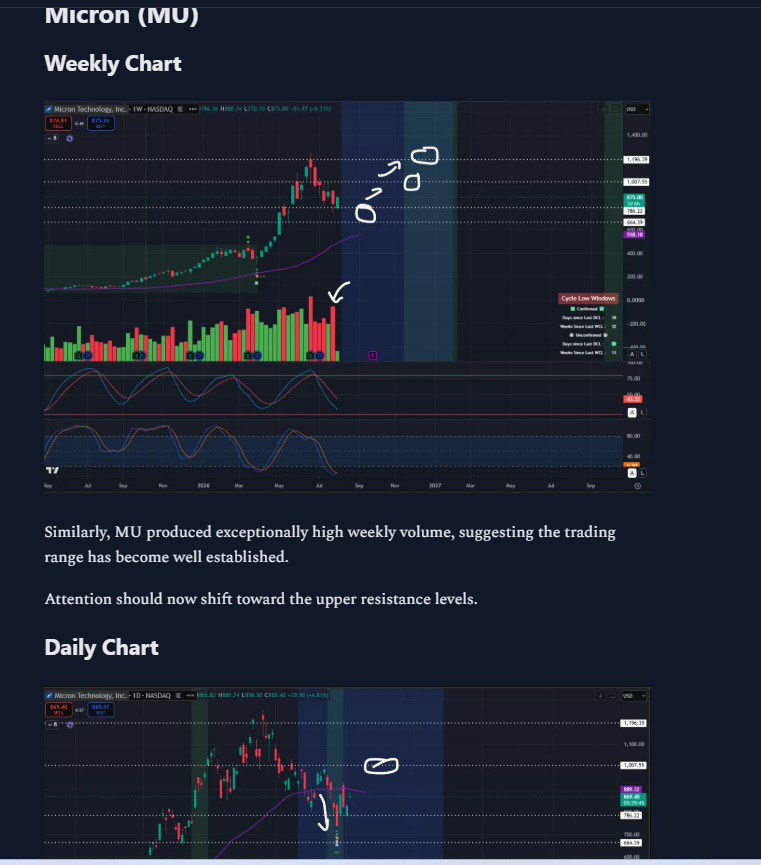
Historical Review: In our previous report, “U.S. Stock Market (S&P 500) Follow-Up Report | 04 Aug 2026,” we clearly highlighted that the previous high-volume turnover had established a significant support zone at the bottom of the current trading range. The focus thereafter was on the two major weekly resistance levels.
Price has now precisely reached the first weekly resistance zone.
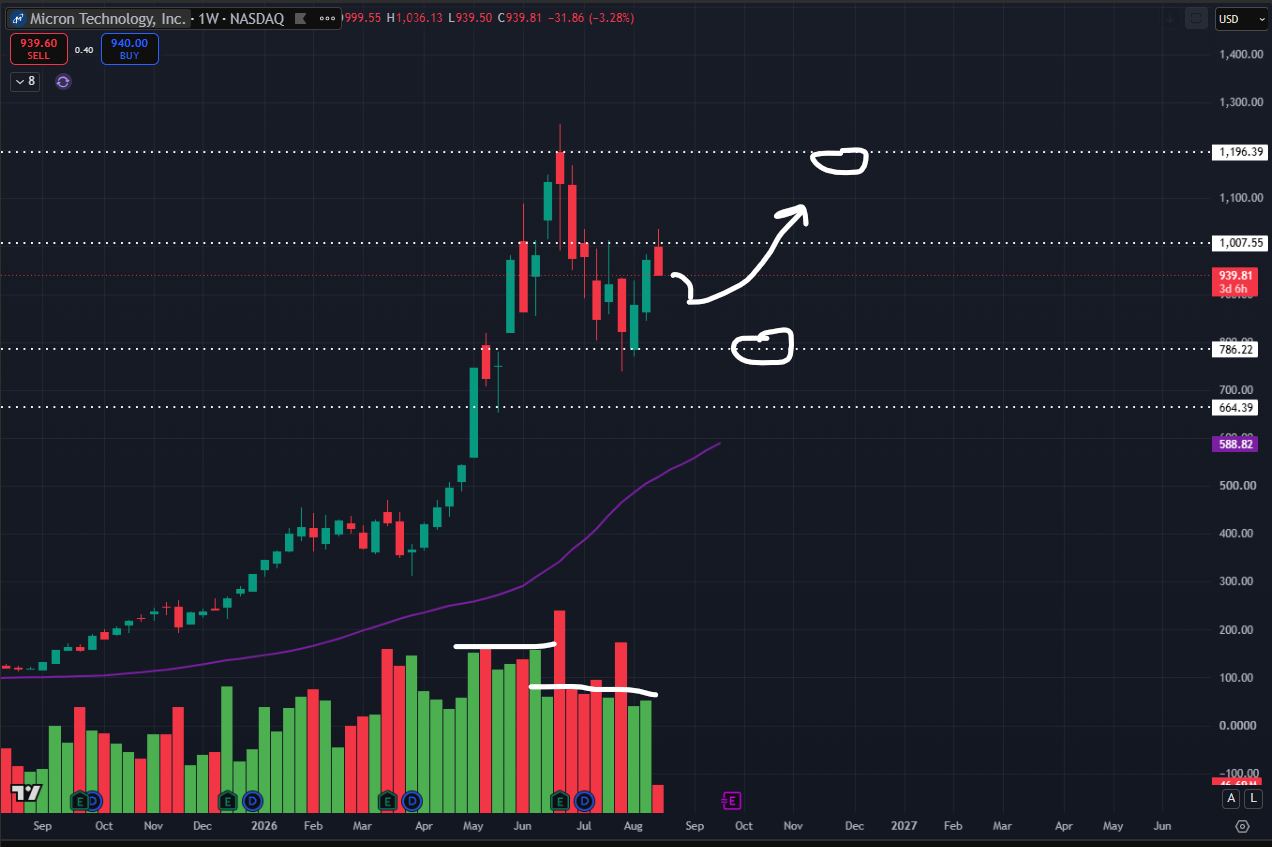
Structural Development: Weekly trading volume is showing a clear contraction. Once the initial trading-range structure was established, the decline in trading activity was expected, indicating that the market has entered a new consolidation phase within the established range.
Going forward, the key question is whether this structure develops into re-accumulation or distribution.
Key Levels: The key support level to monitor is 1007.
As long as the weekly chart does not break below this level, price is likely to continue consolidating within the broad 786–1007 trading range.
If price retests the support area on declining volume and successfully confirms the support, the next move could be another attempt toward the previous high at 1196.
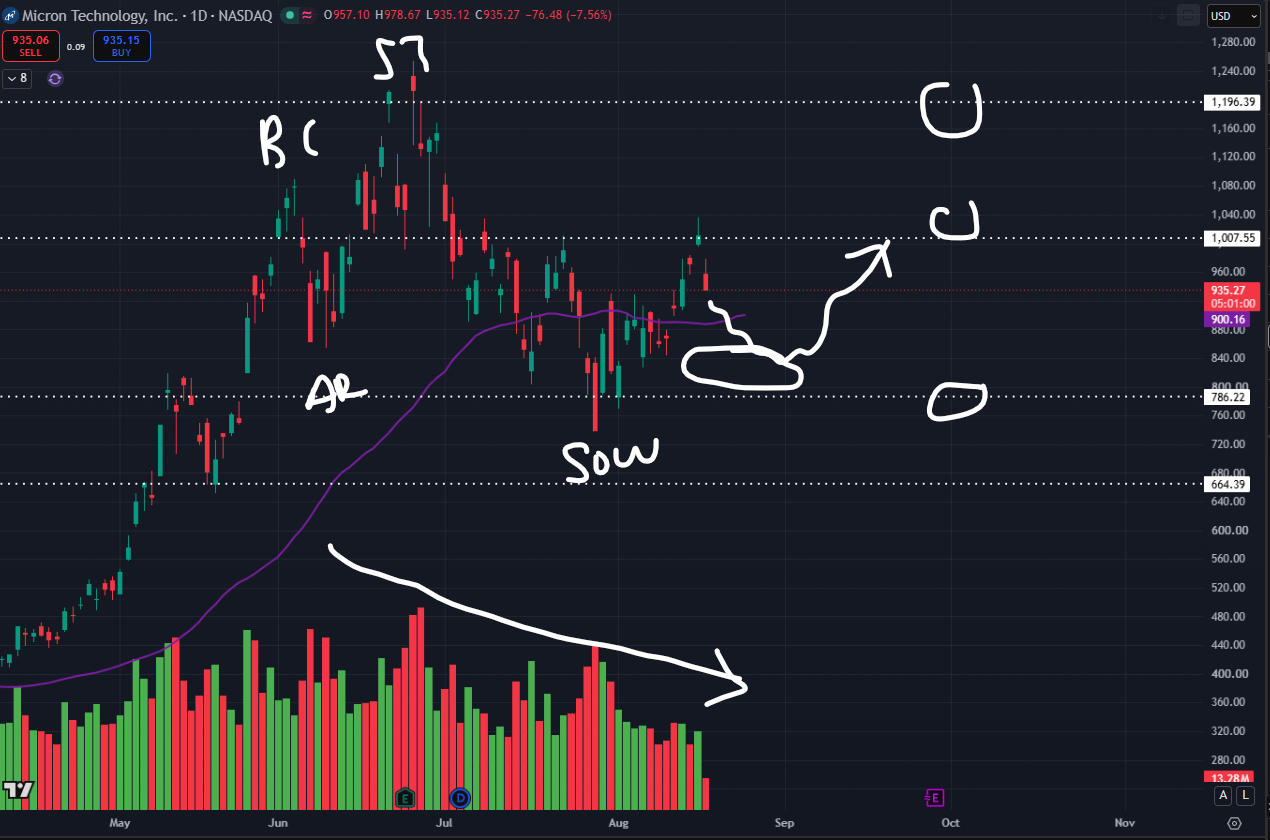
Volume contraction is even more pronounced on the daily timeframe, displaying characteristics typical of Wyckoff Phase B within a trading range.
The key focus now is the strength of the support zone marked on the chart, which will help determine whether the stock is ready to initiate another test of the overhead resistance.
Trading Perspective: Given the volatility of U.S. equities, some traders may prefer higher-frequency trading opportunities.
From a Wyckoff perspective, however, the choice is between positioning in the storage semiconductor sector, which has just entered a Phase B consolidation, or attempting to trade BTC and related crypto stocks that may be approaching a potential Phase C test.
Ultimately, this depends on each trader’s individual strategy and risk preference.
Cycle Legend:
Yellow = Monthly cycle
Blue = Weekly cycle
Cyan = Daily cycle
Comments
Nothing yet. Say the first thing.
Sign in to join the conversation.