
In last week’s report, we highlighted the opportunity to position around the daily-cycle secondary-test low. BTC provided two precise technical entry levels, while ETH identified the pullback zone below the daily EMA50. The market subsequently validated our expectations almost perfectly, with both assets reaching their predefined technical buy zones.
If you successfully established spot or long positions, congratulations. From a structural perspective, this is highly likely to become one of the most attractive risk-reward opportunities over the coming weeks and potentially months.
In this week’s report, we will continue using our dual analytical framework of Wyckoff Price & Volume Analysis (VPA) and Hurst Time Cycles to conduct a deeper assessment of BTC’s current accumulation structure, price action, and potential market-turning windows.
BTC: Precisely reached both predefined buy zones.
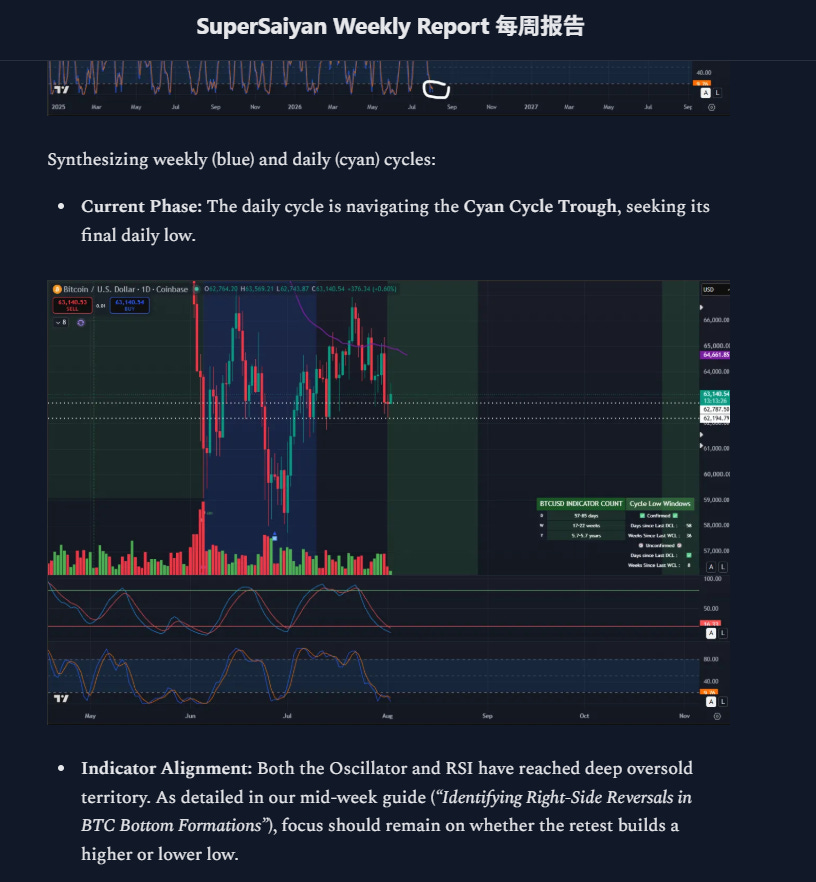
ETH: Precisely retraced into the predefined support zone.

💡 About the subscription: If you find this type of in-depth research useful, feel free to like, share, and subscribe. For those who have not subscribed yet, just the price of one cup of coffee — 10 USDT per month — gives you access to the full weekly deep-dive reports, real-time intraday alerts, and exclusive educational content.
Thanks for reading! This post is public so feel free to share it.
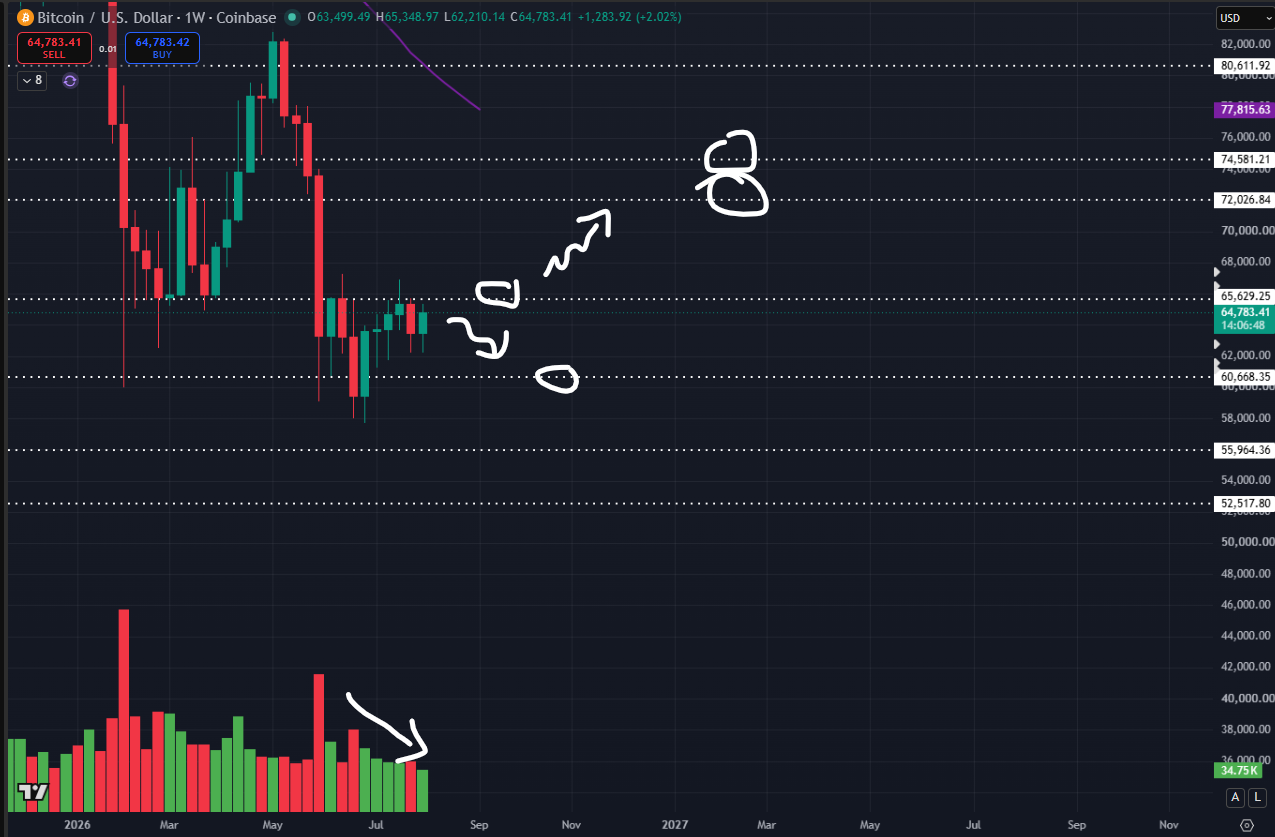
The current right-side structure continues to show a clear decline in volume, suggesting that a potential expansion or breakout window may be approaching within the next week.
If BTC successfully breaks above and reclaims the 65.6K weekly resistance, the next upside target will directly point toward the 72K–74.5K major resistance zone.
If the weekly candle still fails to close decisively above 65.6K, BTC is likely to remain within its current trading range in the short term.
The key defensive level for the bulls remains 60.6K.
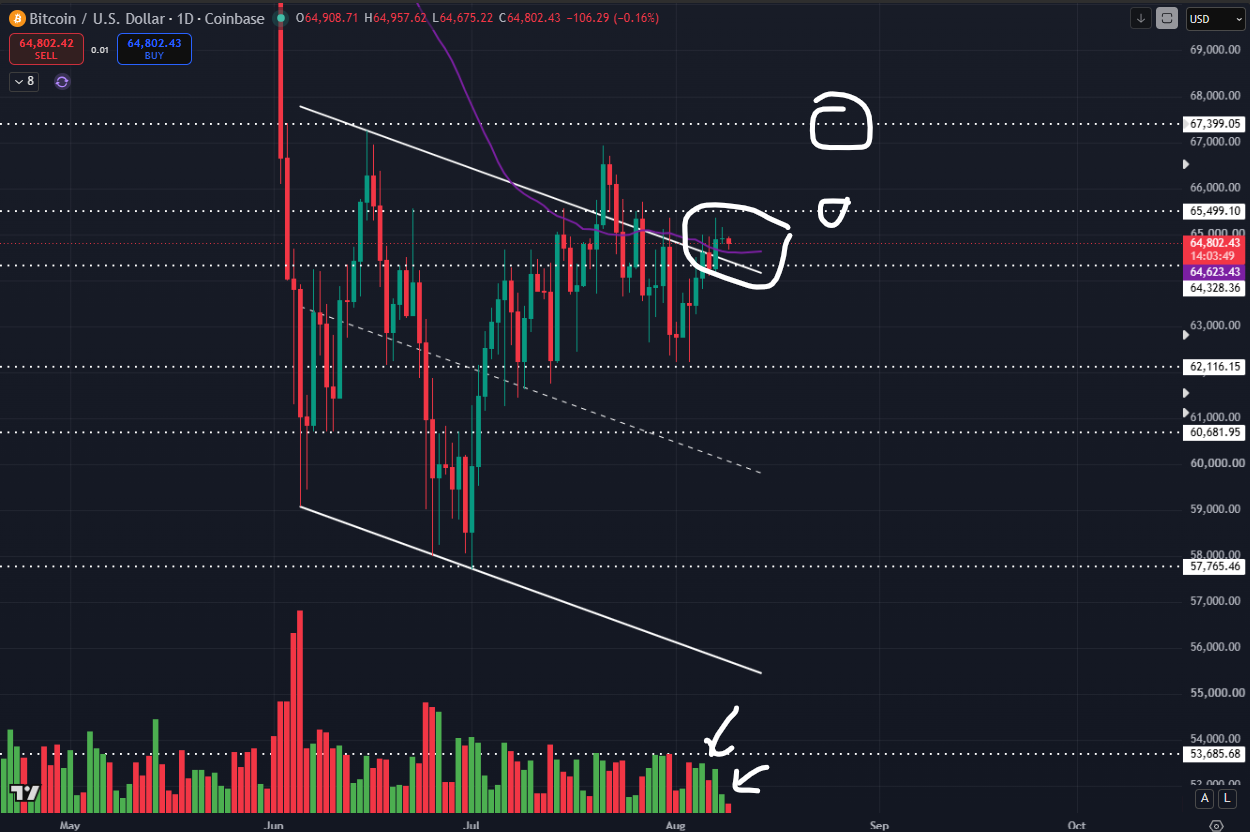
During Thursday’s pullback, volume contracted significantly compared with the volume seen during the previous advance through the 64.3K–65.4K region.
This represents a relatively healthy low-volume retracement, rather than aggressive distribution.
BTC is currently holding above the daily EMA50, represented by the purple line at approximately 64.6K.
The key question going forward is whether the bulls can continue to defend this level.
For those looking to increase their spot exposure or add to long positions, the area around and below the daily EMA50 could provide an attractive buy-the-dip opportunity, provided the structure remains intact.
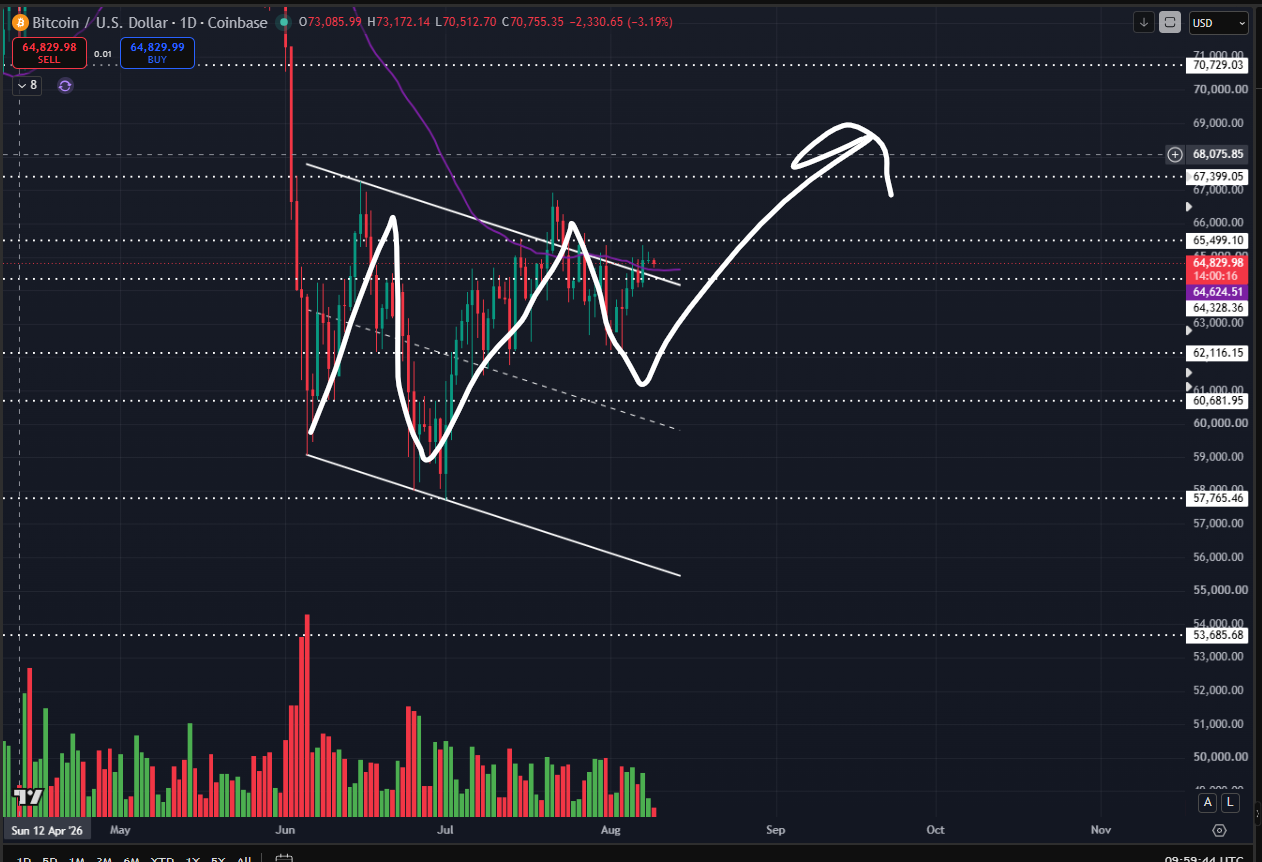
As discussed in previous weekly reports, the typical evolution of a bull flag within a descending consolidation channel often involves the formation of a local higher low or a final bear trap.
This can subsequently trigger a strong upside breakout, allowing price to sweep through the liquidity from trapped shorts as well as previously trapped long positions above the range.
Comments
Nothing yet. Say the first thing.
Sign in to join the conversation.