Loops are used when you need to repeat a part of program. In C, we have loops; through we can repeat a part of program until a condition is satisfied. Learn how to work with Loops in C, including while loop, do-while loop, for loop, break statement and continue statement in C Programming. The post Write a C program To Add Two Integers appeared first on Studyopedia .
Access control is no longer just about unlocking doors. Modern businesses now manage hybrid teams, multiple office locations, third-party vendors, and sensitive operational areas all at the same time. As workplaces become more connected and decentralized, traditional access systems built around keycards and manual permissions... The post How Artificial Intelligence Is Reshaping Modern Access…
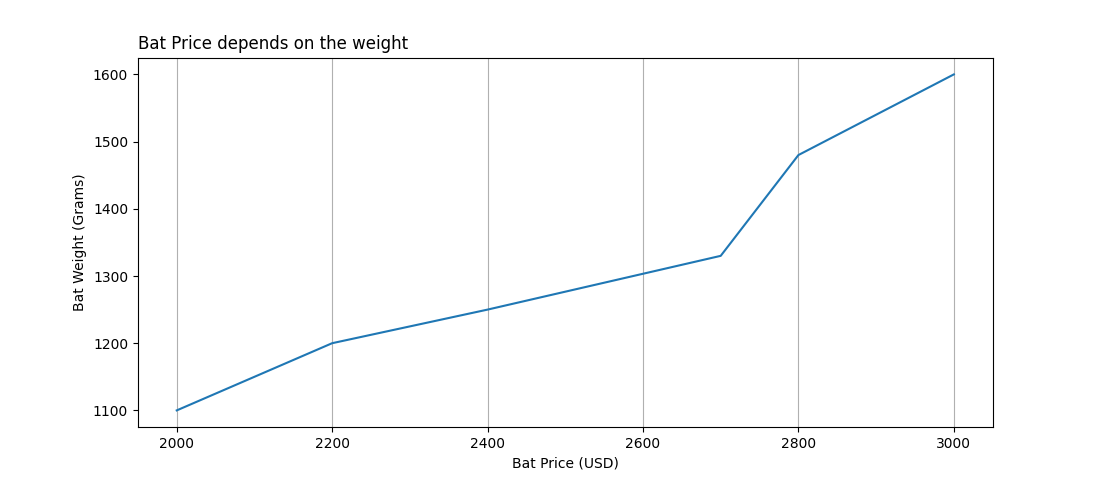
In Matplotlib, add grid lines on the x or y axis using the axis parameter of the plt.grid() function. Let us see an example: # Add Grid Lines on x or y axis import pandas as pd import matplotlib.pyplot as plt df = pd.DataFrame( { "Cricket_Bat":['SG',... The post Matplotlib – Add Grid Lines on x or y axis appeared first on Studyopedia .
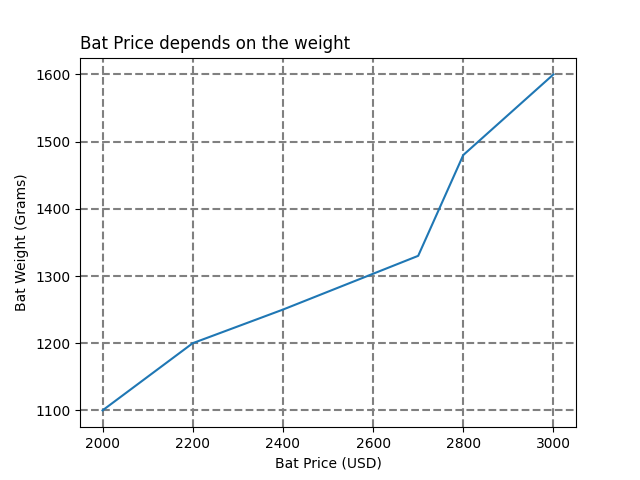
In Matplotlib, set the line properties for the grid using the linestyle and linewidth properties of the grid() function. Key options linestyle: ‘-‘ → solid ‘–‘ → dashed ‘:’ → dotted ‘-.’ → dash-dot linewidth: Controls the thickness of the grid lines (e.g., 0.5, 1, 2). Let us... The post Matplotlib – Set the line properties for Grid appeared first on Studyopedia .
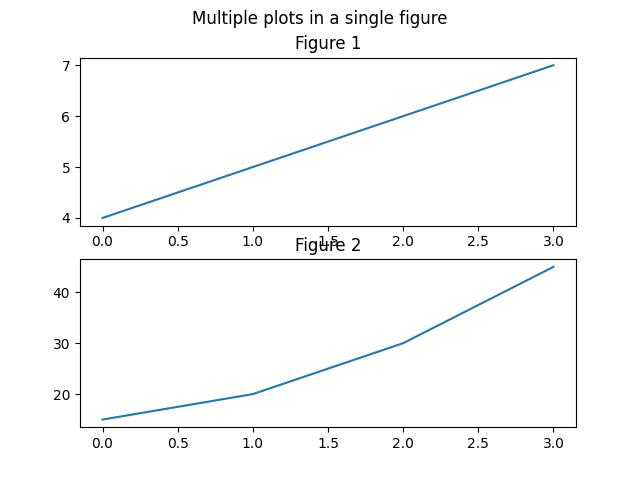
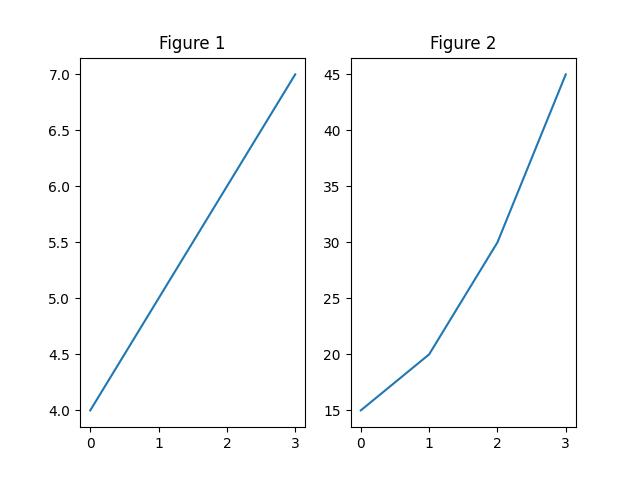
In Matplotlib, add a super title for multiple plots in a figure using the plt.suptitle() function. For multiple plots, we have used the plt.subplot() function. Let us see an example: # Add a super title for multiple plots in a figure import matplotlib.pyplot as plt import numpy... The post Matplotlib – Add a super title for multiple plots in a figure appeared first on Studyopedia .
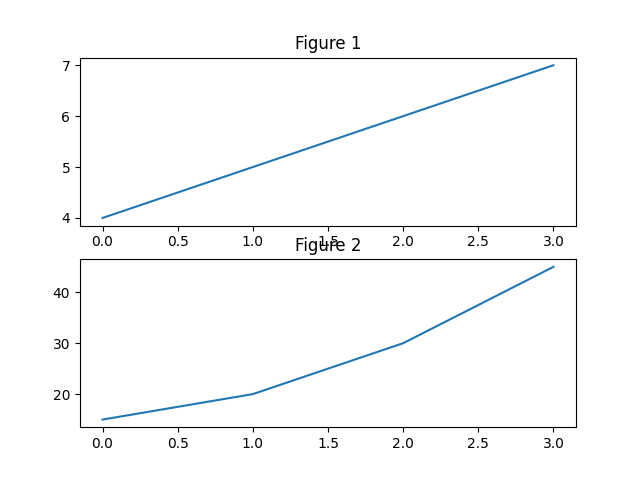
To create multiple plots on top of each other in Matplotlib, set 2 rows and 1 column for the subplot(). Organize multiple plots within one figure by dividing the canvas into a grid using the plt.subplot(). Here is the syntax: plt.subplot(nrows, ncols, index) The following are... The post Matplotlib – Create multiple plots (on top of each other) in one figure appeared first on Studyopedia .
To create multiple plots side by side in Matplotlib, set 1 row and 2 columns for the subplot(). In Matplotlib, organize multiple plots within one figure by dividing the canvas into a grid using the plt.subplot(). Here is the syntax: plt.subplot(nrows, ncols, index) The following are... The post Matplotlib – Create multiple plots (side by side) in one figure appeared first on Studyopedia .
In Matplotlib, you set the marker face color using the markerfacecolor (or its shorthand mfc) parameter in plotting functions like plot() or scatter(). This controls the fill color inside the marker, separate from the edge color. Let us see an example: # Set the Marker... The post Set the Marker face color in Matplotlib appeared first on Studyopedia .
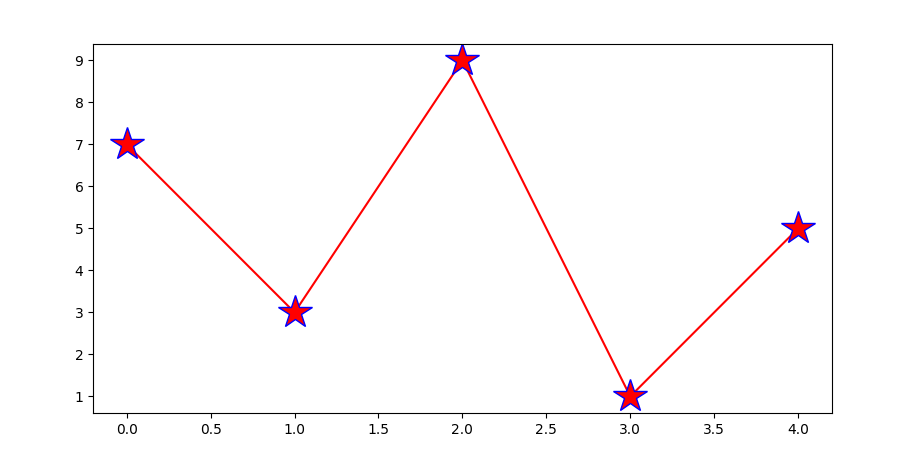
In Matplotlib, you can set the marker edge color using the markeredgecolor parameter (or its shorthand mec) in plotting functions like plot(), scatter(), etc. This lets you control the outline color of markers independently from their fill color. Let us see an example: # Set... The post Set the Marker edge color in Matplotlib appeared first on Studyopedia .
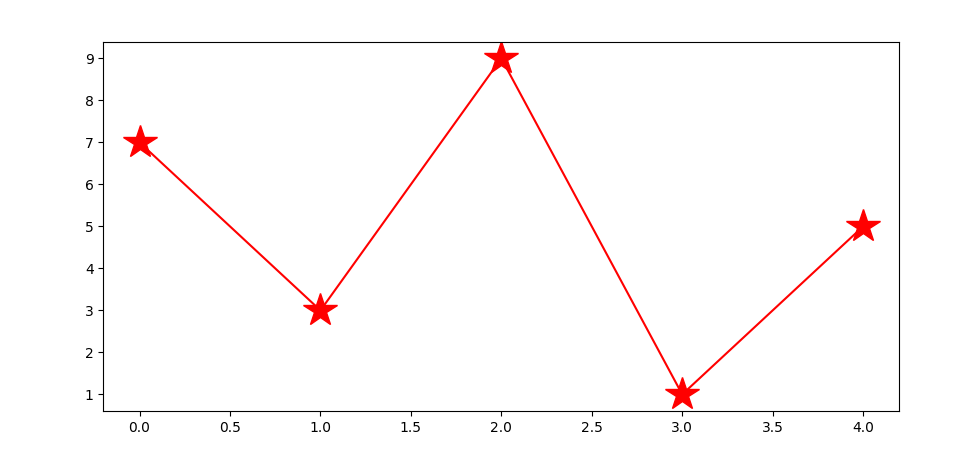
In Matplotlib, marker size is controlled with markersize (shorthand ms) in plot() and the s parameter in scatter(). The key difference is that markersize sets the diameter in points, while s sets the marker area in points. In this lesson, we will set the marker... The post Marker size in Matplotlib appeared first on Studyopedia .