
Stock Watchlist Weekly Special Report
A TimingResearch.com Project
Issue for Sunday, June 26th, 2026
NOT financial advice. Info for Education/Research/Entertainment purposes only.
NEW! Special Bonus Report using the SWW algorithm process:
🟠 [Report] 10 Hottest QQQ Stocks for Summer 2026
Did you know that over the last 15 years the QQQ went up 100% of the time between June 26th and July 21st? The max gain was 10.7% and the average was 4.5%.
Of course there’s no guarantee that trend will hold but this strong seasonal trend provides a good opportunity for a new SWW special report…
For this report, we ran an adjusted version of the Stock Watchlist Weekly Algorithm to select only for NASDAQ100 stocks who are statistically best positioned for market-beating upside over the next month.
The Stock Watchlist Weekly algorithm is an objective process created to analyze thousands of stocks for both technical and fundamental positive indicators and deliver a list of the the best stocks for high-probability, index-beating gain potential, for both short term trader and long-term investor watchlists.
📝 Stock Watchlist Weekly New Algorithm-Generated Selections:
NOTE: The 10 algo-picks are listed in reverse/countdown order…
💡 10) GOOGL - Alphabet Inc
Basic Company Description: Alphabet provides internet services and technology products, including Google Search, YouTube, Android, cloud computing, advertising platforms, and artificial intelligence tools.
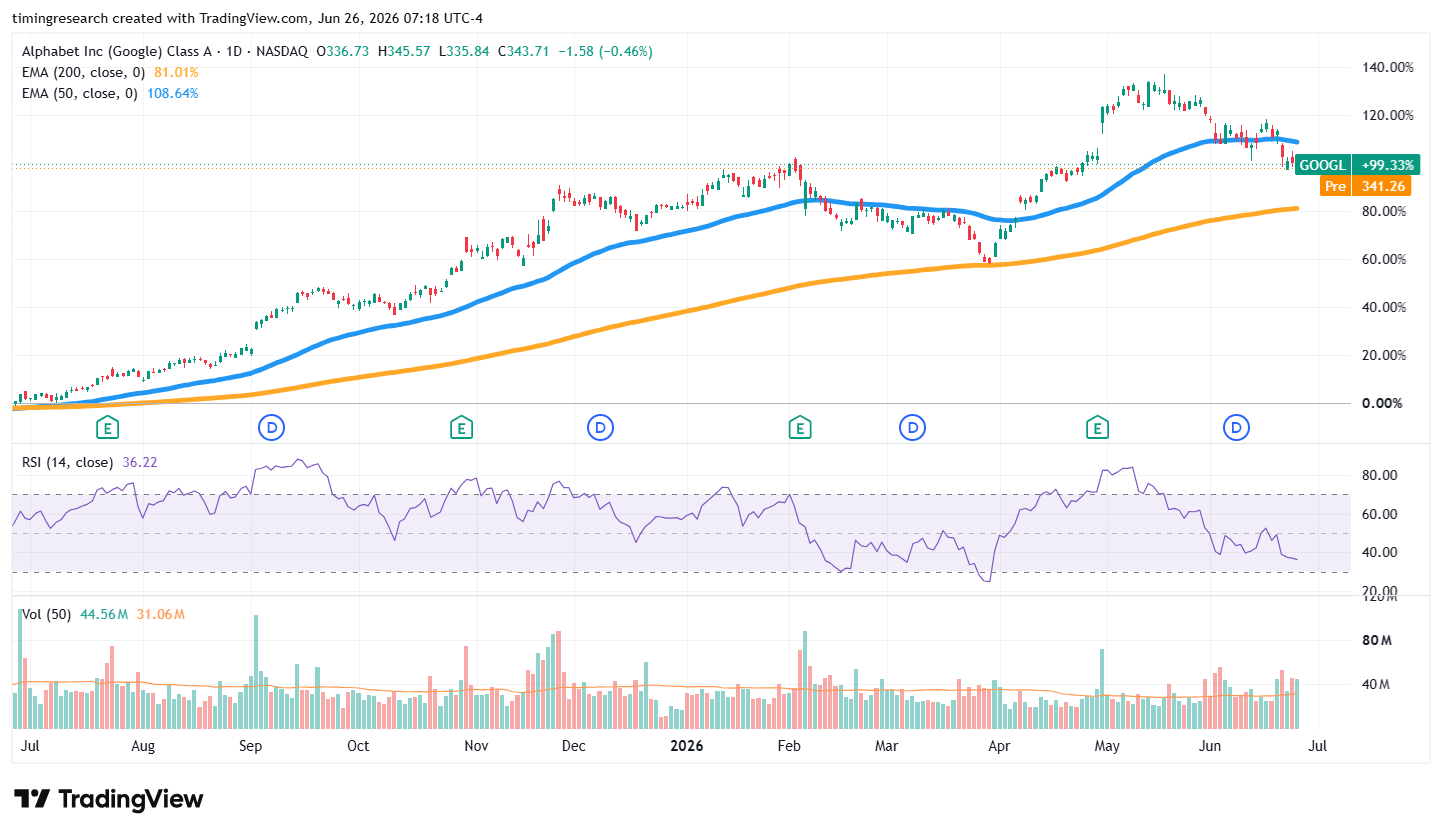
Basic Chart Analysis: GOOGL remains in a longer-term uptrend, with price still above the rising 200-day moving average, but recent action has weakened below the 50-day line. RSI has dropped into the lower range, suggesting short-term momentum has cooled and the stock may need stabilization before resuming a stronger advance.
Sector: Communication Services
Industry: Interactive Media & Services
Market Cap: $2.31T
Volume (Avg): 30616690
Dividend Yield: 0.25
Exchange: NASDAQ
Security Price: $343.92
💡 9) CMCSA - Comcast Corp
Basic Company Description: Comcast provides broadband, cable, wireless, media, entertainment, and telecommunications services through Xfinity, NBCUniversal, Sky, and related businesses.
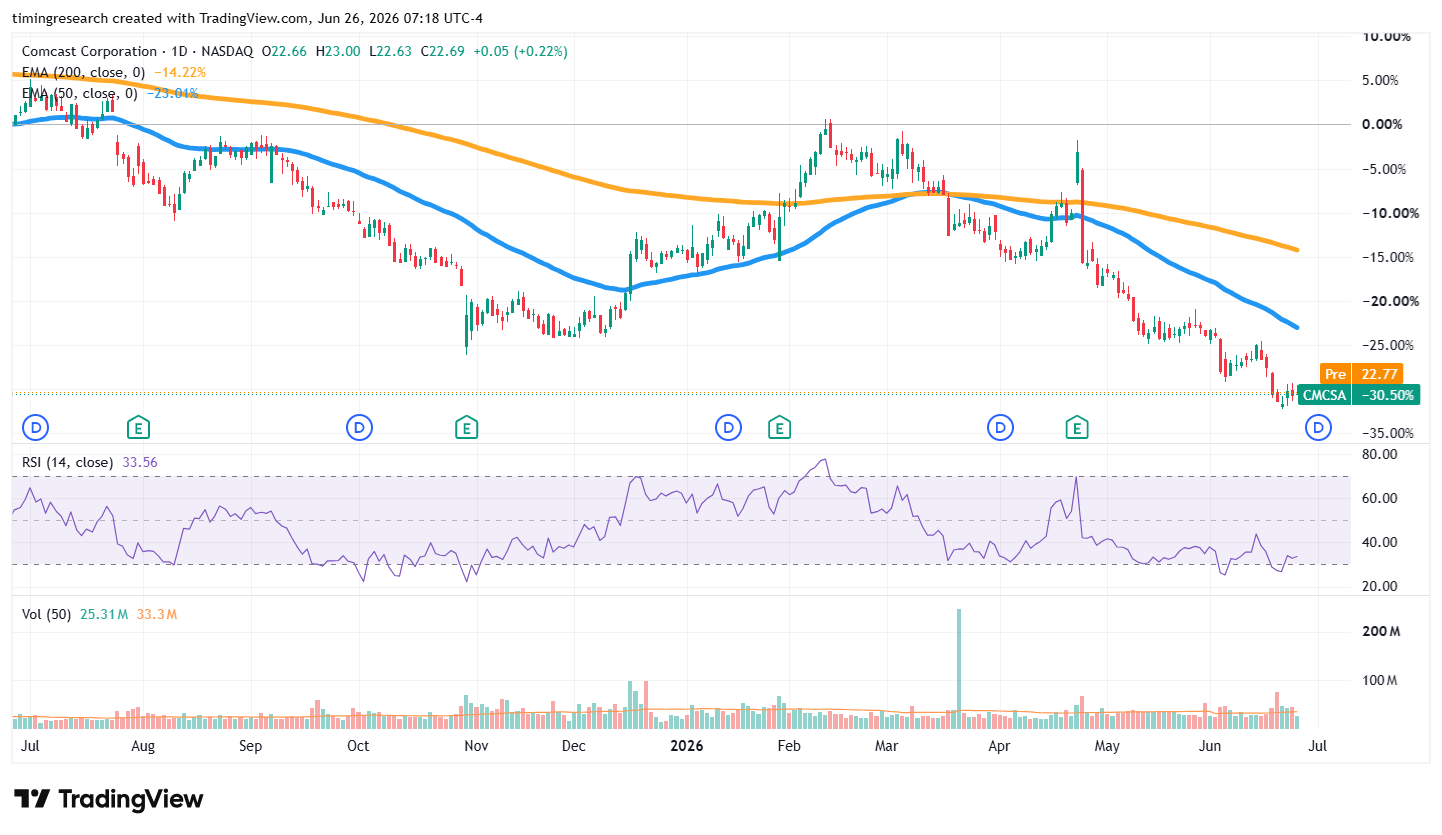
Basic Chart Analysis: CMCSA remains in a clear downtrend, with price below declining 50-day and 200-day moving averages. The stock has continued making lower lows, and RSI is weak, suggesting bearish momentum remains in control unless the stock can form a base and reclaim key moving-average levels.
Sector: Communication Services
Industry: Diversified Telecommunication Services
Market Cap: $80.88B
Volume (Avg): 32460430
Dividend Yield: 5.83
Exchange: NASDAQ
Security Price: $22.88
💡 8) COST - Costco Wholesale Corp
Basic Company Description: Costco operates membership warehouse clubs that sell groceries, household goods, electronics, apparel, fuel, and other consumer products at discounted prices.
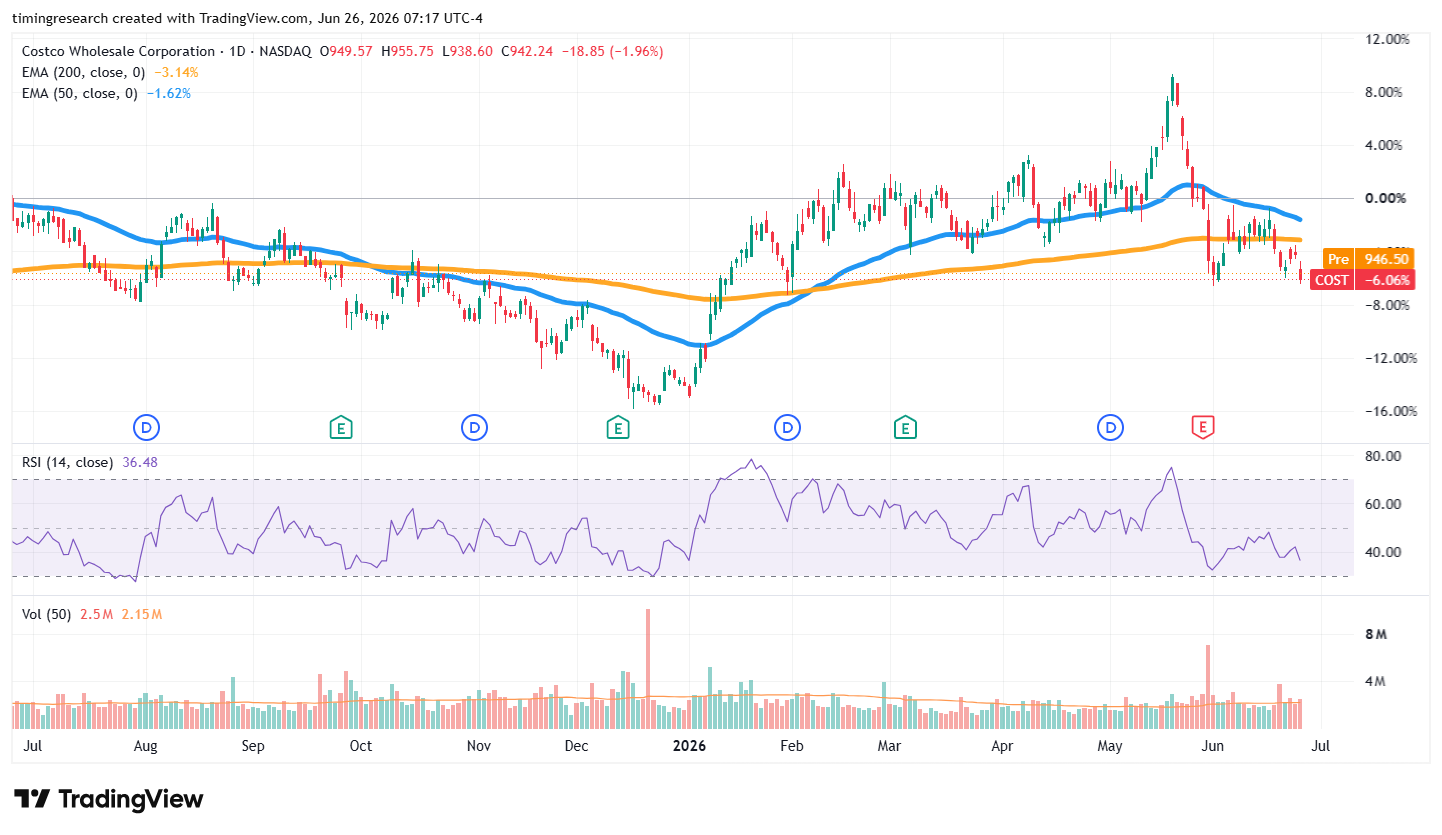
Basic Chart Analysis: COST has been choppy and recently weakened below both major moving averages after a failed advance earlier in the year. RSI is in the lower range, suggesting momentum has cooled, and the chart currently looks soft unless price can stabilize and reclaim the 50-day and 200-day averages.
Sector: Consumer Staples
Industry: Consumer Staples Distribution & Retail
Market Cap: $426.22B
Volume (Avg): 2016630
Dividend Yield: 0.61
Exchange: NASDAQ
Security Price: $947.66
💡 7) FTNT - Fortinet Inc
Basic Company Description: Fortinet provides cybersecurity products and services, including firewalls, secure networking, cloud security, endpoint protection, and threat intelligence solutions.
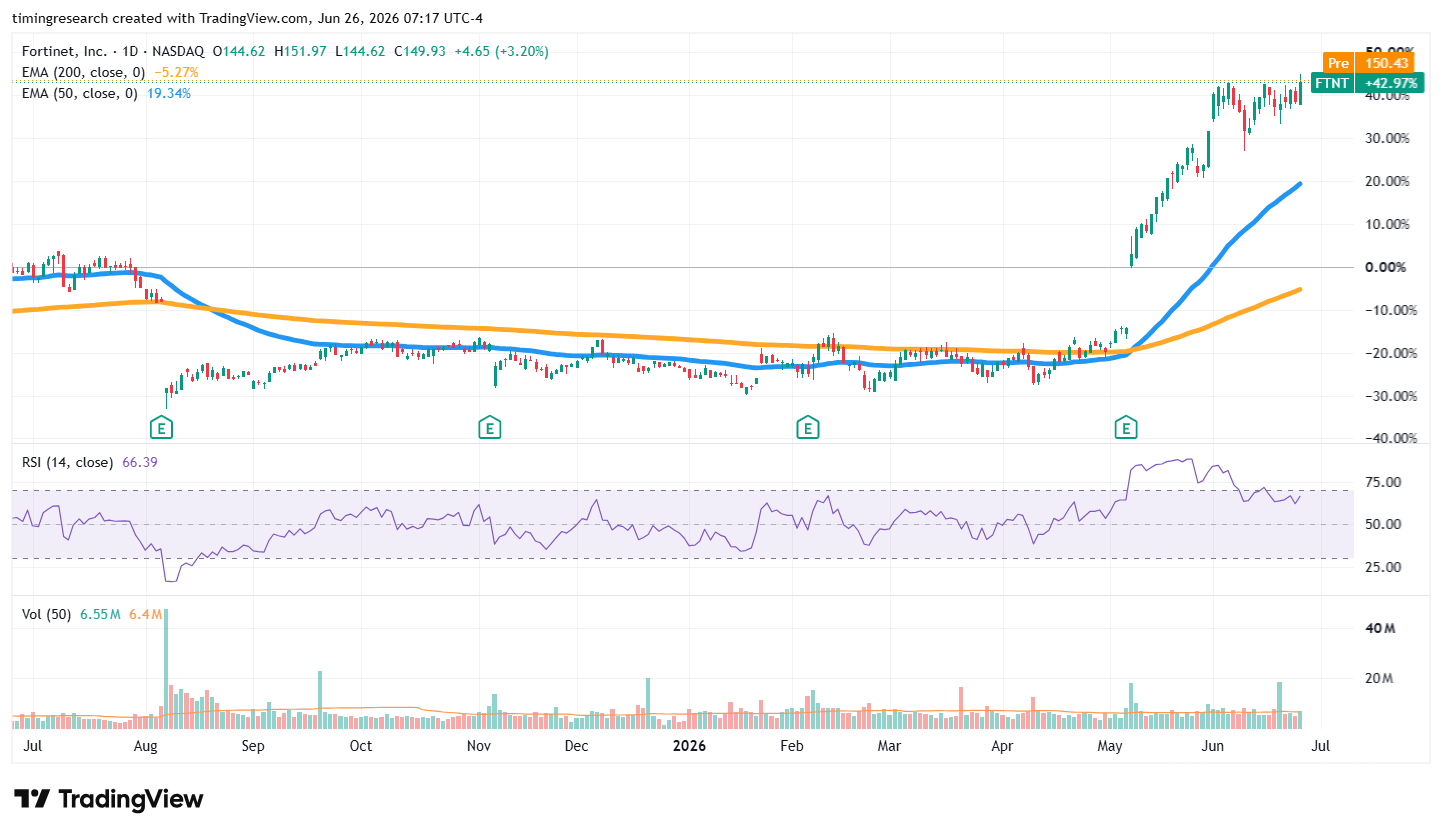
Basic Chart Analysis: FTNT has staged a sharp recovery and now trades well above rising moving averages after a major breakout. RSI remains positive, suggesting strong momentum, but the stock has already made a large move and may need short-term consolidation before another sustained leg higher.
Sector: Information Technology
Industry: Software
Market Cap: $106.44B
Volume (Avg): 6372640
Dividend Yield: none
Exchange: NASDAQ
Security Price: $150.17
💡 6) DXCM - DexCom Inc
Basic Company Description: DexCom develops continuous glucose monitoring systems and related diabetes management technology for patients, caregivers, and health care providers.
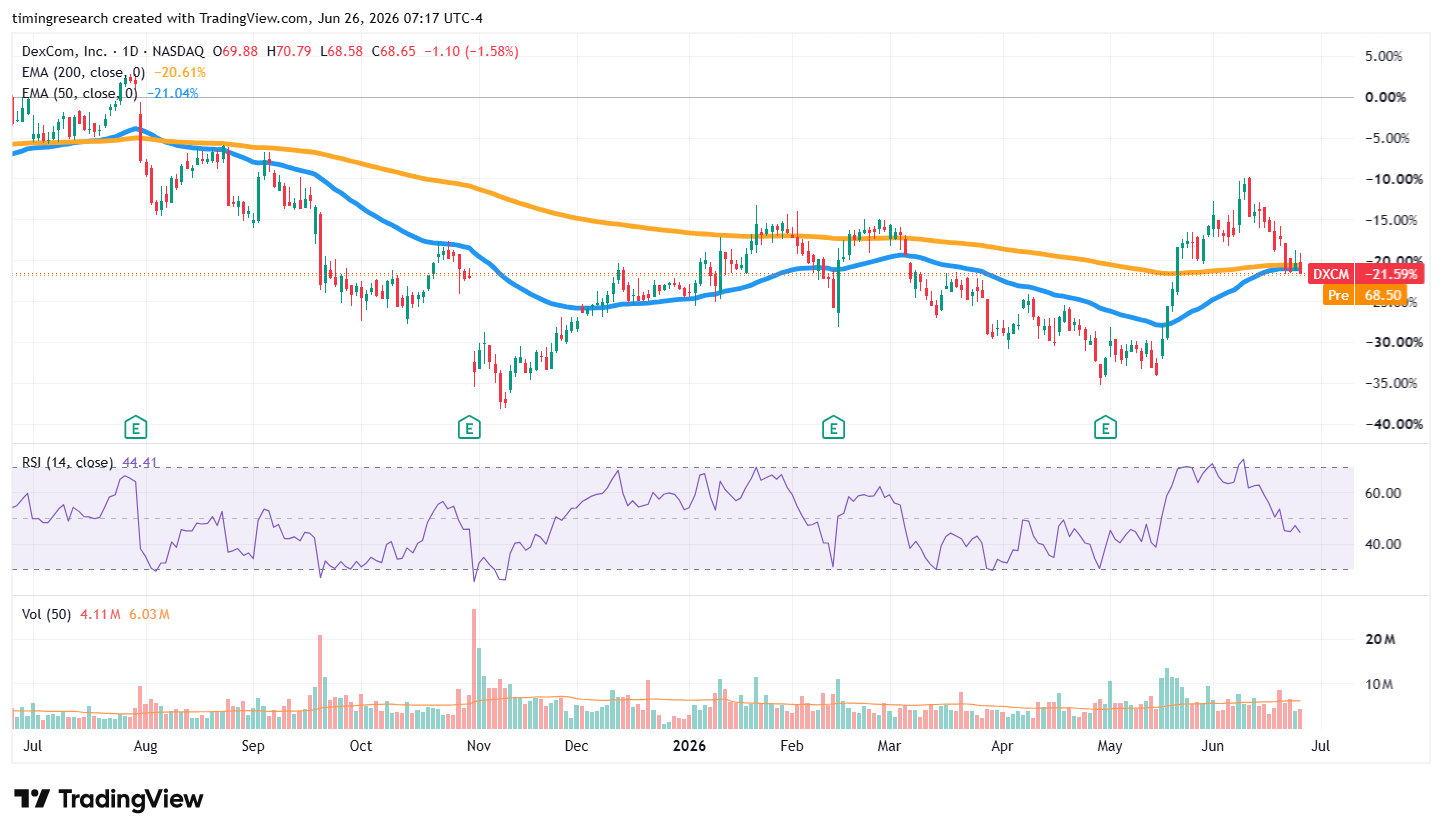
Basic Chart Analysis: DXCM remains technically mixed, with price near its moving averages after a recovery attempt from earlier weakness. RSI has cooled from a stronger level and now sits near the middle range, suggesting momentum has faded and the stock may need more consolidation before confirming a stronger bullish reversal.
Sector: Health Care
Industry: Health Care Equipment & Supplies
Market Cap: $26.91B
Volume (Avg): 5204930
Dividend Yield: none
Exchange: NASDAQ
Security Price: $68.79
💡 5) MNST - Monster Beverage Corp
Basic Company Description: Monster Beverage develops, markets, and sells energy drinks and related beverage products under brands including Monster Energy and other drink lines.
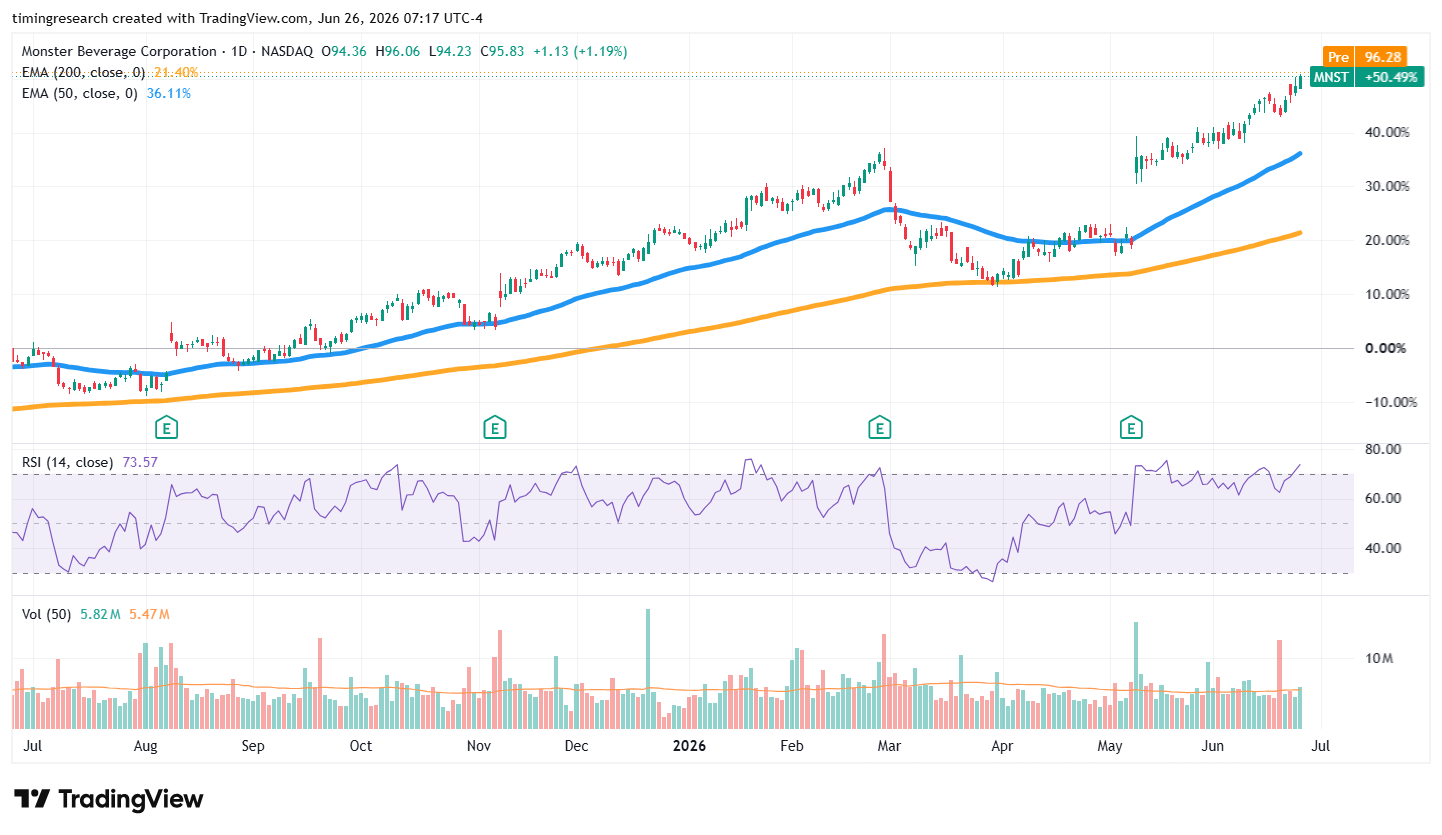
Basic Chart Analysis: MNST is in a strong uptrend, with price above rising 50-day and 200-day moving averages and recently pushing toward new highs. RSI is elevated, showing strong momentum, though the stock may be somewhat extended and could pause or consolidate after the recent advance.
Sector: Consumer Staples
Industry: Beverages
Market Cap: $92.62B
Volume (Avg): 5672480
Dividend Yield: none
Exchange: NASDAQ
Security Price: $96.02
💡 4) CSCO - Cisco Systems Inc
Basic Company Description: Cisco provides networking, cybersecurity, collaboration, cloud, and infrastructure technology products and services for enterprises, service providers, and governments.
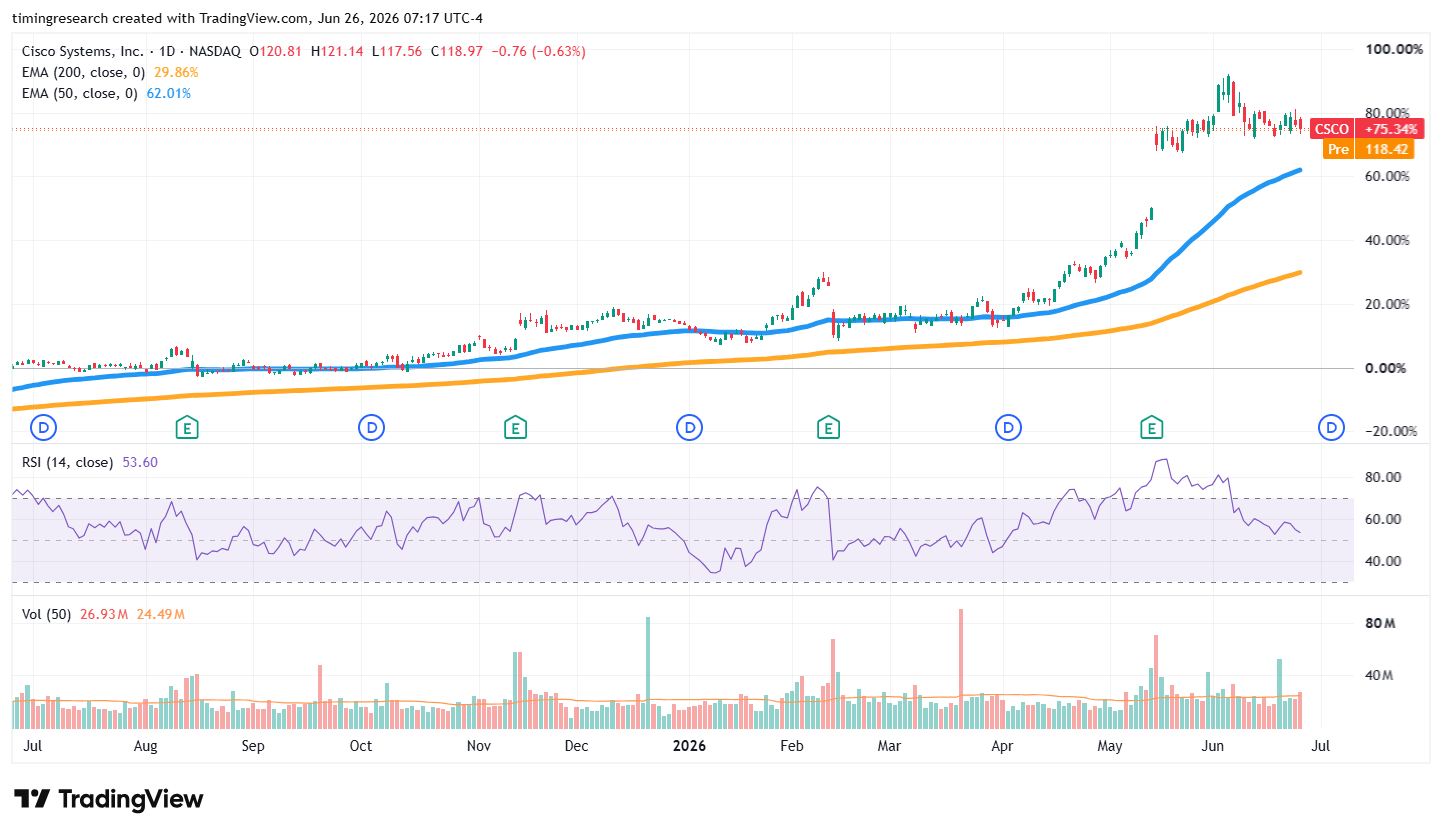
Basic Chart Analysis: CSCO remains in a strong broader uptrend, with price above rising moving averages after a major advance. The stock has recently consolidated near higher levels while RSI has cooled to neutral, suggesting momentum has slowed but the larger technical structure remains constructive if support holds.
Sector: Information Technology
Industry: Communications Equipment
Market Cap: $471.91B
Volume (Avg): 23784740
Dividend Yield: 1.40
Exchange: NASDAQ
Security Price: $118.48
💡 3) WDC - Western Digital Corp
Basic Company Description: Western Digital develops and sells data storage products, including hard drives, solid-state drives, flash memory, and storage platforms.
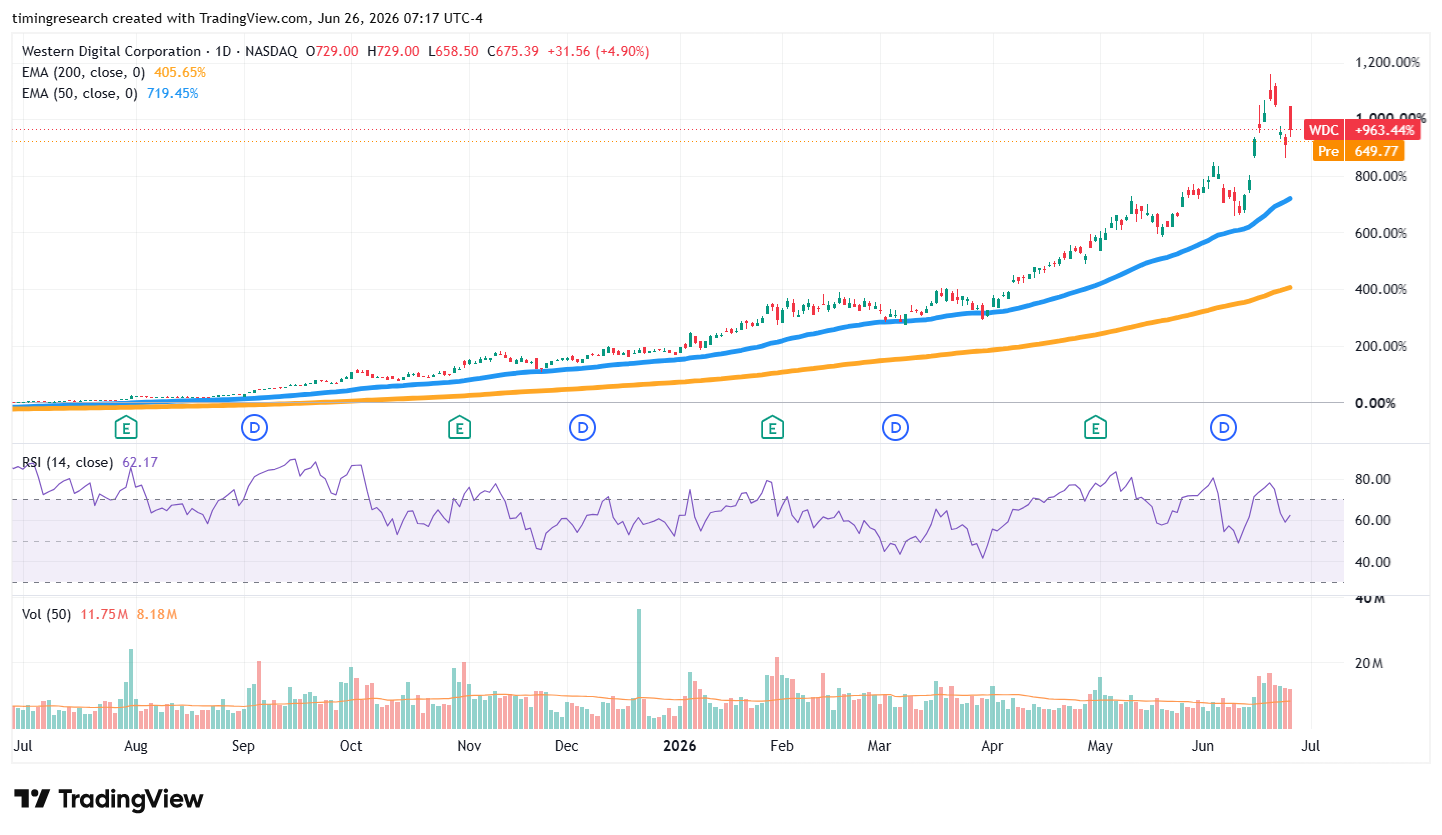
Basic Chart Analysis: WDC remains in a powerful long-term uptrend after a very large advance, with price still far above rising moving averages. Recent action shows a sharp pullback from extreme highs, while RSI remains constructive, suggesting the broader trend is intact but short-term volatility and consolidation risk are elevated.
Sector: Information Technology
Industry: Technology Hardware, Storage & Peripherals
Market Cap: $221.92B
Volume (Avg): 8435010
Dividend Yield: 0.09
Exchange: NASDAQ
Security Price: $667.43
💡 2) TER - Teradyne Inc
Basic Company Description: Teradyne designs and manufactures automated test equipment for semiconductors, electronics, wireless products, storage devices, and industrial automation systems.
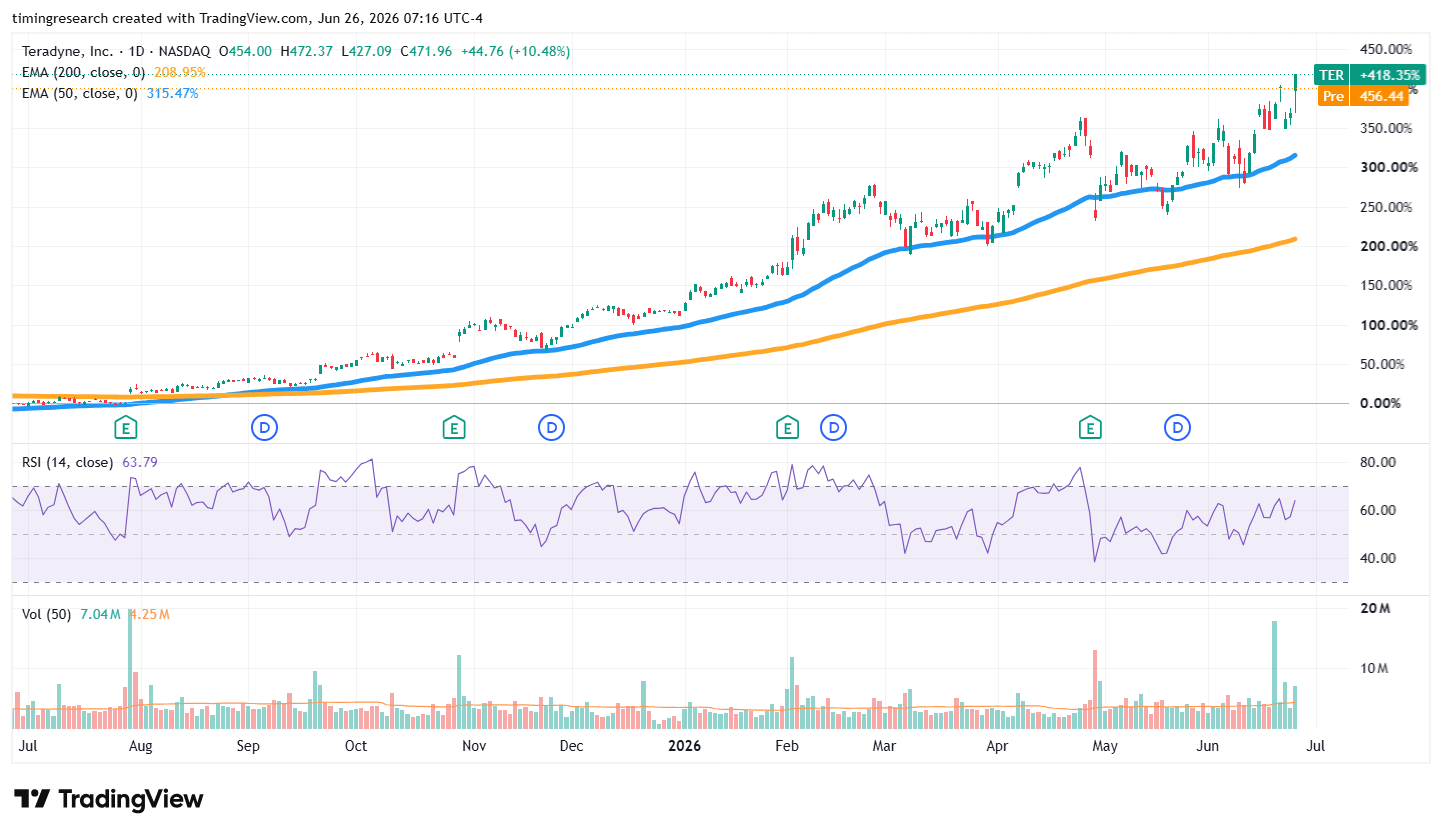
Basic Chart Analysis: TER is in a very strong uptrend, with price well above rising 50-day and 200-day moving averages and recently breaking to new highs. RSI remains positive but not extreme, suggesting strong momentum with potential for continued strength, though the stock is extended after a major run.
Sector: Information Technology
Industry: Semiconductors & Semiconductor Equipment
Market Cap: $66.87B
Volume (Avg): 3741520
Dividend Yield: 0.12
Exchange: NASDAQ
Security Price: $463.08
💡 1) ROST - Ross Stores Inc
Basic Company Description: Ross Stores operates off-price retail stores selling branded apparel, footwear, accessories, and home merchandise at discounted prices.
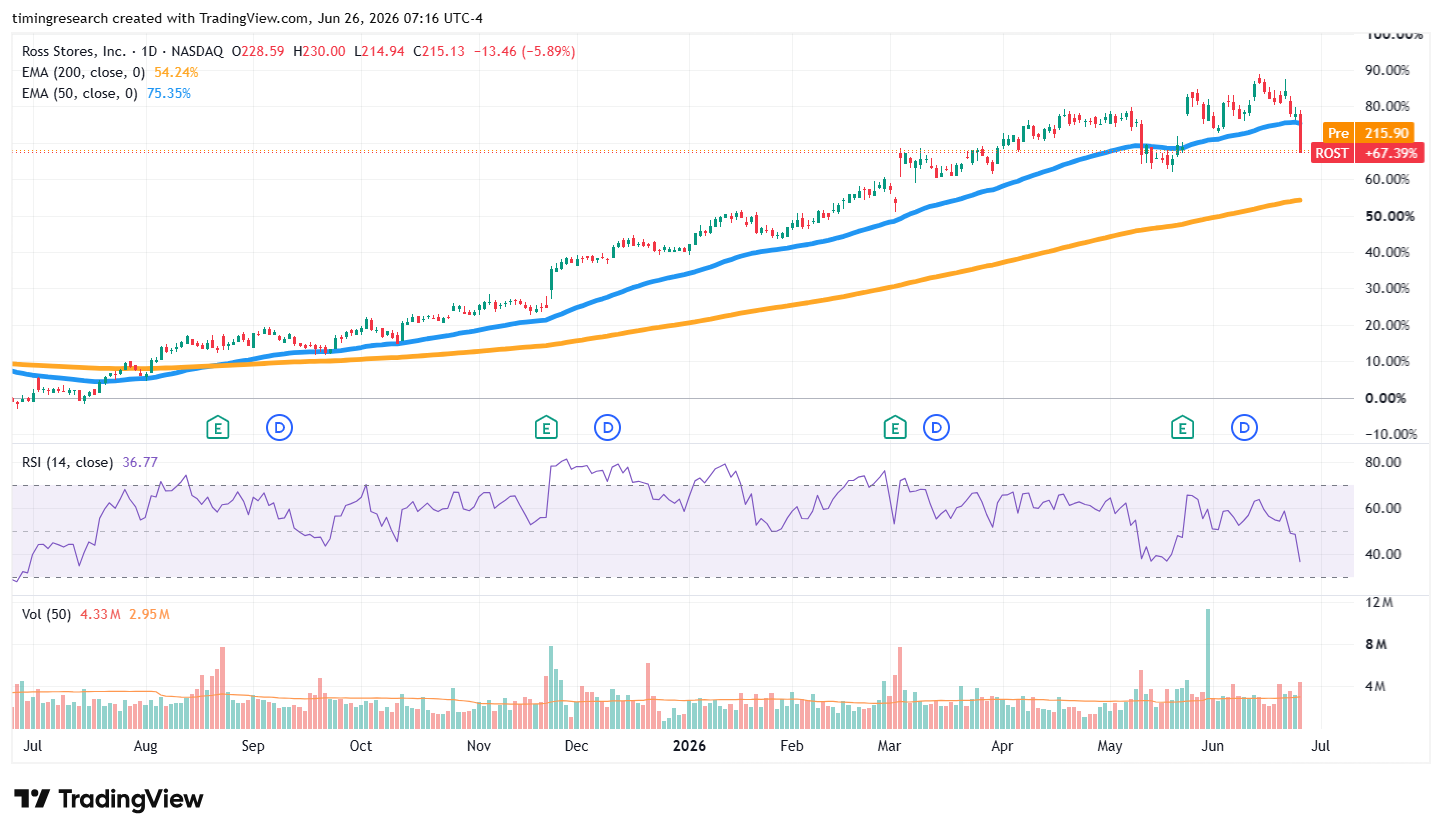
Basic Chart Analysis: ROST remains in a longer-term uptrend, with price still above a rising 200-day moving average, but the latest move shows a sharp break below the 50-day line. RSI has weakened noticeably, suggesting short-term momentum has deteriorated and the stock may need to rebuild support before resuming higher.
Sector: Consumer Discretionary
Industry: Specialty Retail
Market Cap: $73.33B
Volume (Avg): 2822670
Dividend Yield: 0.78
Exchange: NASDAQ
Security Price: $218.35
Other Partner Education:
• [AD] 💡 PDF: Overnight SPY Trader Playbook
• [AD] 🪙 eBook: Learn How Smart Investors Buy Metals
Also On Substack:
• TimingResearch Updates - Free educational events and other resources for traders and investors.
NOT Financial Advice. Intended for Education/Entertainment/Research Purposes ONLY. Some elements of this newsletter content were generated with the assistance of artificial intelligence tools.
FOR EDUCATIONAL AND INFORMATION PURPOSES ONLY; NOT ADVICE. NetPicks Services are offered for educational and informational purposes only and should NOT be construed as a securities-related offer or solicitation or be relied upon as personalized financial advice. We are not financial advisors and cannot give personalized advice. There is a risk of loss in all trading, and you may lose some or all of your original investment. Results presented are not typical. Please review the full risk disclaimer: https://www.netpicks.com/terms-of-use-conditions-of-sale/
We may generate revenue from this and other advertisements.
Statement Of Disclaimer: U.S. Government Required Disclaimer - Commodity Futures Trading Commission. Futures, option, forex and stock trading have large potential rewards, but also large potential risk. You must be aware of the risks and be willing to accept them in order to invest in the futures and options markets. Don't trade with money you can't afford to lose. This website/email is neither a solicitation nor an offer to Buy/Sell futures, options, forex or stocks. No representation is being made that any account will or is likely to achieve profits or losses similar to those discussed on this website. The past performance of any trading system or methodology is not necessarily indicative of future results.
CFTC RULE 4.41 - Hypothetical or simulated performance results have certain limitations. Unlike an actual performance record, simulated results do not represent actual trading. Also, since the trades have not been executed, the results may have under-or-over compensated for the impact, if any, of certain market factors, such as lack of liquidity. Simulated trading programs in general are also subject to the fact that they are designed with the benefit of hindsight. No representation is being made that any account will or is likely to achieve profit or losses similar to those shown.
No posts
Comments
Nothing yet. Say the first thing.
Sign in to join the conversation.