
"Alas! Earwax!"
~Albus Dumbledore in The Sorcerer’s Stone after eating a Bertie Bott's Every Flavor Bean
Until I stumbled across this tweet (see the embed below), I was ignorant of the diagnostic potential of assaying earwax. The tweet, from an apparently MAHA-curious account, asserts that cancer can be accurately detected via biochemical analysis of the metabolites in earwax, and earwax may be superior to “other biological fluids” or biomatrices for early cancer detection due to “a lower turnover rate” and for the obvious reason that it is very easy to obtain. These were intriguing claims I wanted to evaluate.

Helen@anomalie_blue
A team of Brazilian doctors are using earwax to detect tumors with 100% accuracy. Earwax is lipid soluble and has a lower turnover rate than other biological fluids like blood, urine, sweat and tears—making it ideal for detecting longer term changes in metabolism. The team hopes
5:36 PM · Jan 12, 2026 · 526K Views
110 Replies · 2.7K Reposts · 19.4K Likes
First, some background.
Earwax is the oft forgotten little brother of biological substances despite being pretty accessible via Qtip (Of course, the recommendation is to never use these to clean your ears!). We carefully remove it in private, discard, and quickly forget. The medical term for earwax is cerumen from Latin, cēra, meaning "wax" and"-umen" being a suffix that indicates a substance.
Cerumen is quietly complicated—the usual story in biology. It’s not just simply a recrudescence of grime that simply protects the ear drum. It’s a layered secretion, rich in lipids and other molecules, shaped by glands, microbes, skin chemistry, and genetics. Lots of factors shaping its content. Its properties vary between individuals and within individuals over time.
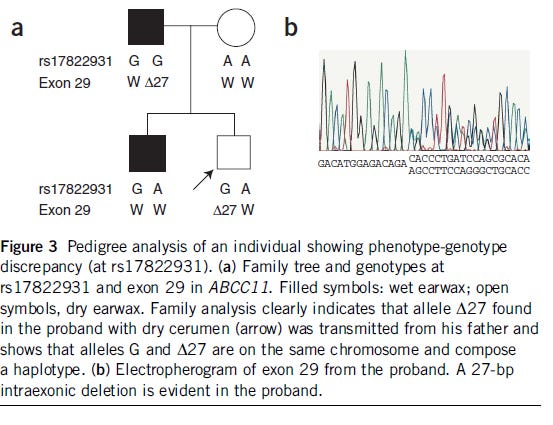
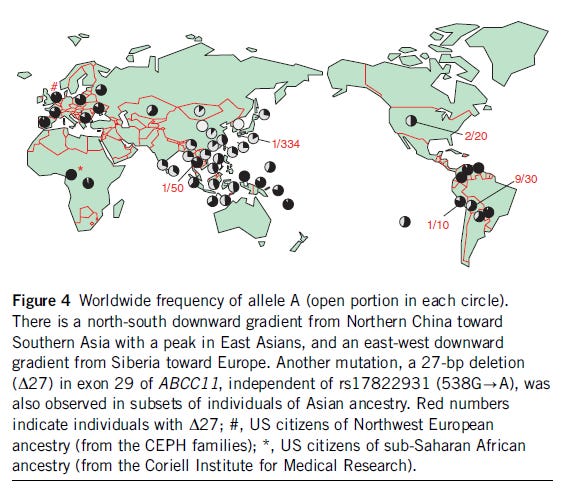
In fact, on the genetics front of earwax consistency are actually surprisingly well-described, a bit of an exception from the failures of the candidate gene era. There is a famous variant in ABCC11 that influences whether an individual has “wet” or “dry” earwax, ABCC11 (rs17822931, 538G>A). The G allele (GG/GA genotypes) results in wetter earwax, linked to body odor, while the A allele (AA genotype) produces dryer earwax, with little odor. The allele frequencies differ across populations, with dry earwax being much more common in East Asian populations than in many others, a pattern likely caused by natural selection.1
Of course, earwax is sticky partly by design. There to trap dust, pollen, spores, and whatever else drifts into the ear canal. But in trapping the outside world, it may also preserve an imprint of the inside one, potentially making it a great source of easy-to-access clinically useful biomarkers.
If diagnosing a seemingly distant or unrelated disease in the body from earwax sounds too much like science fiction, let’s try to dispense with that reflexive skepticism. We’re living in the era of precision medicine powered by next-generation diagnostic technologies, the hunt for ever more sensitive and specific biomarkers that can be assessed from specimen obtained non-invasively or minimally invasively has been intense and successful. Many of these approaches are now standard-of-care for numerous indications with a commercial assays at the ready. For example, Exact Sciences' Cologuard, a stool DNA-based screening test for colorectal cancer, already does billions in sales as does Natera’s Signatera, a bespoke assay that analyzes a patient’s blood for circulating tumor DNA after effective treatment.2
The idea that various diseases may leave a signature in earwax that can be reliably detected with a diagnostic assay is very plausible and potentially exciting. The question is whether it actually works!
As of 2019, this is what a team of Brazilian scientists has claimed. They pioneered a method dubbed the “cerumenogram.”3 Their published paper appeared in Scientific Reports4 with the bold assertion that earwax contains a chemical fingerprint capable of distinguishing people with cancer from people without cancer. They also reported remarkable results, perfect discrimination between cancer and non-cancer patients.
In this retrospective case–control study, the authors present evidence of their proof-of-concept “cerumenogram” by analyzing earwax (cerumen) as a diagnostic biomatrix for cancer. Cerumen was collected at an oncology unit in Goiás, Brazil from 102 volunteers, split into a cancer group (n=52; ages 33–83) and a cancer-free control group (n=50; ages 2–65); cancer cases included carcinoma (n=28), lymphoma (n=11), and leukemia (n=13), spanning a range of times since first diagnosis (0–6 months, 6–12 months, and 1–5+ years) and including patients with and without chemo/radiotherapy. Samples were collected with a metallic curette, frozen at −20 °C, and analyzed within 7 days using headspace gas chromatography–mass spectrometry (HS/GC‑MS). The authors identified 158 volatile organic metabolites (VOMs) across several chemical classes. To reduce potential confounding from ethnicity/race and other variability, they transformed the dataset into a binary presence/absence matrix and applied a genetic algorithm–partial least squares (GA‑PLS) feature selection, which yielded 27 VOMs as a candidate biomarker set. Using these 27 features, hierarchical cluster analysis (HCA) perfectly separated all samples into cancer vs control groups (reported as 100% discrimination/efficiency in this dataset), while not separating samples by cancer type or by treatment status. Their additional analyses suggested the separation was not driven by patient sex. The authors conclude that cerumen volatilomics could provide a fast, low-cost, noninvasive preceding test (they estimate ~3 hours and ~$50 per sample). The makings of a holy grail diagnostic. But wait!
As proof-of concept results go, these are initially exciting, but we shouldn’t immediately declare victory for the cerumenogram. Beyond the obvious design limitations like the small sample size derived from a single center and the use of a retrospective case-control design, there are other issues that should give us pause. Without digging into every detail, suffice to say, there are a lot of alternative explanations for their results such as confounders, artifacts, contamination, and modeling mistakes (i.e. overfitting) and the methods themselves may simply have overfit a model to their data.5 Taken together, the study is best viewed as intriguing, warranting replication rather than as evidence that cerumenograms are already “highly accurate” and or anywhere close to clinical primetime. A prospective, matched, multi-site trial is needed big time.
Unsurprisingly, the story changes when datasets grow and mature. There was almost no chance the 100% discrimination between cancer and non-cancer patients was going to stand. Unfortunately, there are just two papers that further pursue cerumen analysis in a diagnostic context, e.g. as a potential cancer biomarker, in the last six years. One is a follow-up on the original 2019 work from the same Brazilian team lead by João Marcos Gonçalves Barbosa. The other is point-of-care cerumen analysis from a German team.
The paper form the Brazilian scientists is large, mostly internal follow-on case series that keeps the same core cerumenogram assay (i.e. cerumen collection → HS/GC‑MS volatiles → binary feature matrix → multivariate/statistical classification) but changes the modeling narrative and the way its performance is reported. Methodologically, they analyze cerumen from a much larger sample of 751 volunteers. including 531 individuals with a “proven diagnoses of cancer” and 203 individuals “without a prior diagnosis of cancer,” plus a small “precancer/benign” groups. The authors explicitly frame the output as “oncological risk” vs “oncological risk‑free.” They retain the same high-temperature headspace extraction conditions (i.e. 160 °C for 60 min) and essentially the same long GC program as the 2019 work, and they still convert the HS/GC‑MS output into a presence/absence matrix. Compared with 2019, they do add some practical rigor around operations, e.g., instructing participants not to clean ears or use products around the ears for 15 days, having otolaryngologists screen out acute otitis media, using an internal standard, randomizing vials in batches, and placing QC blanks spiked with internal standard across batches to monitor drift. These are meaningful, more grown-up lab steps that the 2019 paper either did not emphasize or did not document as clearly.
Statistically, the 2025 paper arguably improves on some of the weaknesses of the original work, i.e. no out-of-sample validation attempt. For instance, they provide a logistic regression classifier with standard tenfold cross‑validation, reporting an area under the curve (AUC) of 0.916 (0.858–0.974), sensitivity of 0.904 (0.904–0.984), and specificity of 0.880 (0.790–0.970). The cerumenogram appears to distinguish between cancer and non-cancer cases well, though most of the prior caveats still apply, meaning this may still mean nothing.
So in the loosest sense, this is a clear replication, but in the stricter sense of forwarding an assay that could someday plausibly meet the standards of used for identifying valid clinical biomarkers, this work is still nowhere near that rigor.6
The independent follow-up from the German team is also very tentative and proof-of-concepty. It shows that a workflow using surface-enhanced Raman spectroscopy (SERS) plus machine learning (i.e. principal component analysis and linear discriminant analysis or PCA-LDA) can discriminate head and neck cancer (HNC) from controls. The authors use individual-level cross-validation, but the sample is extremely small (N = 13) and the topline claims are presented as stronger than what the design can reasonably support. Nonetheless, the approach, if scaled and controlled properly, looks a bit more promising than what the Brazilian group was attempting. It seems mechanistically more plausible given the proximity of HNC to the ears and the known microbiomic association with HNC.
Together, it is clear that cerumenogram development is still in its infancy and could easily be a dead-end. Even from a proof-of-concept perspective, there are some missing fundamentals and biomarker validation is always hard. For instance, it would be great to see the identified predictive metabolites in the cerumen be biologically connected to the condition for which they discriminate. Nevertheless, I won’t entirely give up on the zany hope that cerumen could be a source of clinically meaningful biomarkers. However, the apparent lack of research interest beyond these few papers may suggest there are even more reasons to be pessimistic about this possibility despite how easy it is to dig out a little earwax.7
The evidence suggests cold adaptation in the last 2000 or so generation. This is indicate by an association with absolute latitude. See PMID: 20937735.
The search term “cerumenogram” only returns two results in pubmed, while “cerumen analysis” returns 277 hits with 75 coming post-2019.
The 2024 Impact Factor (IF) for Scientific Reports is ~3.9, meaning articles from 2022-2023 were cited about 3.9 times in 2024 on average. This is a very average impact factor.
Here’s a rundown of some of the study issues, which I’ve placed here for brevity in the main article:
First, there is poor age matching. The controls span 2–65 years, while cancer cases span 33–83 years, meaning many controls are children/younger adults whereas all cancers are in older adults. This type of imbalance that could very well drive systematic metabolic and exposure differences unrelated to cancer. Second, the study pools heterogeneous diseases (carcinoma, lymphoma, leukemia) and heterogeneous clinical contexts (variable time since diagnosis; treated vs untreated) without stratified analyses that would show whether the signal is stable across tumor types, stages, treatments, and comorbidities. Indeed, the authors concede that they cannot discriminate cancer types. Third, the pre-analytic and analytic workflow leaves ample room for confounding so the result may themselves be artifacts.
Methodologically, the topline finding of“100% discrimination” is likely vulnerable to overfitting. The authors use a supervised feature-selection method (GA‑PLS) to choose 27 VOMs out of 158 and then demonstrate perfect separation using hierarchical clustering (HCA) on the same dataset; there is no true held-out test set or external validation cohort, and HCA dendrogram separation after label-informed feature selection is not a reliable estimate of generalization. The paper mentions “contiguous cross-validation” as a GA‑PLS parameter, but it does not present a proper cross-validated (or externally validated) classification performance estimate with uncertainty (e.g., sensitivity/specificity with confidence intervals), nor does it show stability of selected features across resamples. The authors later acknowledge that several GA‑PLS-selected variables are “not important” and can be removed without changing discrimination, which is a warning sign for feature instability. The decision to binarize peaks as present/absent to “avoid” ethnicity/race effects is also questionable: it discards quantitative information and can amplify sensitivity to detection thresholds, instrument drift, and batch effects; moreover, the study’s check for race/ethnicity influence is limited to an HCA visualization rather than rigorous adjustment or stratified validation.
There are also red flags about contamination and specificity. Two of the highlighted compounds include phthalates (e.g., diisobutyl phthalate and bis(2‑ethylhexyl) phthalate), which are common environmental/laboratory contaminants and plasticizers; without strict blank controls, materials audits, and contamination tracing, it is hard to interpret these as tumor biology rather than sampling/handling artifacts. More broadly, many of the discussed VOMs have plausible exogenous sources (diet, smoking, air contaminants), but the paper does not report tight control of these variables beyond a general questionnaire description.
We still need testing on independent cohorts with a prespecified locked model, matched controls, and prospective enrollment, and external validation.
This could change if ctDNA is identified in cerumen given the sensitivity of ctDNA analysis. I’m interested in trying to figure out if any tumor DNA could plausibly be shed in earwax or if anyone has looked. This seems pretty unlikely but should definitely check and the SERS method would be useful in this context still as would next-generation sequencing approaches.
Comments
Nothing yet. Say the first thing.
Sign in to join the conversation.