

Let me start by saying that it appears you may not like podcasts. I can tell this by lack of engagement with my two podcasts last week, as well as by the number of subscribers lost after posting each of these.
Heard.
That said, I feel there is a lot of very useful and interesting content I can get to the audience in the podcast format, but I will endeavor to try and find a way, perhaps just via Notes, that those that enjoy can still get but those that read the weekly will not be bothered by.
Now, back to the original programming.
The Economy
Long-time readers will remember my post “Three Body Problem” where I laid out the three categories I use to follow the markets and why. Other of you will at least be aware that I break my analysis into Fundamental, Behavioral and Catalyst.
This week, I want to spend some time on the Fundamentals category, because frankly I think we have gotten some useful information that we all need to be aware of.
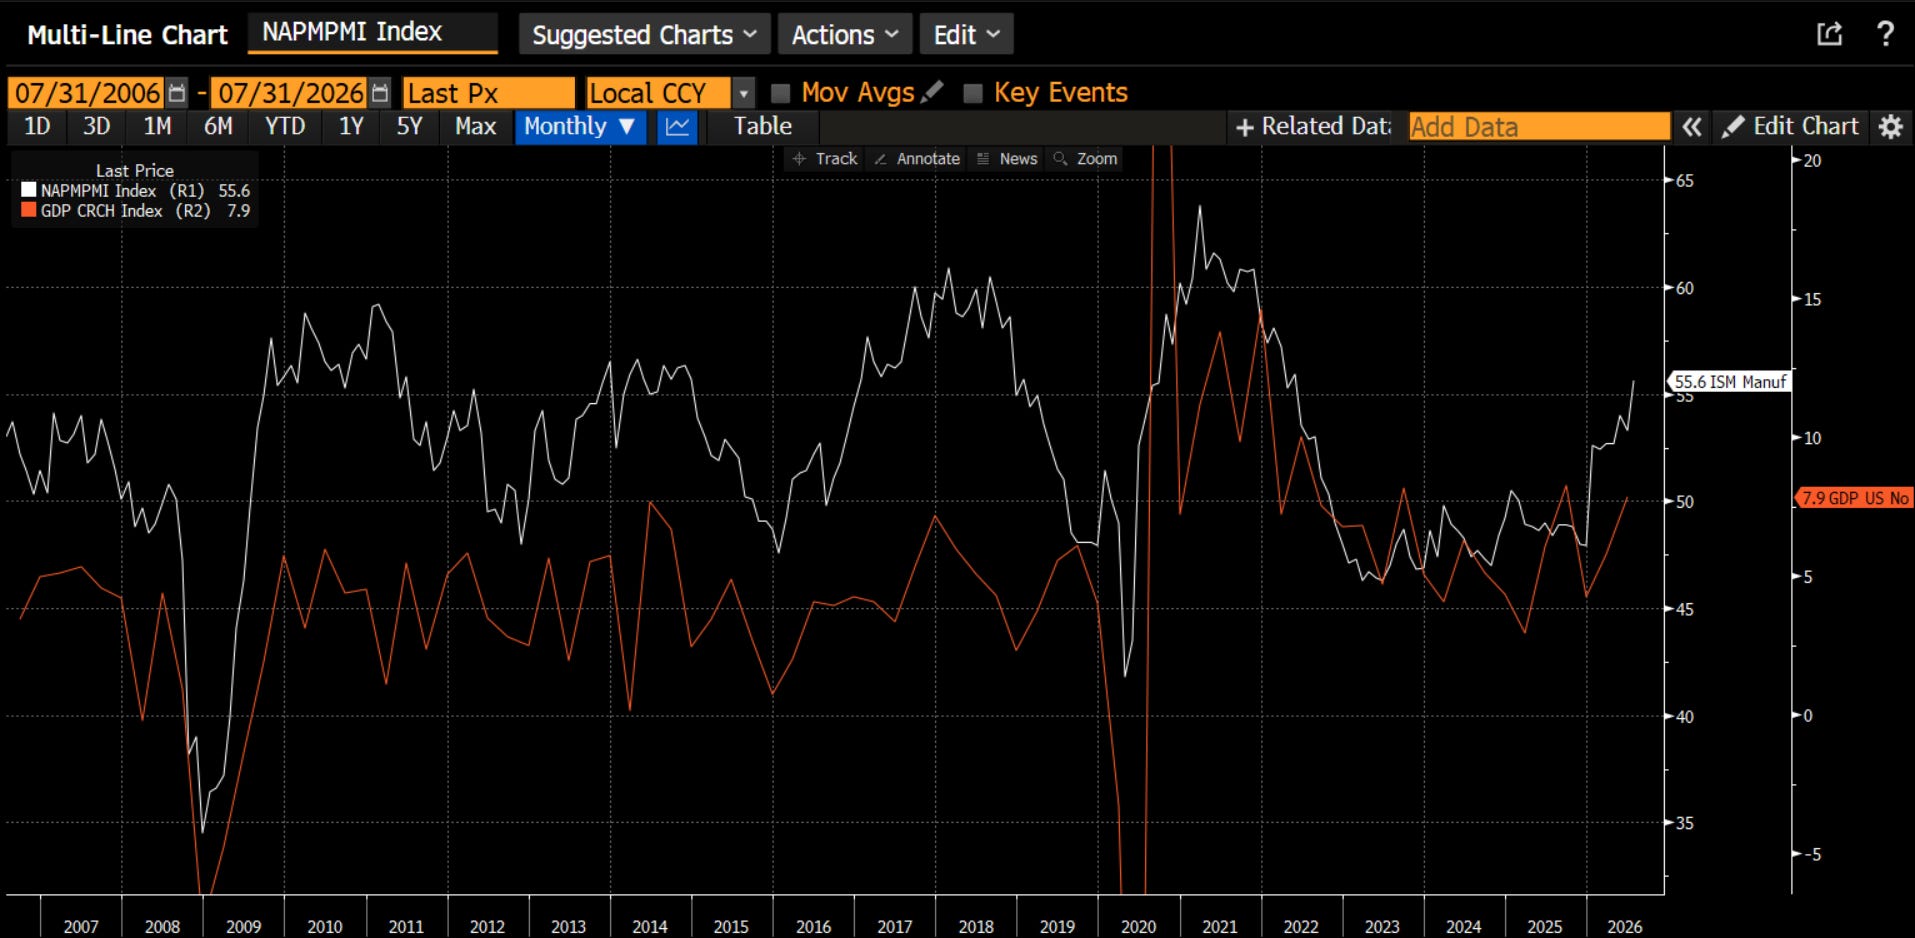
My preferred measure of the economy is ISM and not GDP; however, they are interlinked not surprisingly.
As I wrote today on LinkedIn:
It is sometimes derided because it is 'soft data' i.e. it is survey data. However, according to its website: "The Institute for Supply Management (ISM) compiles its data through structured surveys of a nationally representative panel of supply management and purchasing professionals, with methodologies designed to produce reliable, timely economic indicators." It is determined by industry category and each industry's contribution to GDP. In addition, the questions it asks fall into 5 categories - Orders, Inventories, Production, Employment and Deliveries. These categories all make up the categories of the Leading Economic Indicators In addition, it asks about Price levels that each member is seeing in the economy As a result, the data leads the 'hard data' like GDP which takes months to report and ultimately adjust to get right. It is coincident with other leading indicators like the stock market. It leads things like bond yields and earnings surprises Thus, it is quite useful Yesterday, it came out at 55.6, better than the 53.9 expected and 53.3 last month. This is the highest reading since 2022 I'll say that again - the economy is the strongest it has been since 2022 Perhaps there is something to the lagged effects of 150 bps of rate cuts CS did a study a few years ago that show the returns to the SPX when the ISM is above or below 50 and rising or falling. The best returns were when we were below 50 and rising i.e. coming out of the depths of recession. Whether we were rising or falling, returns were positive above 50 Fund managers know that if ISM is above 50, they need to be fully invested The chart today shows how ISM leads nominal GDP. Nominal GDP is tied to bond yields. Many in the market think the bond market is rejecting either Trump, Warsh or both. In reality, perhaps it is just resetting to a much stronger economy than it had anticipated. Remember, there were rate CUTS priced into the market earlier this year
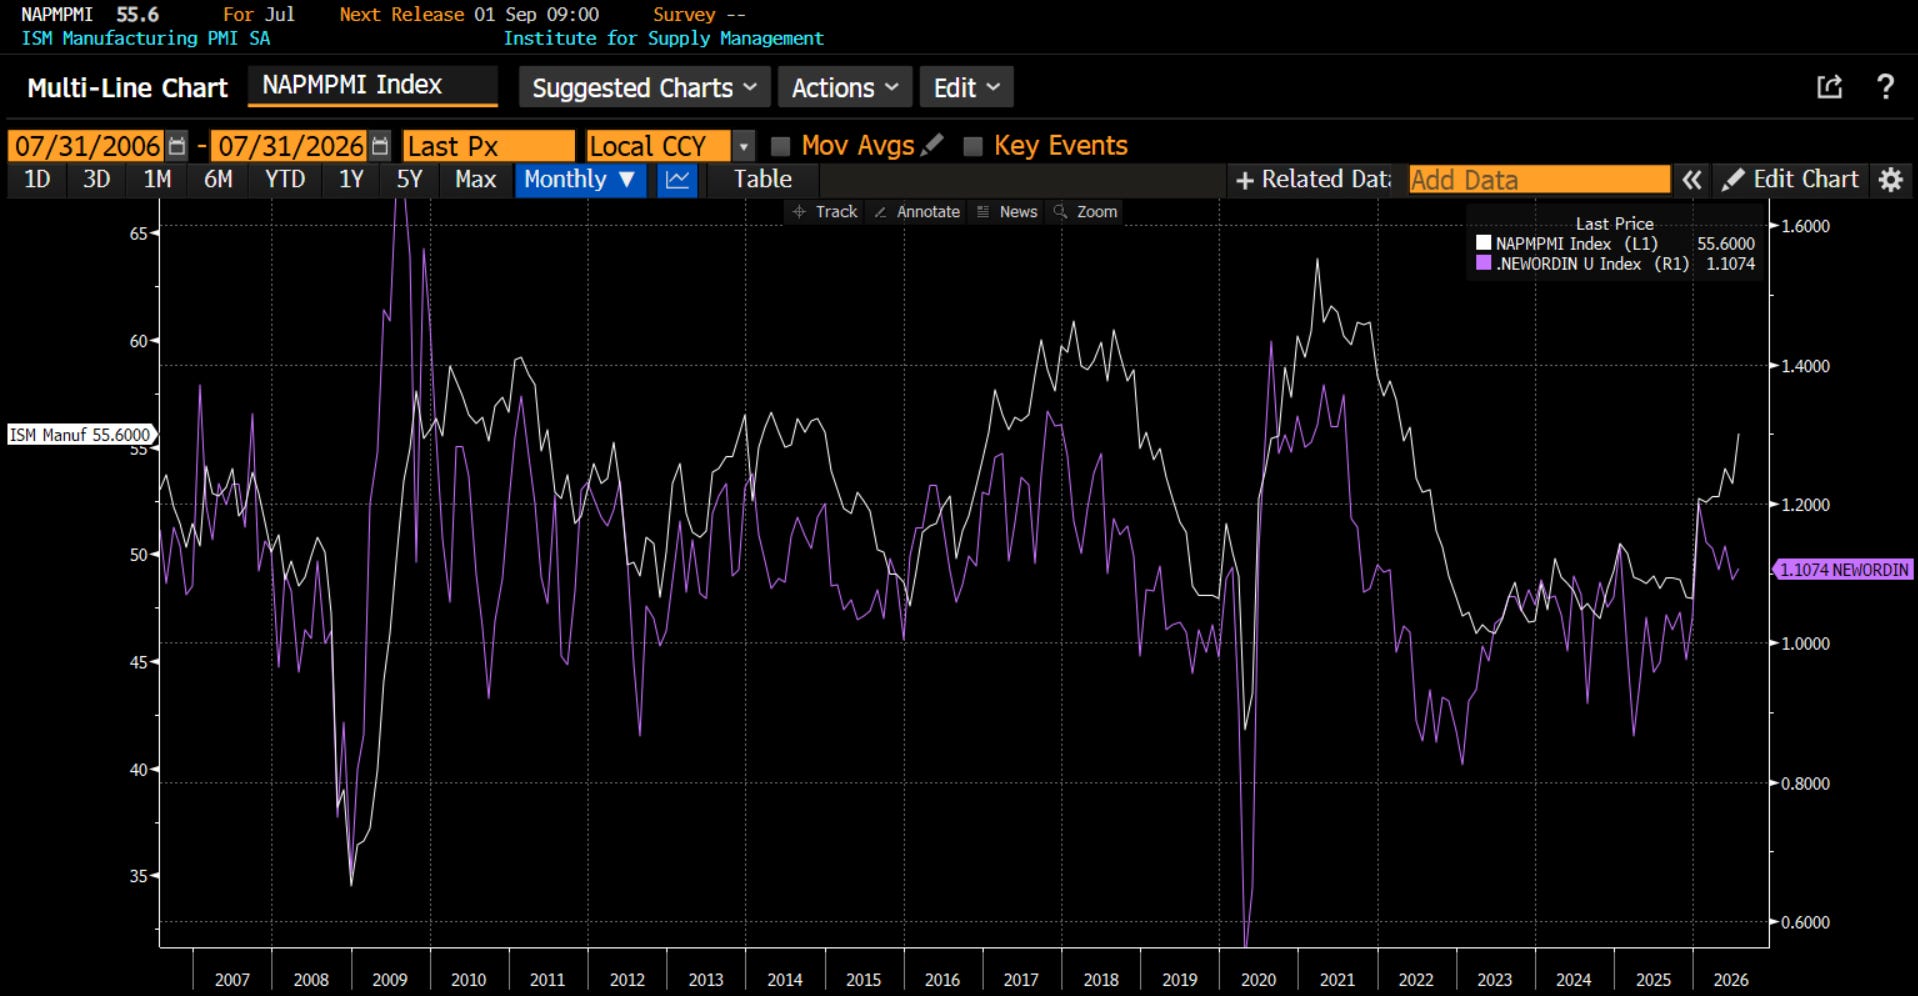
While the ISM is a leading indicator, it is important to try to anticipate its direction when you follow the market. The best anticipatory measure I have found is the ratio of New Orders to Inventories within the data. You can see it in purple here. It is noisy data, but the trend does lead the ISM. Worryingly, the ratio had been falling, calling into question the sustainability of the ISM level. This month it ticked up slightly. It is still worth watching this going forward because it is still suggesting the ISM could cool.
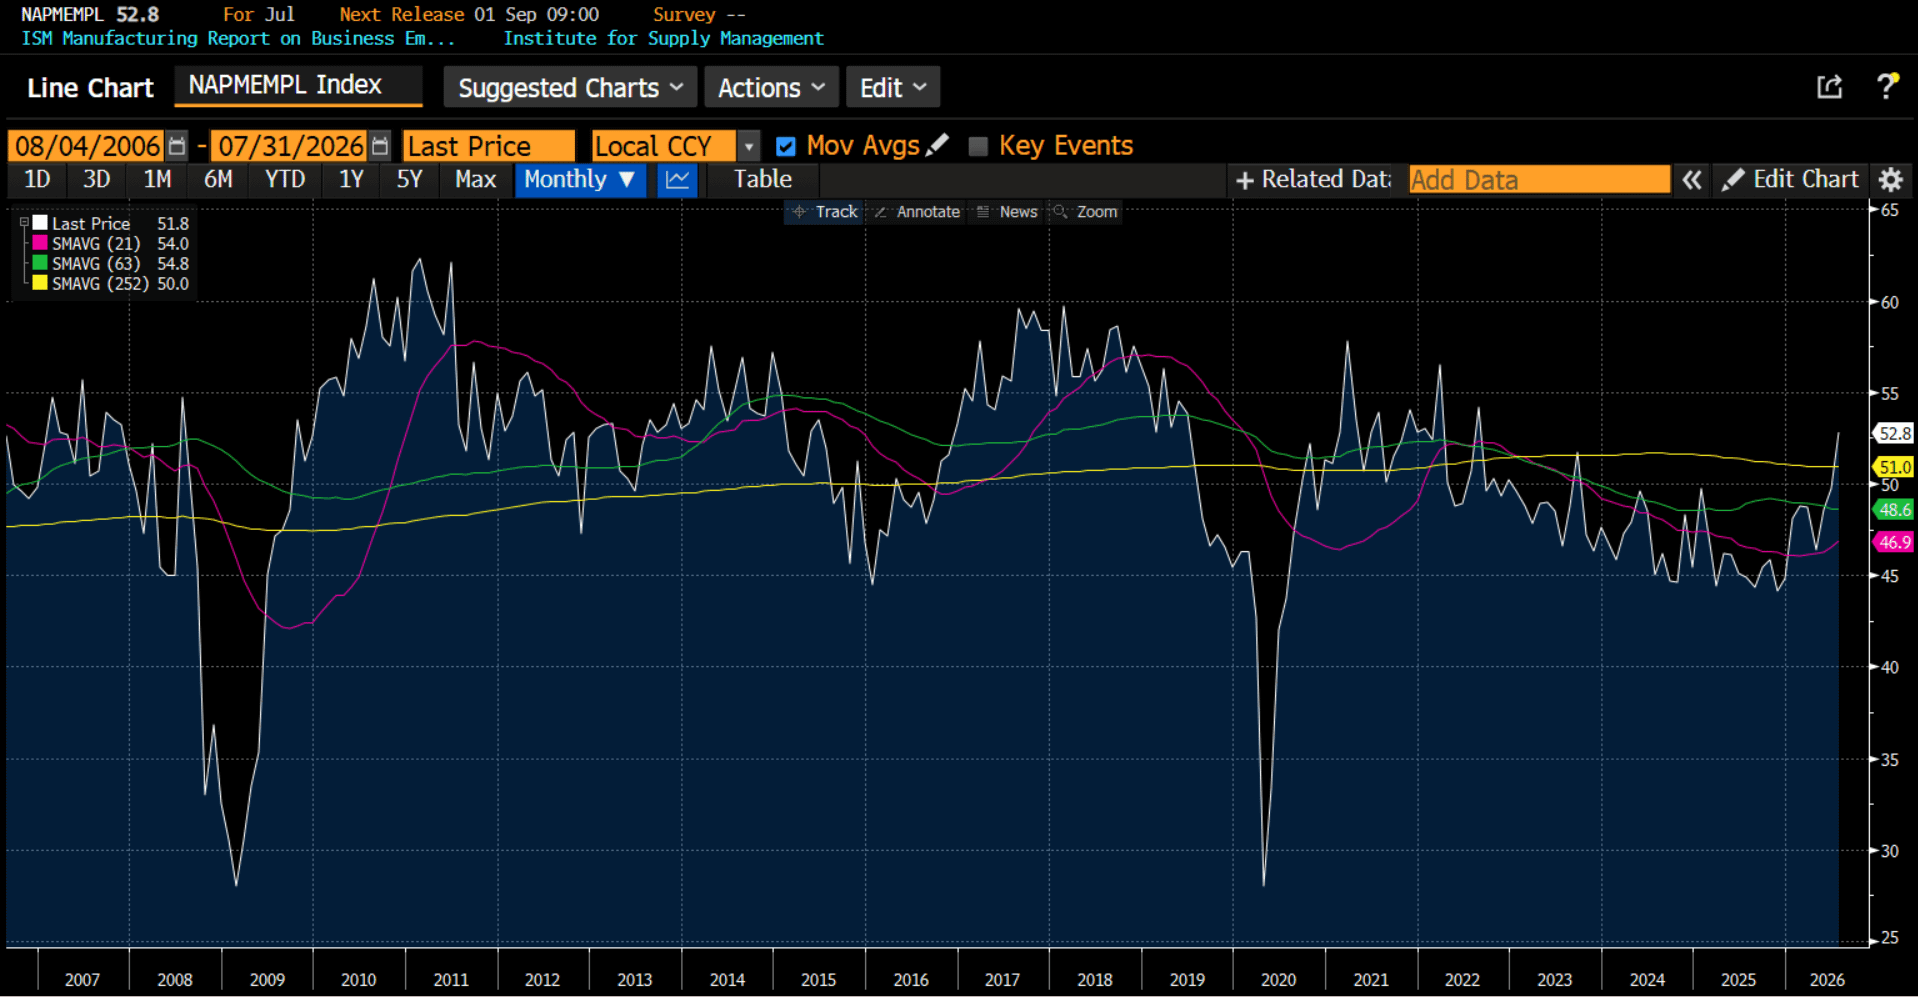
Maybe what gives me some hope that the ISM won’t cool are the companies themselves. We all know that employment is a lagging indicator. Companies do not hire until business is good and profits are showing up. The first plan is to have employees work more hours. Only after that is exhausted, and they feel work is sustainable, do they hire. The ISM Employment index ticked higher to the best level since 2022 this month. This tells me that companies think the move higher in the headline is sustainable.
Easy money?
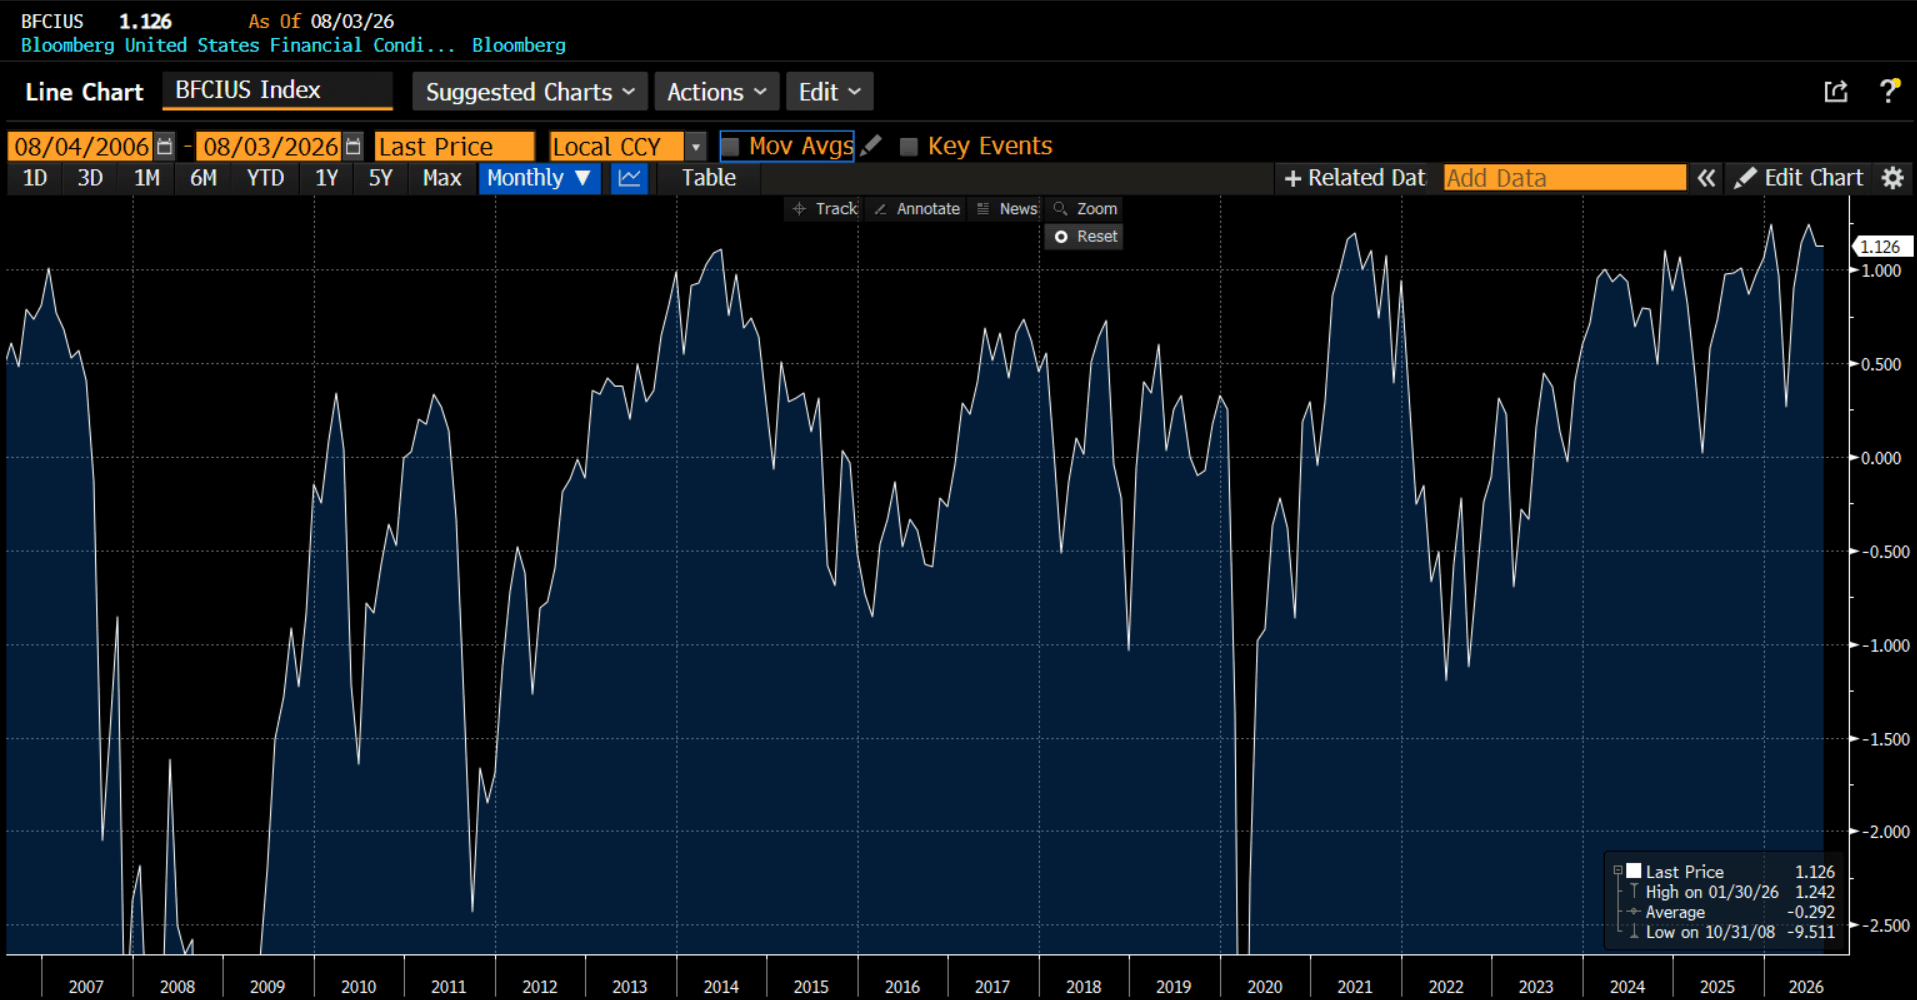
I mentioned it in the LinkedIn above that “perhaps it is the lagged effects of 150 bps of cuts”. There is a LOT to this. In addition to the cost of money coming lower, it is also the availability of money. I will save you the charts, but whether you look at credit spreads that are still near 20-year lows, or the bank senior loan officer surveys which shows the bank loan channel is wide open, money is freely flowing in the economy. The best aggregate measure of this is the financial conditions index. I use the Bloomberg version but there are others. Some will say that financial conditions are getting tighter because they look at the 30-year bond (more on bonds below). In aggregate, financial conditions are telling us that we are at some of the easiest money we have seen for the last 20 years. We should not be surprised the economy is growing.
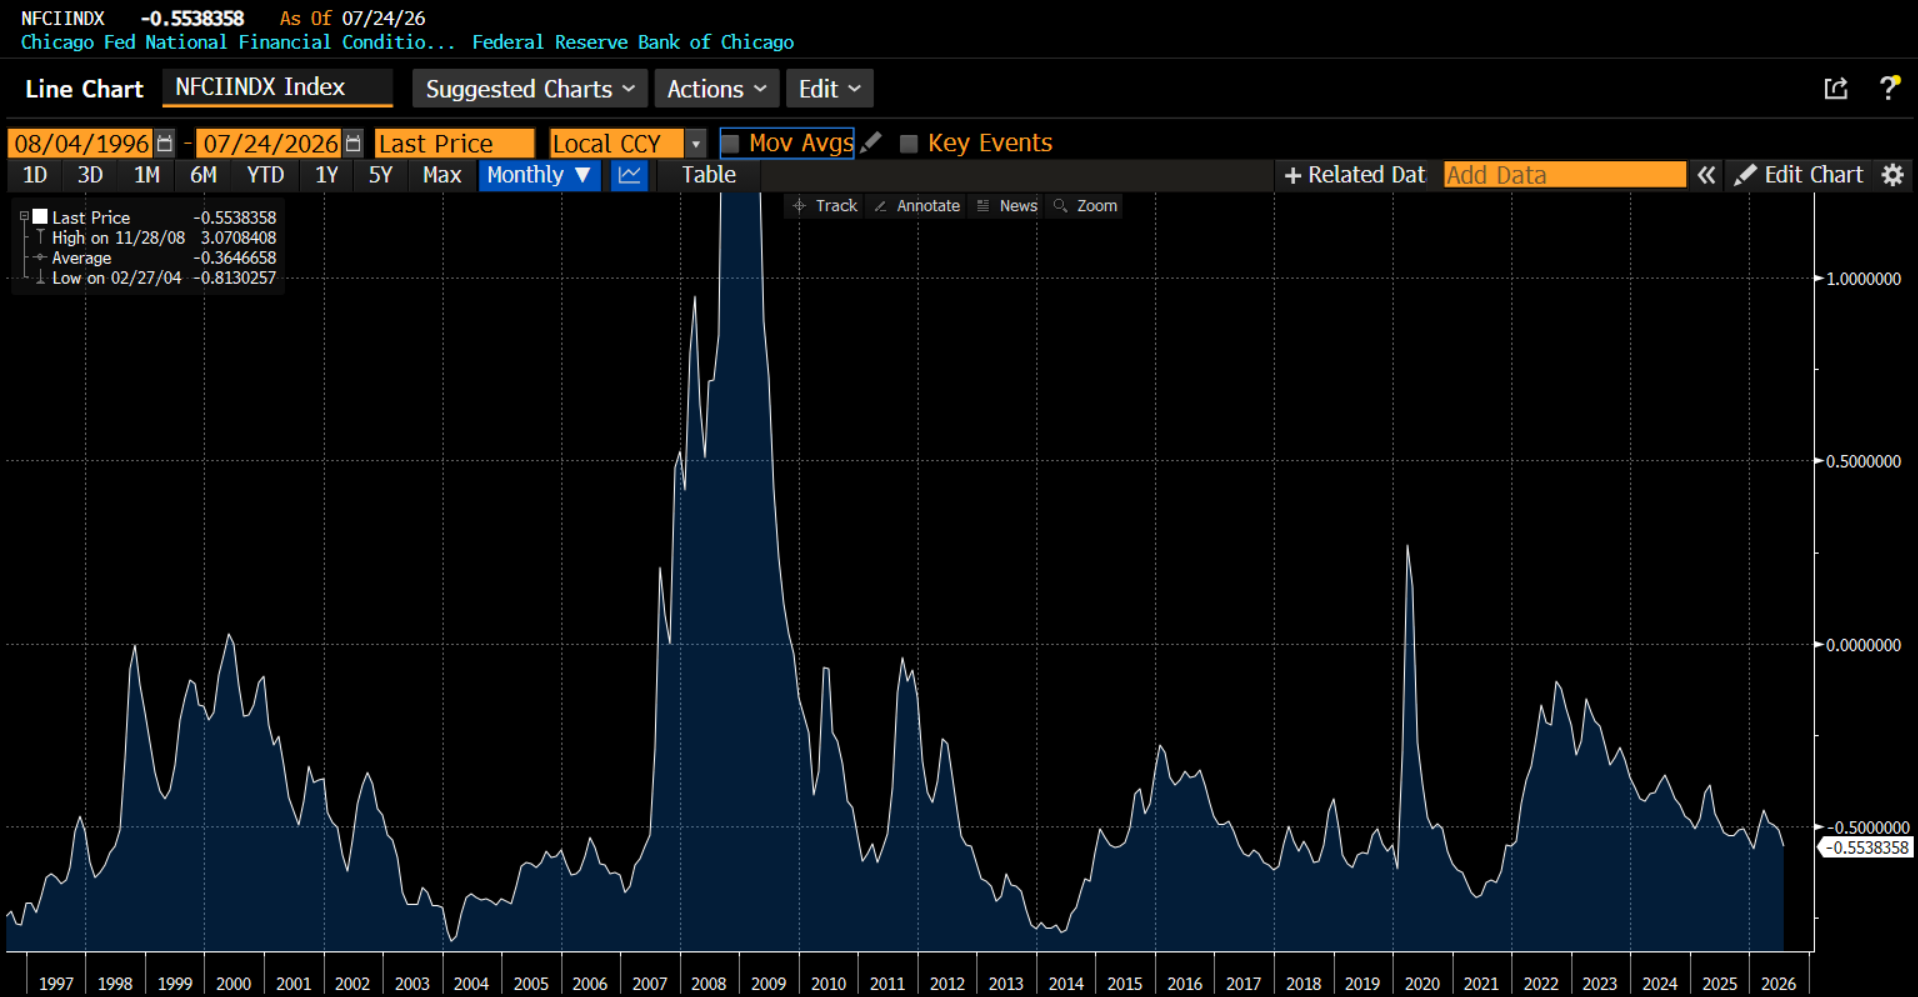
Let’s say you don’t like market measures of financial conditions. The students in my portfolio management class, who are charged with forecasting the economy, have found that one of the best variables to use is the Chicago Fed National Financial Conditions Index. Per the description: “The National Financial Conditions Index is constructed to have an average value of zero and a standard deviation of one over a sample period extending back to 1972. Positive values of the NFCI indicate financial conditions that are tighter than on average, while negative values indicate financial conditions that are looser than on average.” Leaving aside that financial conditions have largely been looser than on average for most of this century, suffice to say we are more than 0.5 standard deviations loose. That is, it is all clear for take-off in the economy.
What about the bond market?
Some will point to the bond market and suggest that the bond vigilantes are sending a strong message to the Fed and the Administration that current policies are not working.
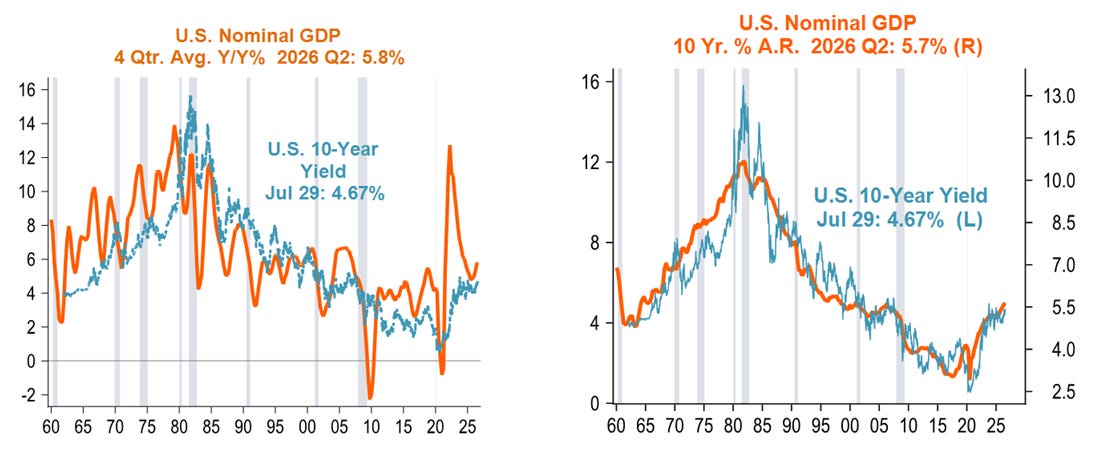
That is one interpretation. Another interpretation is that bond yields and nominal GDP are inextricably linked. Nominal GDP captures both real activity as well as inflation. Both of these drives the bond market. Yes, the bond market worries the most about inflation as this is the risk to bond holders. However, yields will also reflect economic activity. This is why the bond yields in Japan are lower than the US despite arguably higher credit risk. This is why bond yields in China are the lowest in the world, because the economy there is struggling mightily. It is not a function of credit risk; it is a function of nominal economic activity.
This chart comes from one of the top economists on Wall Street, Nancy Lazar of PiperSandler. She shows how nominal GDP and bond yields are tied closely together. The chart on the left shows the 4-quarter average of GDP which is a bit noisier. The chart on the right smooths this out on an annual rate of change. You can see that even when looking at the US alone, higher levels of economic activity are correlated with higher yields and vice versa.
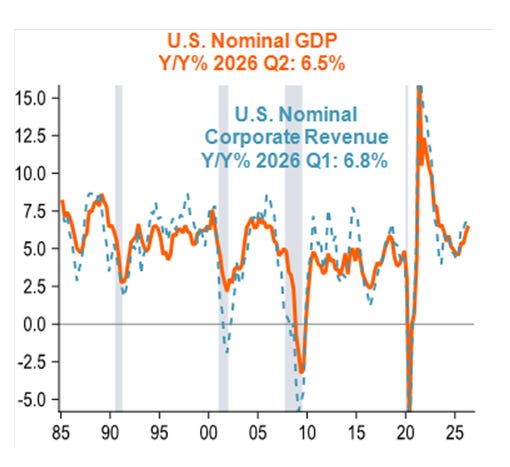
Nancy goes on to show how this level of economic activity is also correlated with corporate revenues, which are also nominal. In fact, this is an even tighter fit than the graphs above. Higher level of economic activity means higher revenues and higher bond yields. Does that mean there are no risks that the FOMC loses control of inflation? Not at all. However, the core trends, the fundamentals, are quite clear.
Earnings
A better economy means higher earnings. This should be intuitive. How good have earnings been? I wrote about that on LinkedIn:
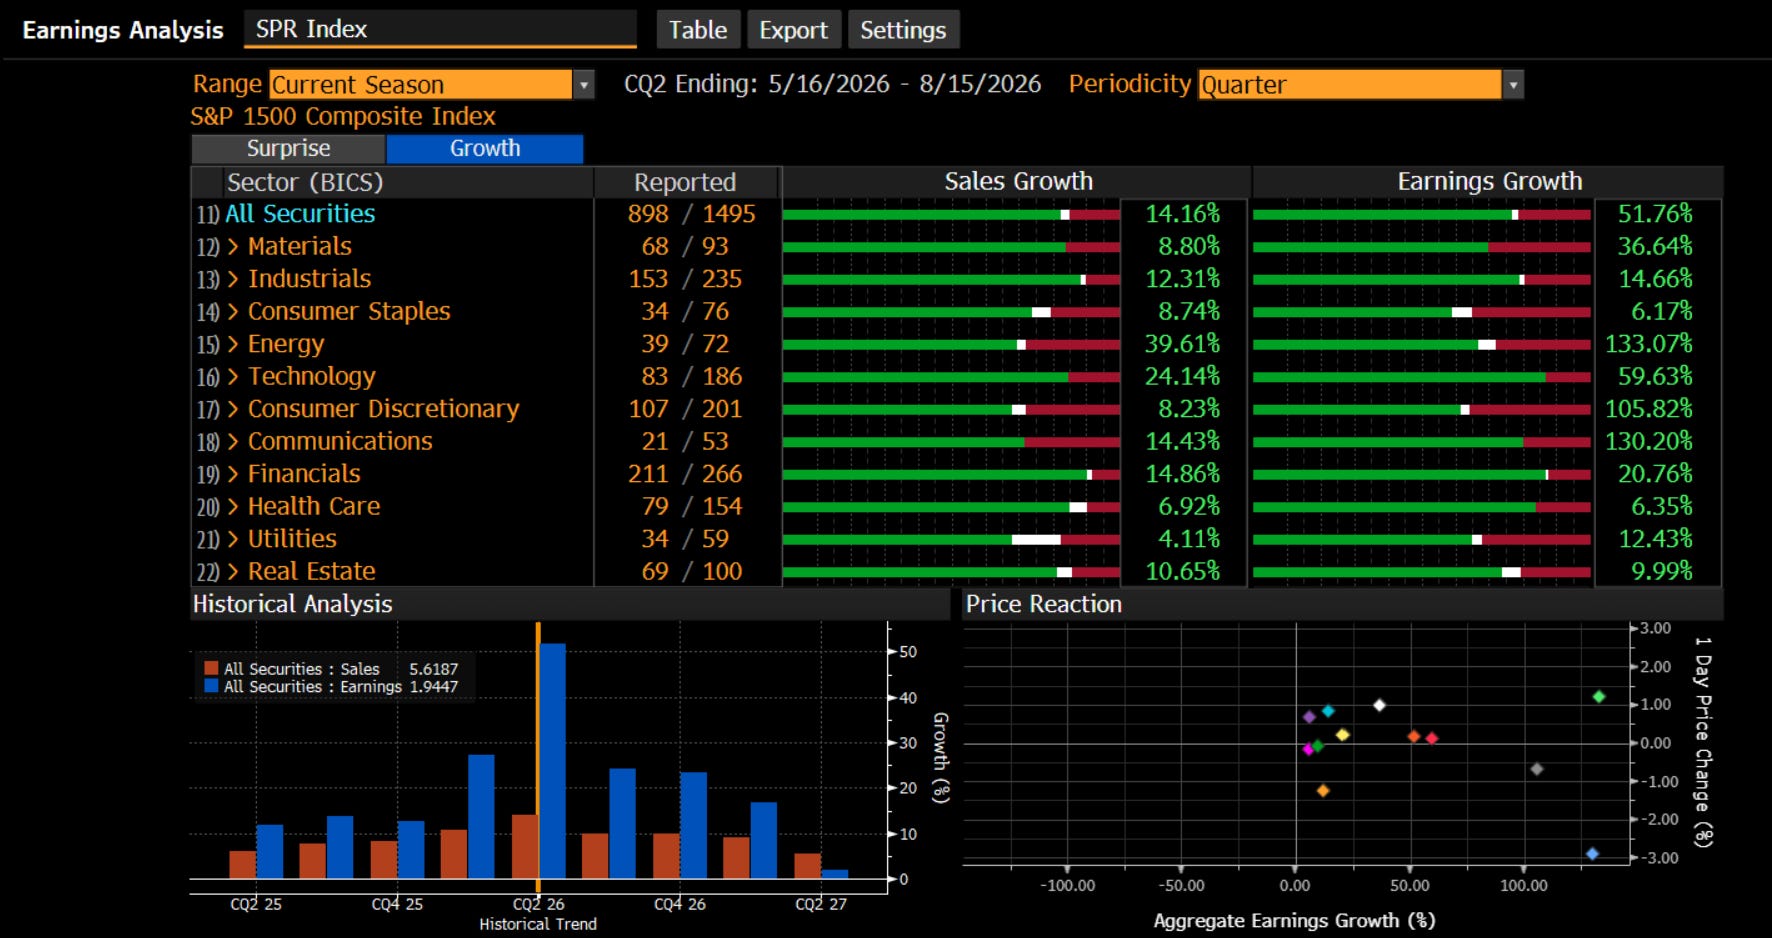
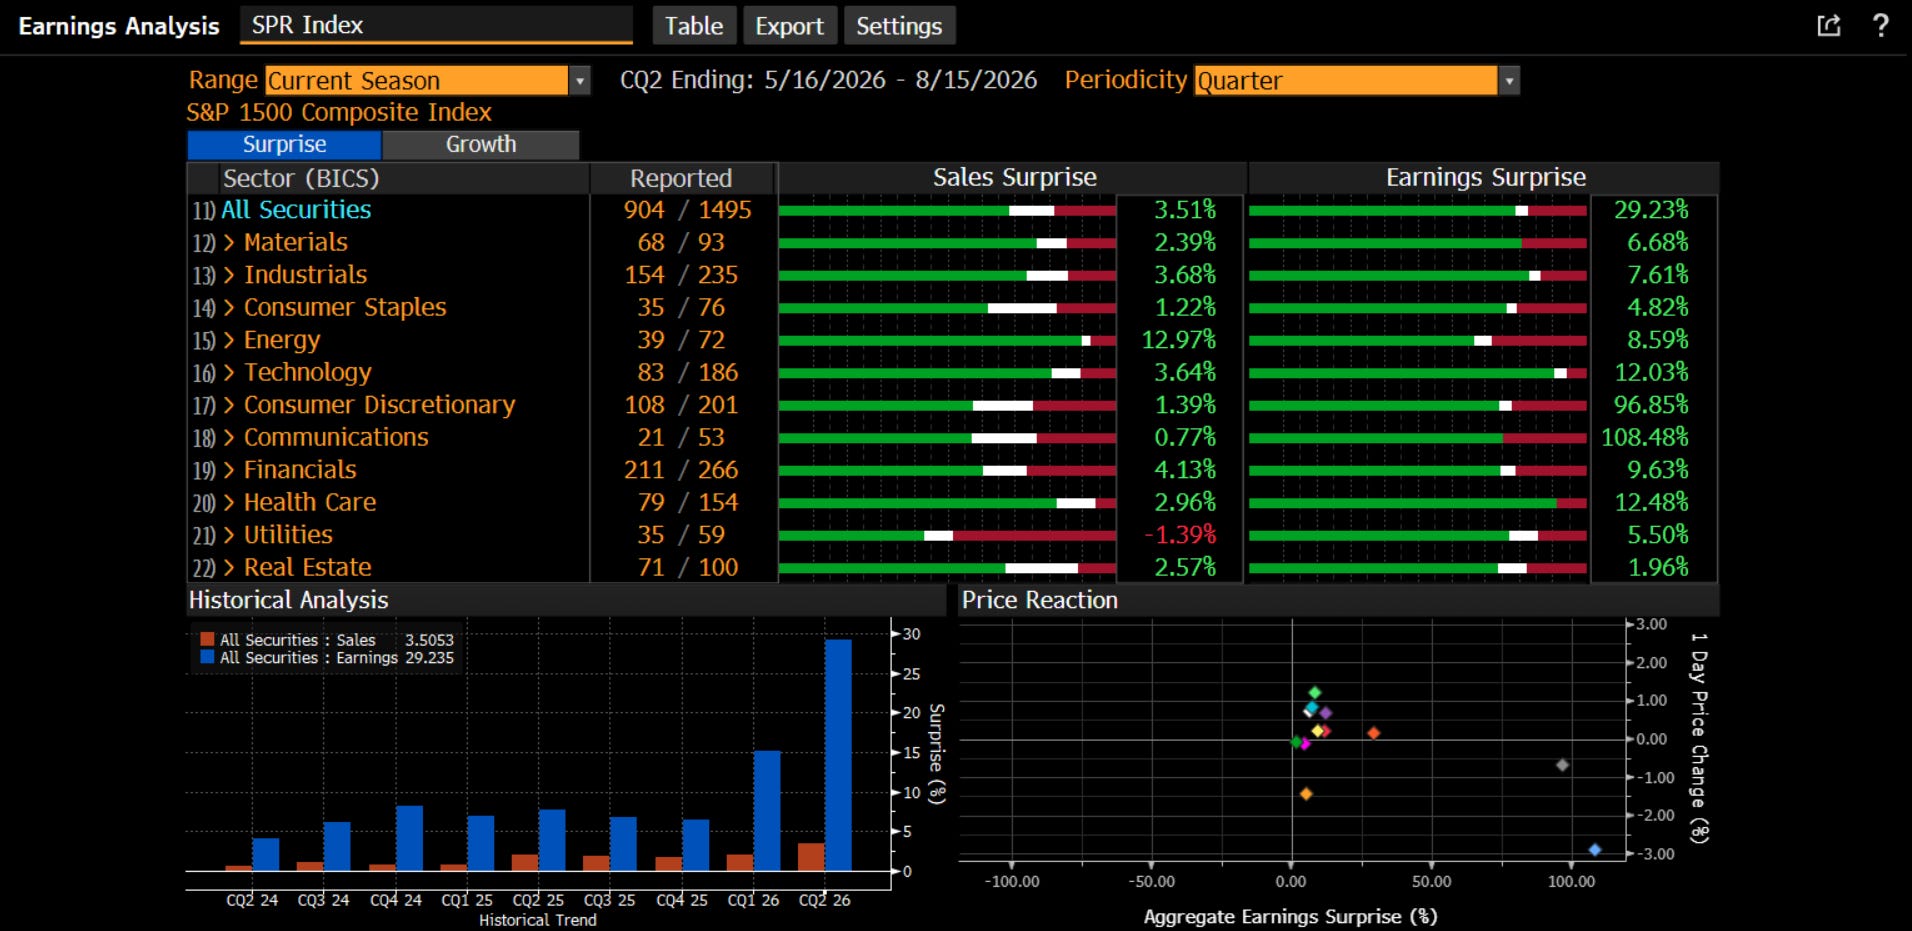
The chart below is the earnings analysis of the S&P 1500 which includes large, mid and small names As you can see, the sales and earnings growth this quarter, with 60% of names reporting, has been nothing short of spectacular Last quarter, sales grew at 10% and earnings at 27% and we thought that was unsustainable. This quarter, companies said, 'Hold my beer' and grew sales by 14% and earnings by almost 52% It is absolutely across the board too as every single sector is putting up big numbers If you look in the lower right, you can see stock reaction to the news. For the most part it has been 'meh' You can argue, the positioning was such that much was expected. If I showed you the "Surprise" tab of this analysis, you would know it wasn't. However, there were fund blow-ups and deleveraging going on in July. So it was not clean Over time, earnings drive stocks. Earnings right now are amazing We can see in the lower left this level of performance is not expected to continue apace (we said that last quarter). However, the level itself is enough to have boosted 2026 year-end earnings. There are good opportunities out there if you do your homework The economy is doing well, and earnings are proving the point. It’s a tough time to want to fade the market even with some geopolitical noise out there
Here is the same chart relative to expectations i.e. the “surprises”. It doesn’t get much better than this:
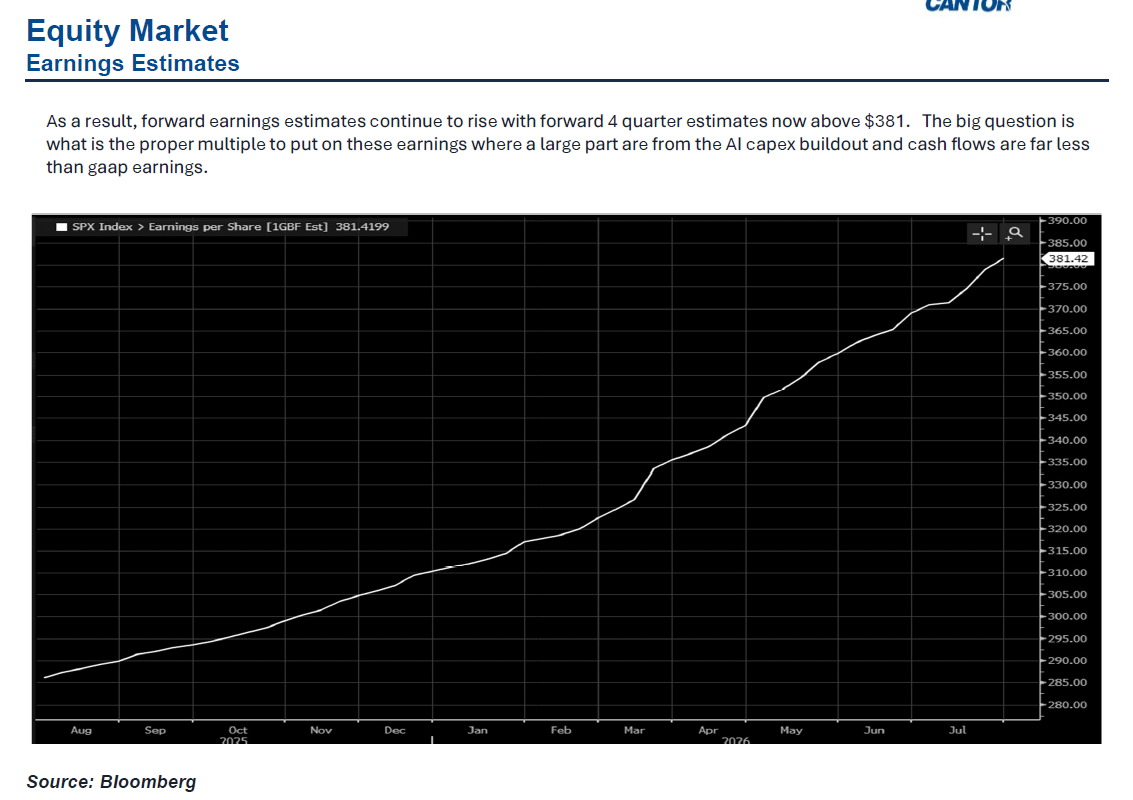
In his bi-weekly note this week, Eric Johnston of Cantor wrote about the impact this quarter’s earnings are having on the forward 4-quarter estimates. This number is now up to $381. It is still rising. That level of earnings supports the current equity market.
Multiples
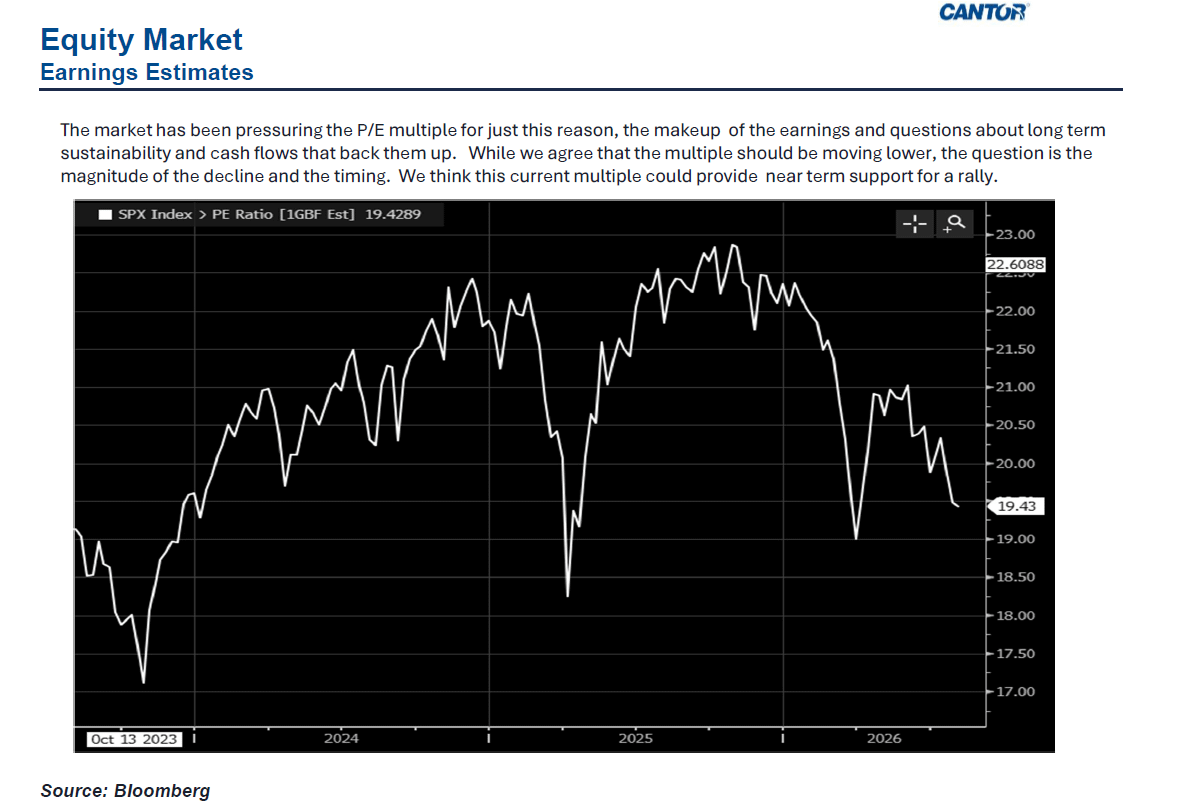
The pushback would be that the market is discounting this. For one, the surprises suggest the opposite. However, that is too glib. The market did anticipate this through the multiple it has been willing to pay for earnings. As earnings are growing rapidly, the multiple is coming lower. This is the market’s way of saying, “we aren’t going to grow this fast forever.” EJ talked about this in his note as well. The multiple is moving lower as investors say, “this is great, but it can’t last so I am going to pay a lower multiple for the same earnings.” This is how markets work.
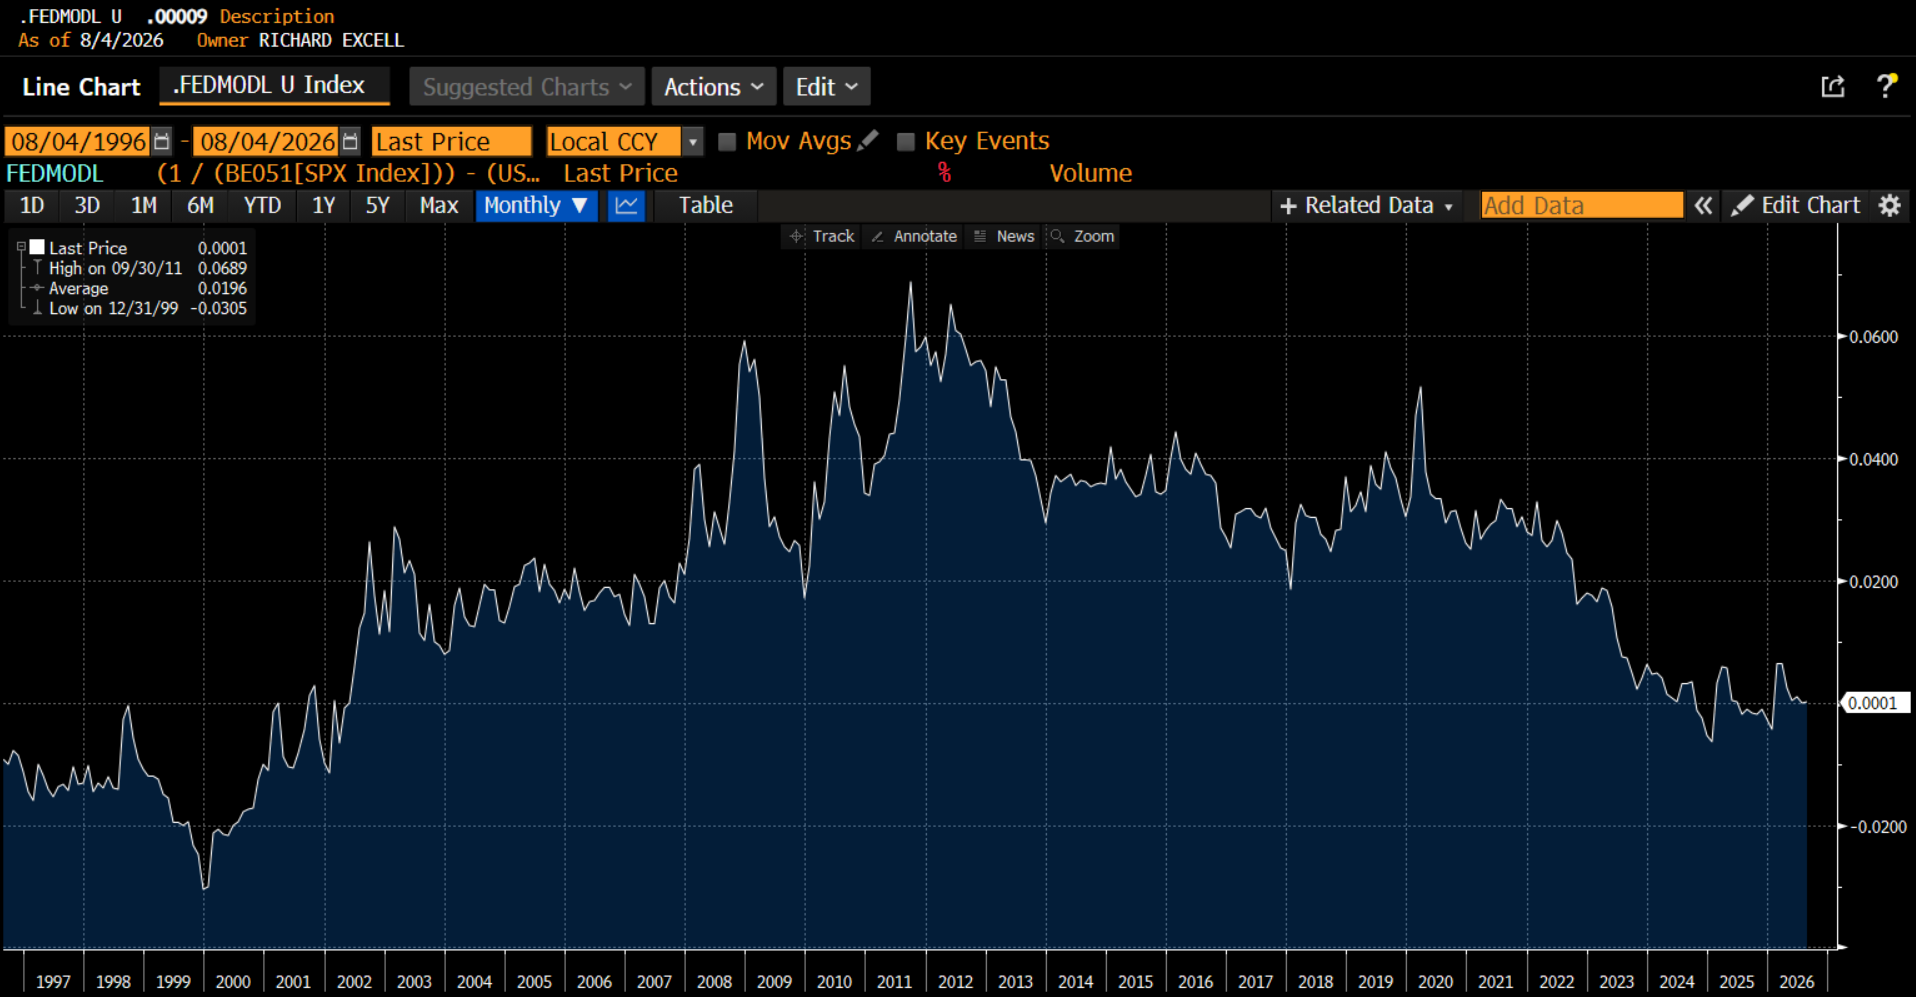
It isn’t just investors discounting future earnings growth, it is also the bond market putting some breaks on this. The inverse of P/E is the earnings yield, and this yield is tied to the 10-year Treasury yield. As bond yields have moved higher, the earnings yield has moved higher, which means the P/E has moved lower.
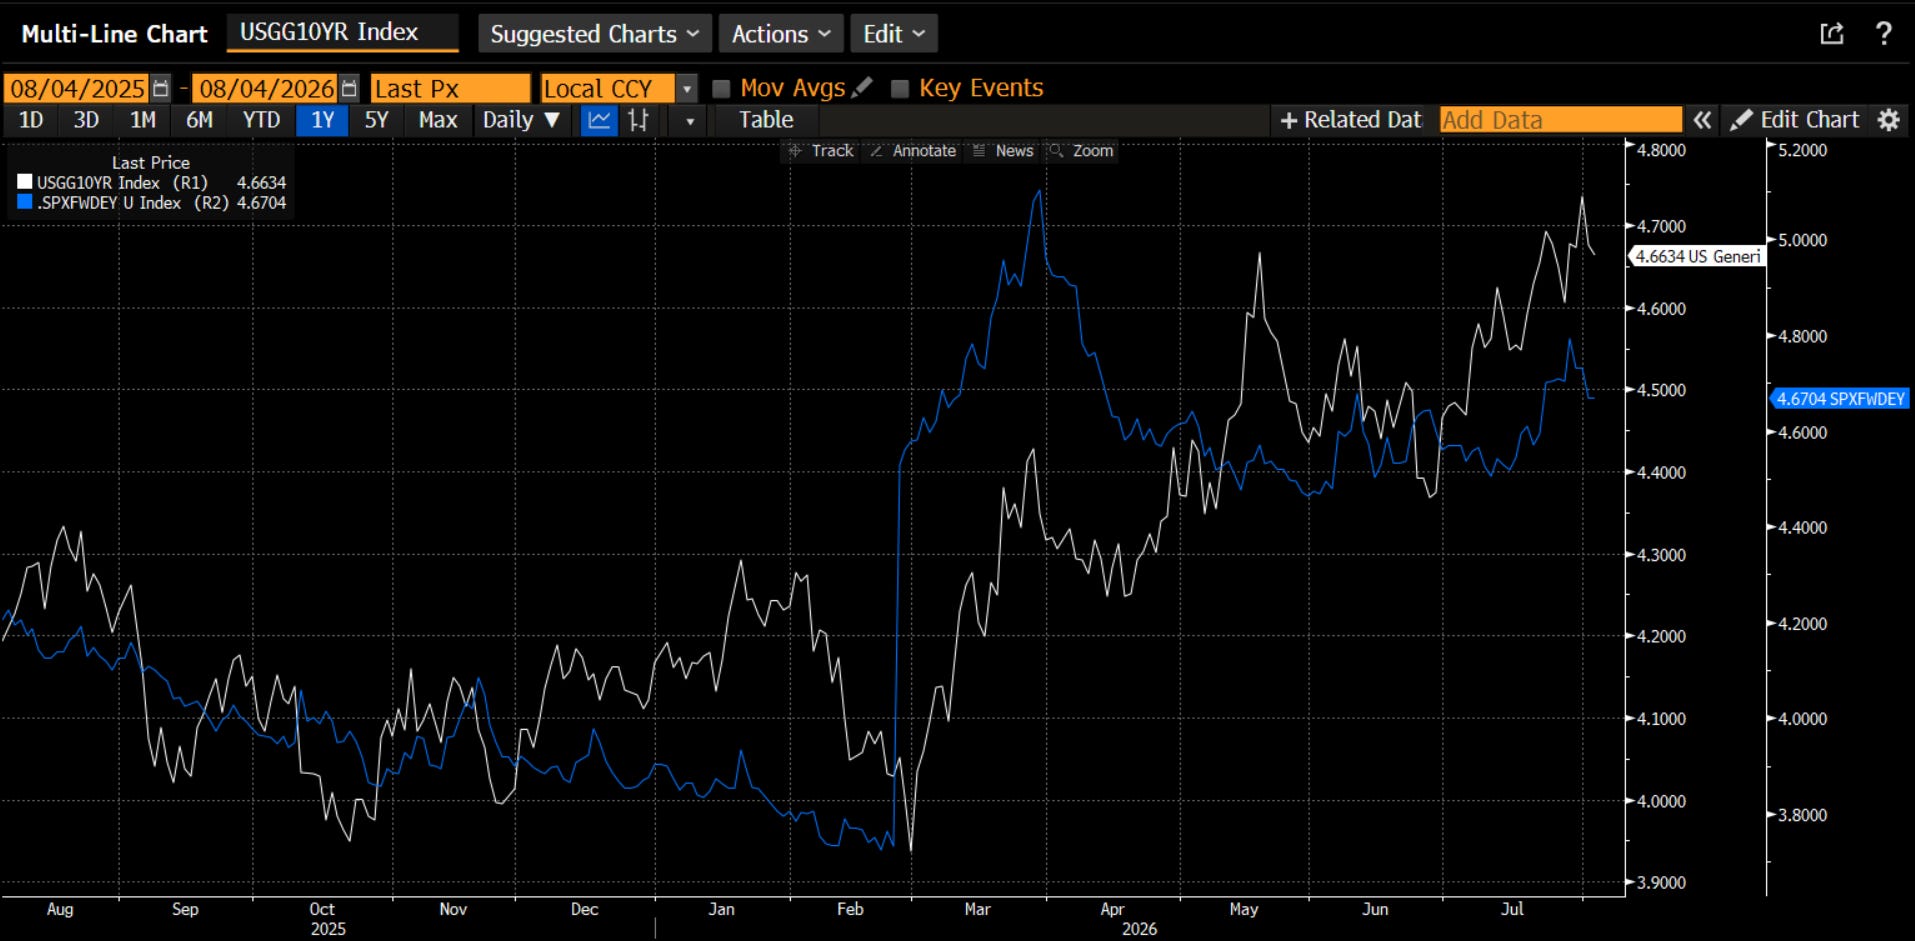
The Fed Model popularized by the late Alan Greenspan talked about the asset allocation between stocks and bonds and why bond yields and earnings yields are correlated. However, we can and do go through long stretches where one asset class is in favor and the other out of favor. We see that in the spread between the two yields. In the late 90s, investors saw huge growth and favored stocks (earnings yield discount). Around the Financial Crisis, stocks were risky and out of favor and the premium to the earnings yield hit 6% (on average around 2%). Currently, they trade at the same yield. This suggests a lot of growth priced in for sure. However, as we saw in the 90s, this can last for a long time.
Summary
A quick summary:
1. The economy is hitting on all cylinders right now.
2. A stronger economy means stronger earnings, and we are seeing incredibly strong earnings.
3. Higher bond yields may be the market telling us that it is about higher economic activity and not the risk that many interpret.
4. Investors know this growth can’t last forever and are lowering the multiple. In addition, higher bond yields mean a lower multiple.
5. Over time, you are rewarded to be invested in the stock market when the economy and earnings are growing, though this does not mean that aren’t risks out there.
The Fundamental vertical of my process is giving a green light. Next week I will look at the Behavioral section, to see what it is saying.
Trade Idea
You may be more worried about the risks in the market. After all, we see a war raging in Russia/Ukraine and in Iran/Middle East. We fear supply chain disruptions. We know about exogenous commodity shocks. So, despite the strong earnings and economy, you want to sit in cash. That is fine. However, there could be another way.
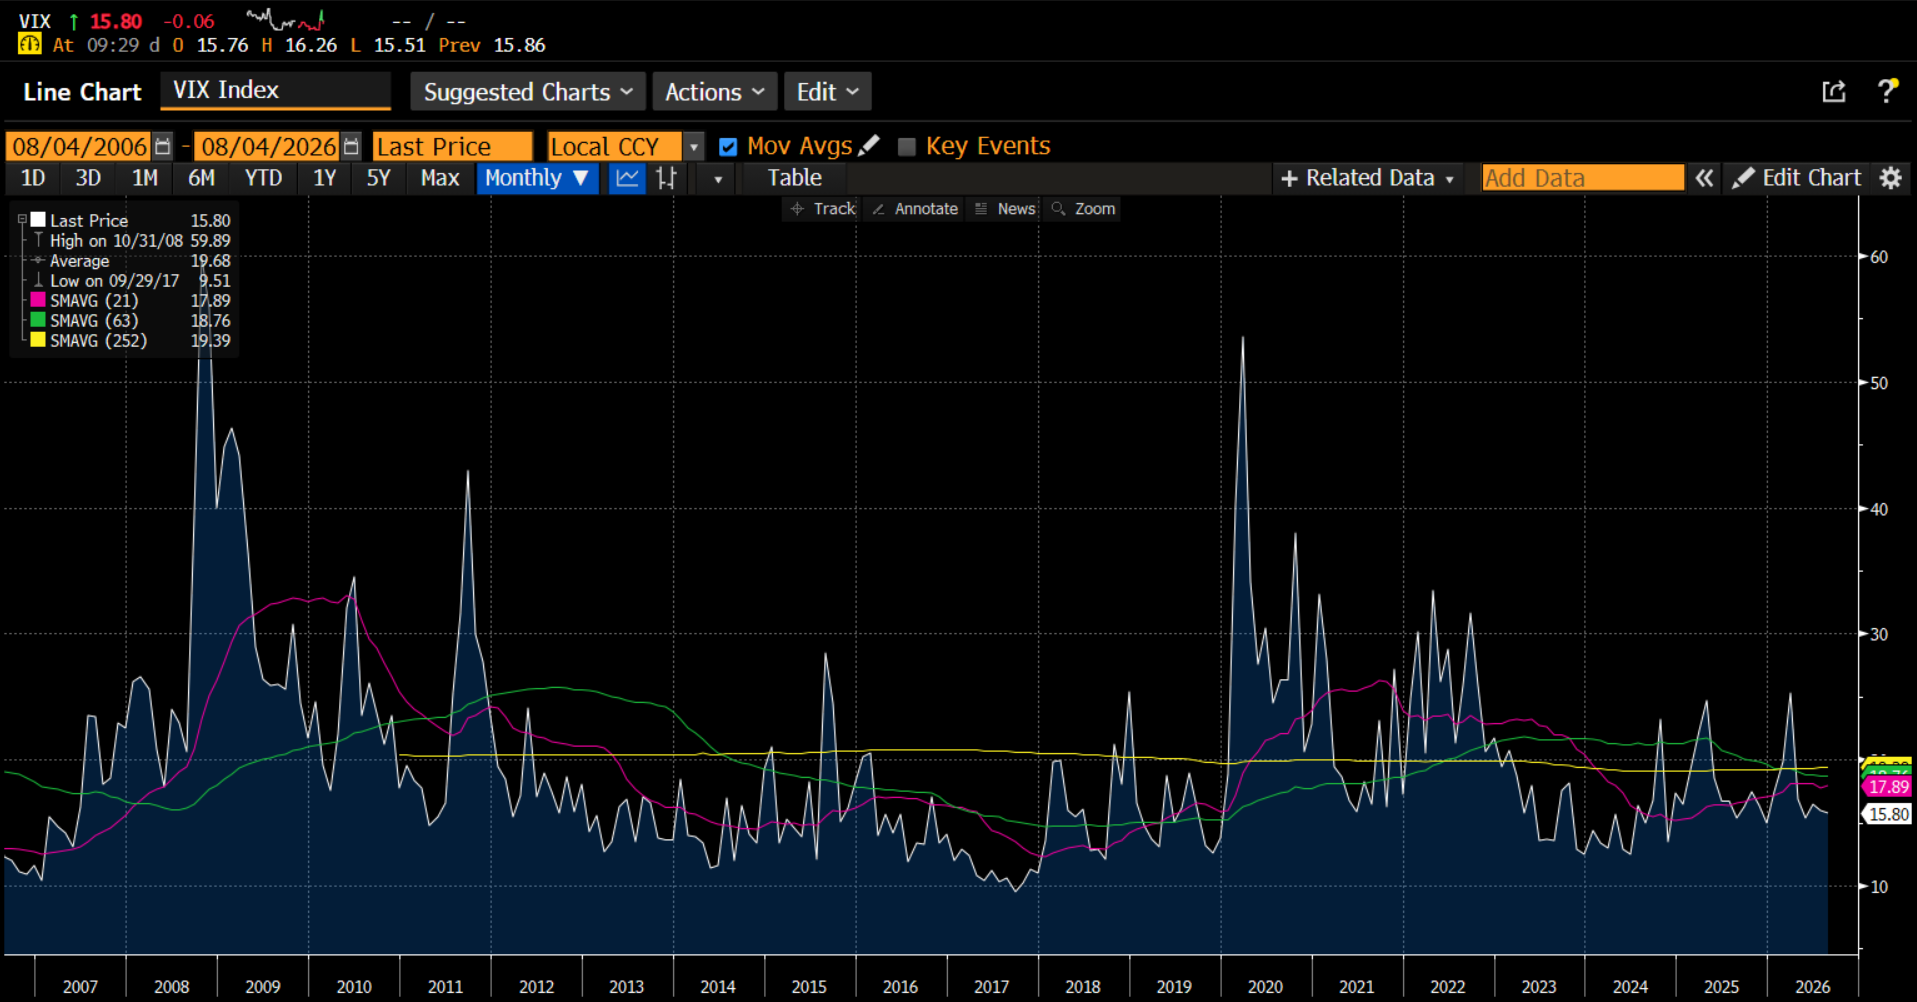
The VIX Index, the market’s fear gauge, is well below average. If you are worried about volatility in the market, the options market is giving you a chance to hedge with index volatility. Staying invested but expressing your view via options or by buying index protection may be your best bet.
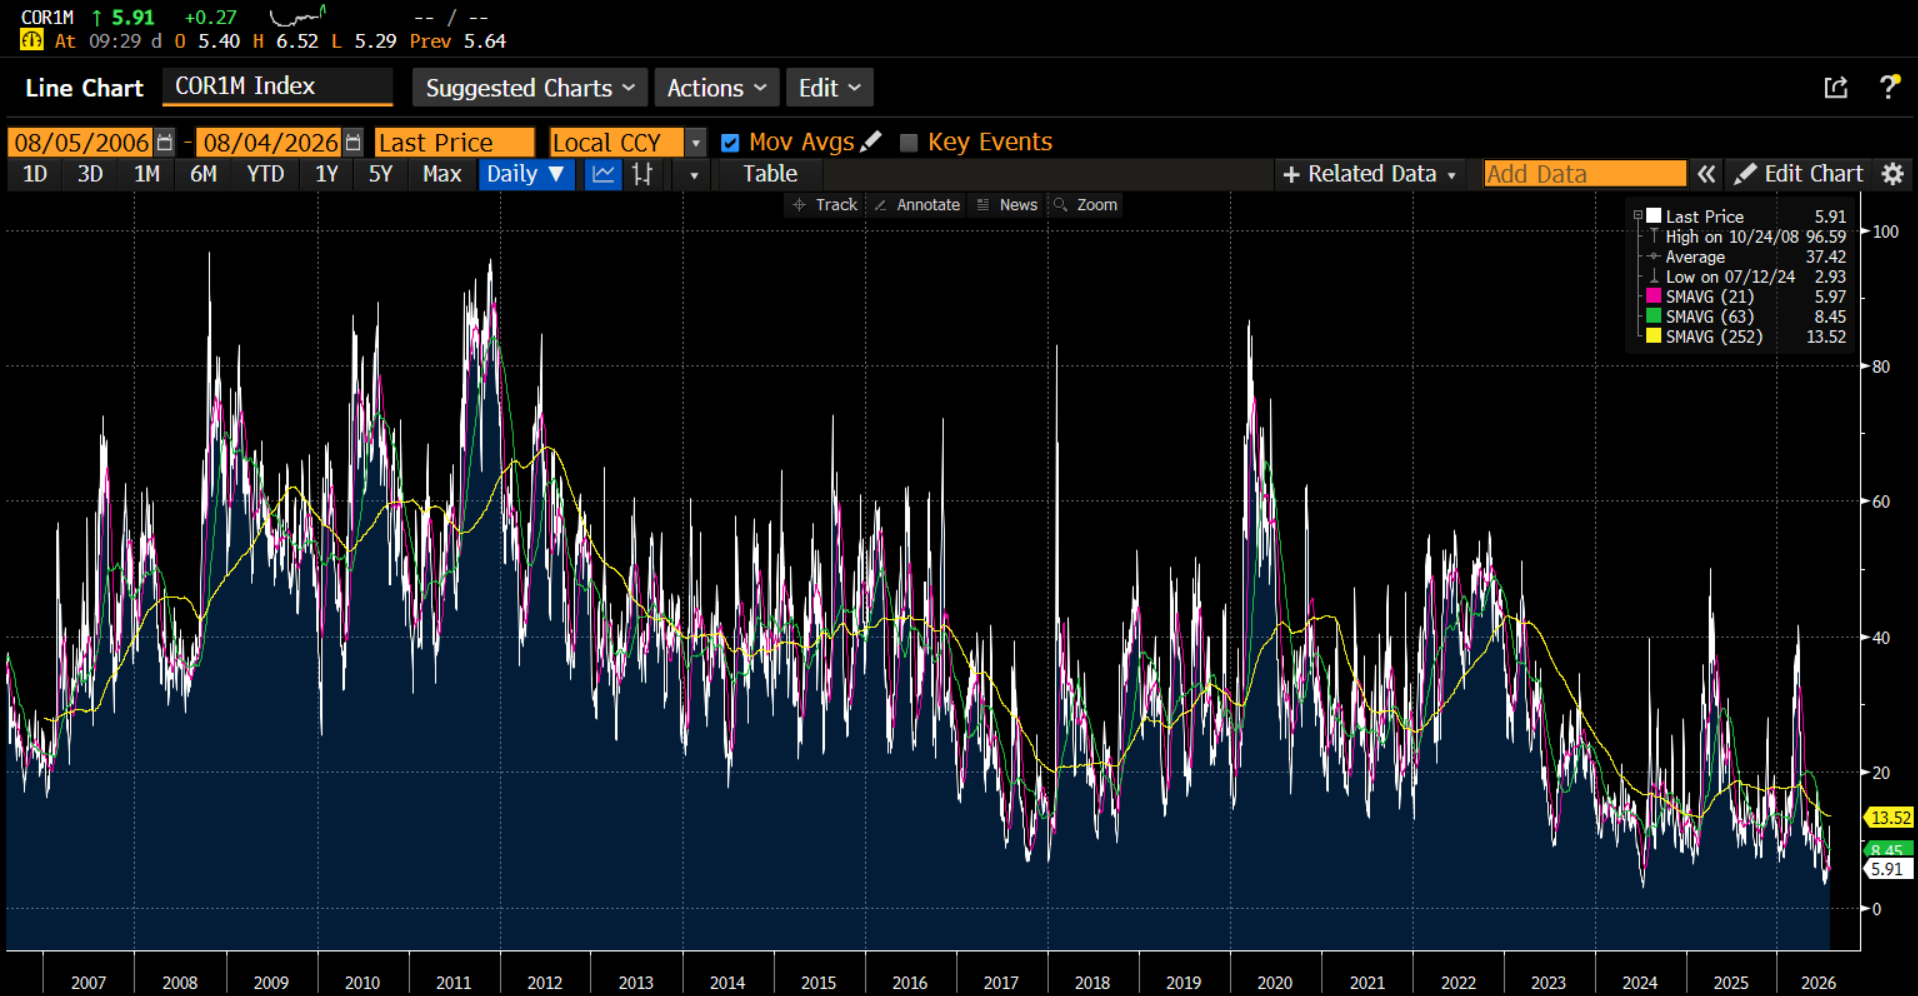
You might say, “but I am worried about the AI theme blowing up so I want to hedge my stocks individually.” Fair point. I would answer, “everyone is already doing that.” The implied correlation measures what the market thinks about the co-movement of stocks and the market. It is at all-time lows. Said another way, the average level of single stock volatility relative to index volatility has never been higher. If you are buying single stock insurance, you are buying hurricane insurance at the highest price it has been. And the hurricane may already have hit if we look at the Situational Awareness fund collapse (as an aside, the up 80% is somewhat b.s. That includes the illiquid Anthropic stake. The public portfolio was under-siege and underwater. Ken Griffin bought at a big discount.)
I can fully see your point about having some hedge. I see the risks in the market and in the geopolitical economy. The best and cheapest insurance is index level insurance. If this insurance does not pay out, that is a good thing. Much like home or auto insurance, you really don’t want it to payout. You have it so you feel more comfortable to own the asset. Thus, owning index hedges as a way to keep you fully invested in a market that has the economy and earnings at its back is a small price to pay. The net return is quite likely better than sitting in cash and not being invested.
As always …

Thanks for reading Stay Vigilant! This post is public so feel free to share it.
No posts
Comments
Nothing yet. Say the first thing.
Sign in to join the conversation.