
My previous post compared MLB draft position with subsequent performance. Maybe signing bonuses are misaligned because it is hard to predict how high school and college players will perform in the major leagues several years after they are drafted. Maybe actual performance in the major leagues is a more reliable predictor of future performance and MLB salaries are consequently closely related MLB performances? One clue is that, since performances are normally distributed, MLB salaries should be normally distributed, too. Unsurprisingly, this is not the case.
Figure 1 (which I created for a statistics class a decade ago) shows the distribution of Major League Baseball (MLB) batting averages in 2015 for players with at least 502 plate appearances (the minimum required to qualify for season awards). Figure 2 shows an updated graph, using 2025 data and measuring ability by the sabermetrics statistic wins above replacement (WAR).

Figure 1 Major League Batting Averages, 2015
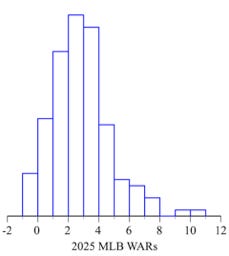
Figure 2 Major League Batting WARs, 2025
As with golf scores, measures of MLB performance are approximately normally distributed. The 2025 WAR data do have two outliers, Aaron Judge with a WAR of 10.1 and Cal Raleigh with a WAR of 9.1 but, nonetheless, 72% of the WARs are within one standard deviation of the mean and 97% are within two standard deviations, compared to the theoretical 68% and 95% values.
MLB salaries, however, are highly skewed.
Comments
Nothing yet. Say the first thing.
Sign in to join the conversation.