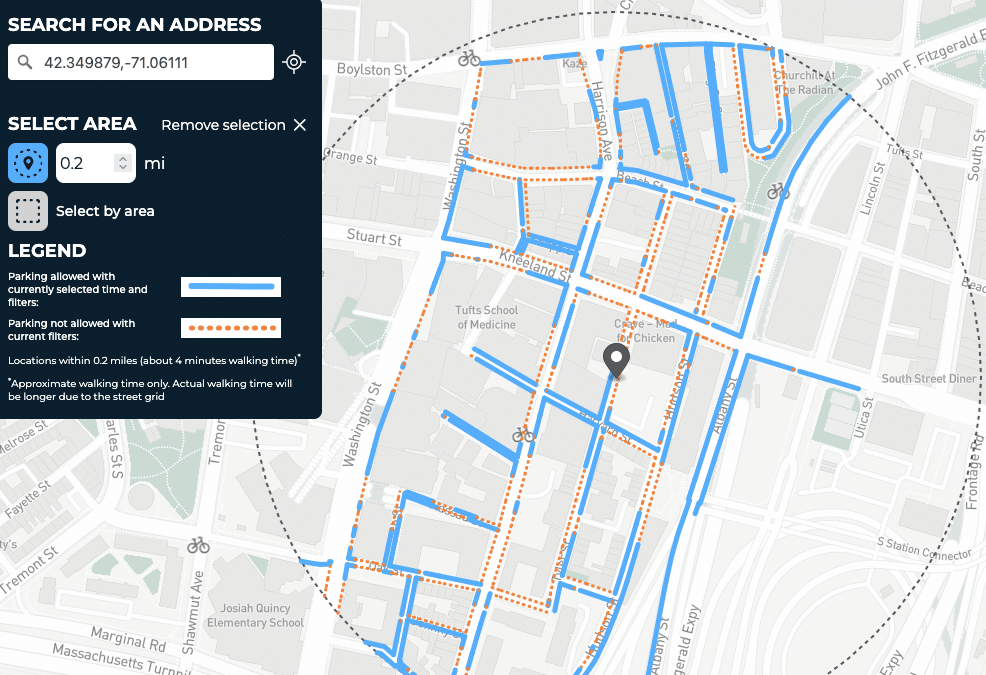
Recently, we worked with the City of Boston’s Office of Emerging Technology to design a prototype curb regulation map, making it easier for Boston residents and visitors to find parking and understand the many overlapping rules and restrictions governing the city’s streets. For most cities, managing curb use is a major challenge that is often... The post Mapping Boston’s Curbs: Designing a Public…
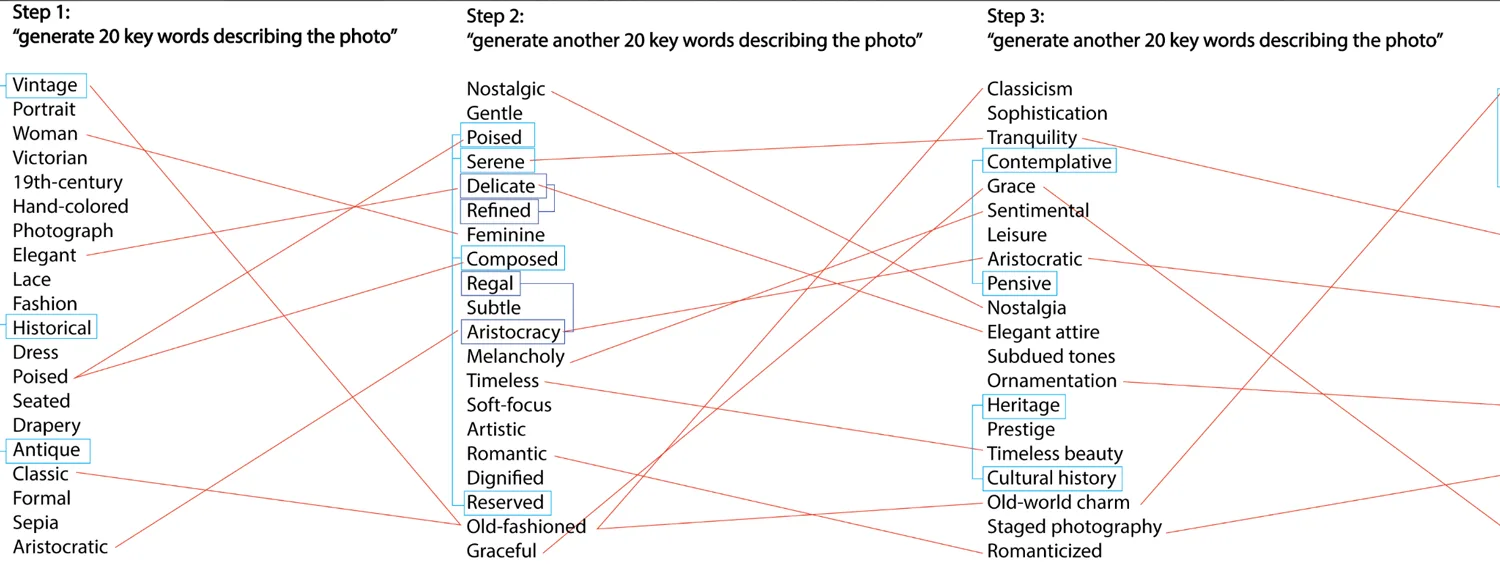
This article first appeared in Harvard Design Magazine on May 4, 2026. While the first article in this series on artificial intelligence (AI) explored how designers may be uniquely positioned to confront the technology’s implications, this second essay examines AI as a design medium—one that can reshape how designers think and produce knowledge. Eric Rodenbeck, a lecturer in... The post AI as a…
Stamen is working on a research project about the existing map design and development tooling landscape in advance of a talk we’re planning for the State of the Map US conference in Madison, WI. We’re interested in hearing from folks across the mapping community about what tools they use, where there are gaps, and how... The post Map makers! Fill out the 2026 Cartographic Design and Development…
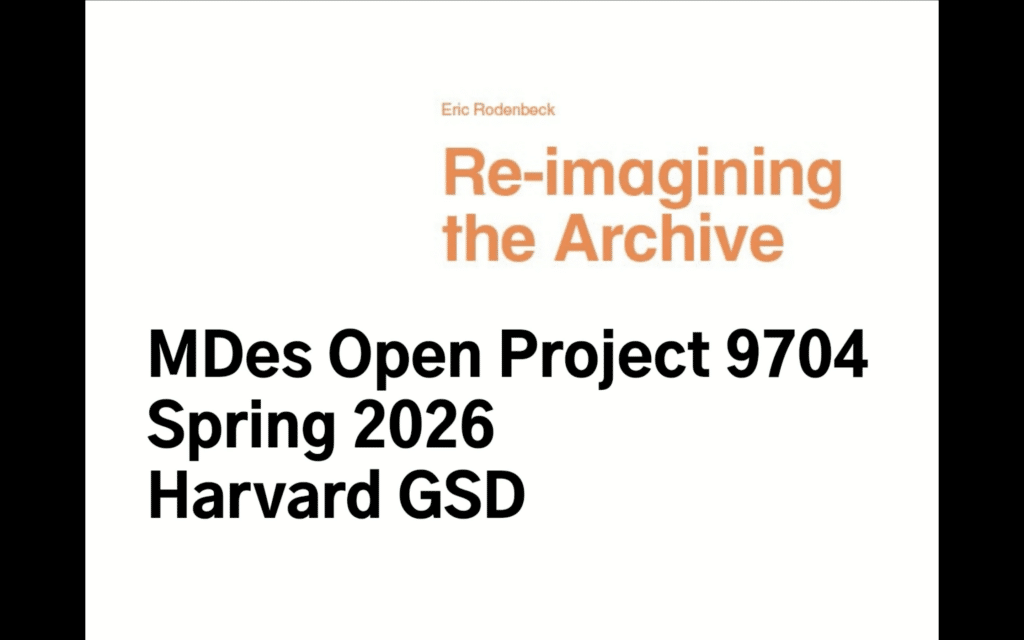
I’m thrilled to announce that Harvard’s Graduate School of Design has invited me to teach a second semester long workshop! It’s called Re-imagining the Archive, and we’ll be engaging with the holdings of prominent institutions like MoMA and Harvard Art Museums to investigate the intersection of culture, technology and society. We recently published a “studio”... The post Two upcoming workshops at…
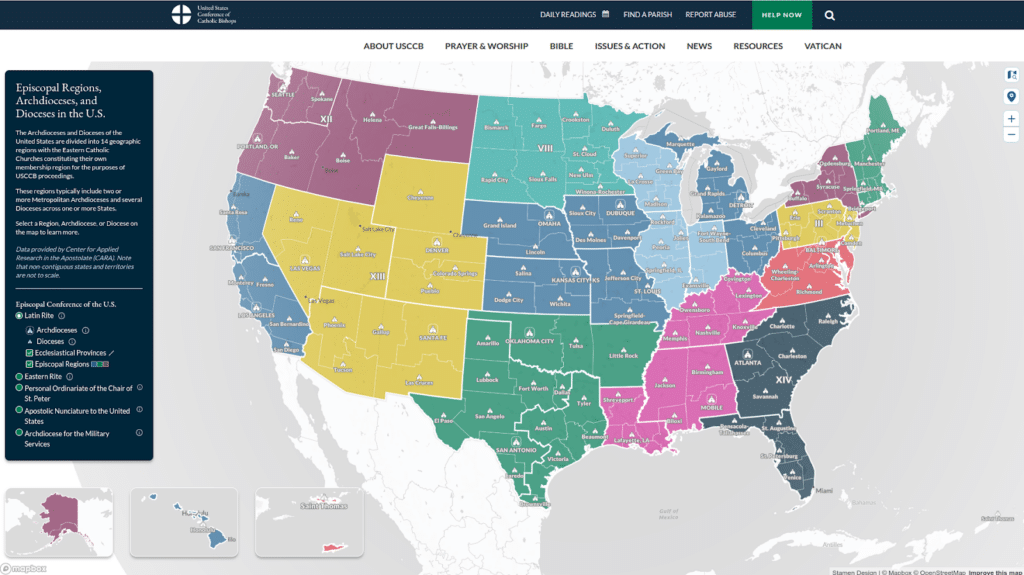
Today we’re excited to announce that Stamen worked with the United States Conference of Catholic Bishops (USCCB) to release a map of dioceses and other administrative regions in the US. The map is the first official and freely accessible interactive map of Catholic dioceses in the US. In the Latin Rite, dioceses are the building... The post Exploring the ecclesiastical map of the Catholic Church…
We’ve made a lot of dark maps over the years at Stamen. We’ll often see dark maps from other designers or commercial providers and think, “why so dark?” We have a philosophy around designing a dark map for a particular client or use case, but we haven’t ever really spelled it out – either internally... The post Stamen’s Dark (Map) Materials appeared first on Stamen .
Dark greetings! We’ve been thinking a lot about dark maps in recent months (as Kelsey presented about recently at NACIS) and the thought occurred to us: how quickly could we make a nice dark mode version of Stamen’s iconic Toner style? As you may recall, a couple years ago we created vectorized versions of our... The post What We Map in the Shadows appeared first on Stamen .
Why use a map? Imagine a map of your hometown. Seeing that a creek runs along main street or that there are connecting side streets running adjacent to that one highway with the notorious stoplight is the kind of spatial information that could meaningfully impact your life. Now imagine a map of a town you’ve... The post Brain Cartography: Mapping a place that everyone knows, but (almost) no one…
This summer I had the honor of speaking at DATA | ART, an event at MIT and sponsored by MetaLab at Harvard and Northeastern University, that gathers practitioners who live in the liminal space between “what is data” and “what becomes art.” The conversation often revolves around the tension between precision and poetry, between representation... The post Reflections from DATA | ART Symposium…
Last month, I led an interactive workshop at The Midwest Climate Adaptation Science Center’s Summer Symposium at the University of Illinois Urbana-Champaign in Urbana, Illinois. MW CASC is a consortium of research-focused academic, Tribal, and non-profit partners working collaboratively with the United States Geological Survey (USGS). The workshop focused on data visualization and mapping for...…