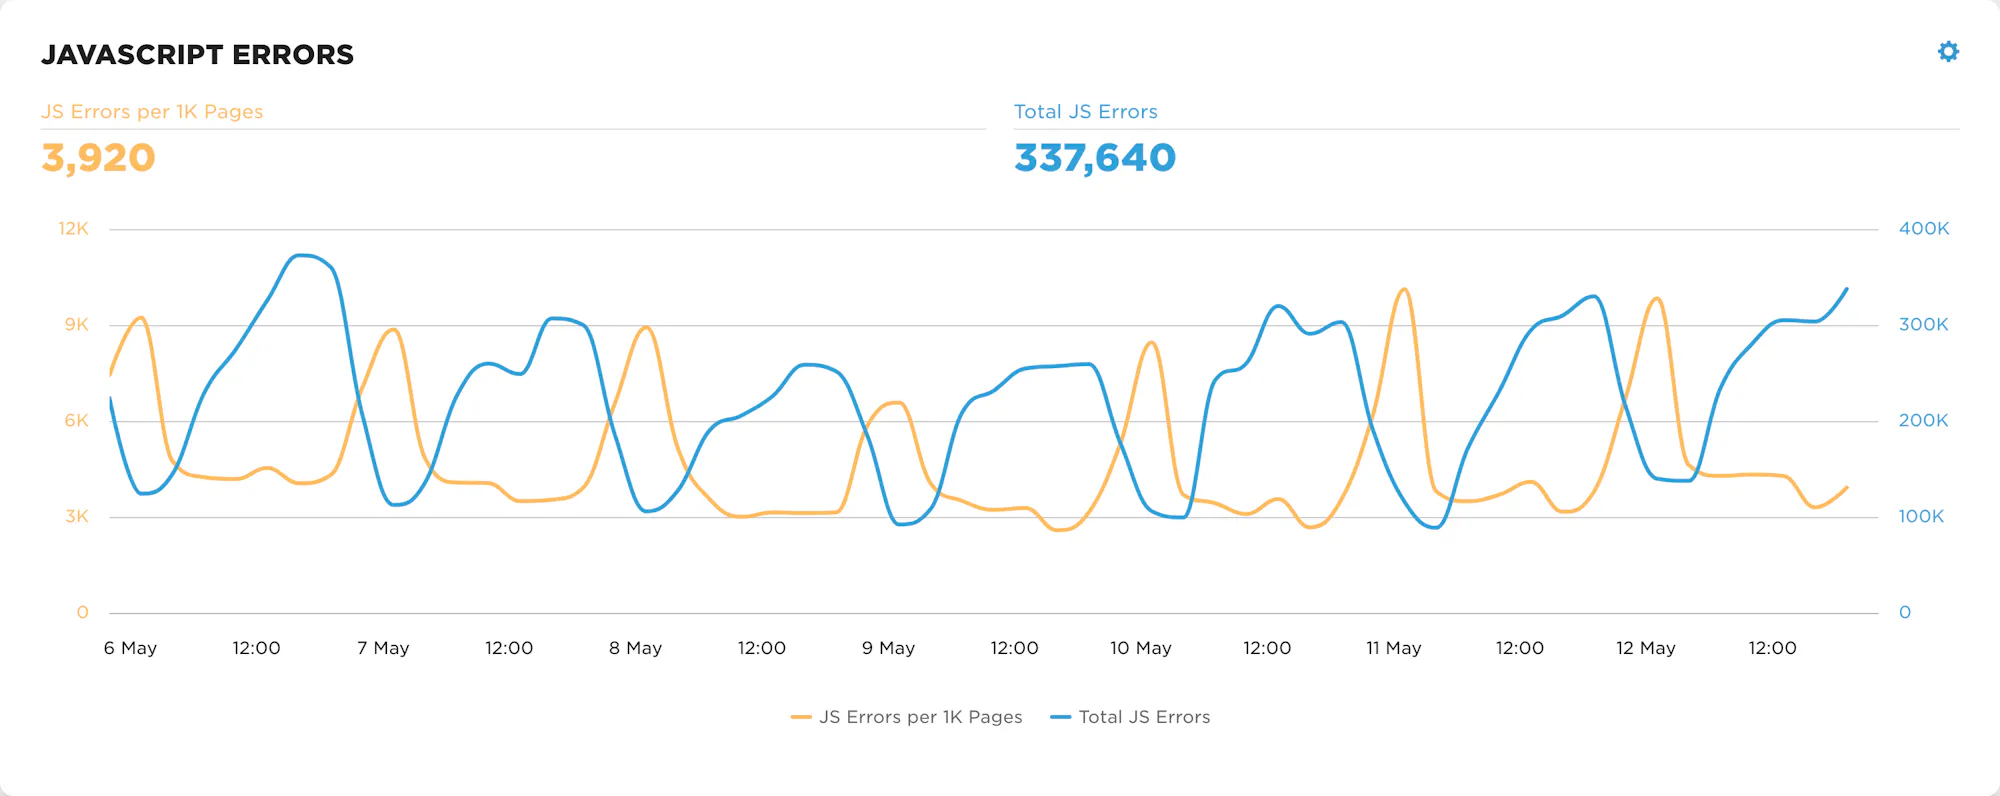
During a deployment at 08:00 pm on 7 May 2026 (UTC), SpeedCurve RUM JavaScript error tracking had an outage that lasted for 5 days, until 08:00 pm on 12 May. The outage caused the complete loss of JavaScript error details recorded by SpeedCurve's RUM script, lux.js. Total error count was recorded correctly, but the details of those errors were lost. Unfortunately our automated monitoring did not…
Performance isn’t just a technical metric or a revenue lever. It’s a perception engine. Every delay subtly reshapes how users evaluate your credibility, professionalism, and trustworthiness. Once perception shifts, it’s difficult to reverse. We’ve known for years that slow pages hurt conversion rates . They increase bounce . They reduce revenue . They drag down engagement . But there’s another…
In a world full of friction – slow lines, dropped calls, canceled flights – creating moments of digital flow can feel like a gift. "Fast enough" isn’t just about protecting conversion rates. It’s about creating experiences that preserve momentum, reduce friction, and feel almost invisible. When it comes to web performance, how fast is fast enough? It’s a question I’ve tried to answer in different…
I say this every year, and every year I mean it: this has been a big year, for both SpeedCurve and the web performance community! Some highlights: Broad browser support for important metrics like Largest Contentful Paint and Interaction to Next Paint Exciting new metrics and visualizations for measuring user happiness — as well as identifying the root causes of issues that lead to user UNhappiness…
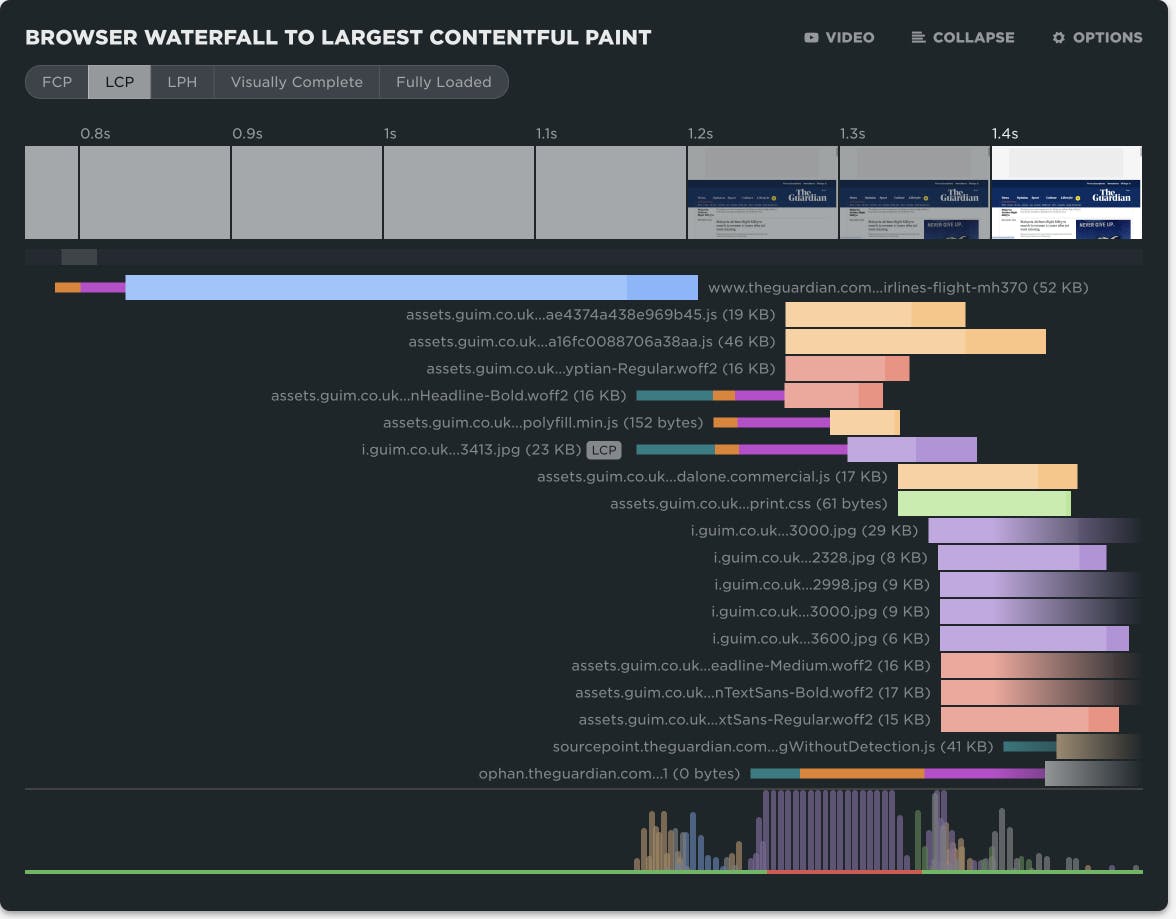
Waterfall charts are the workhorse of any web performance enthusiast. SpeedCurve's interactive waterfall is one of the first components I designed and built more than a decade ago. I've just given our much-loved waterfall chart some team-inspired updates that you may find helpful in understanding how page construction affects important user experience metrics. At SpeedCurve, we love incremental…
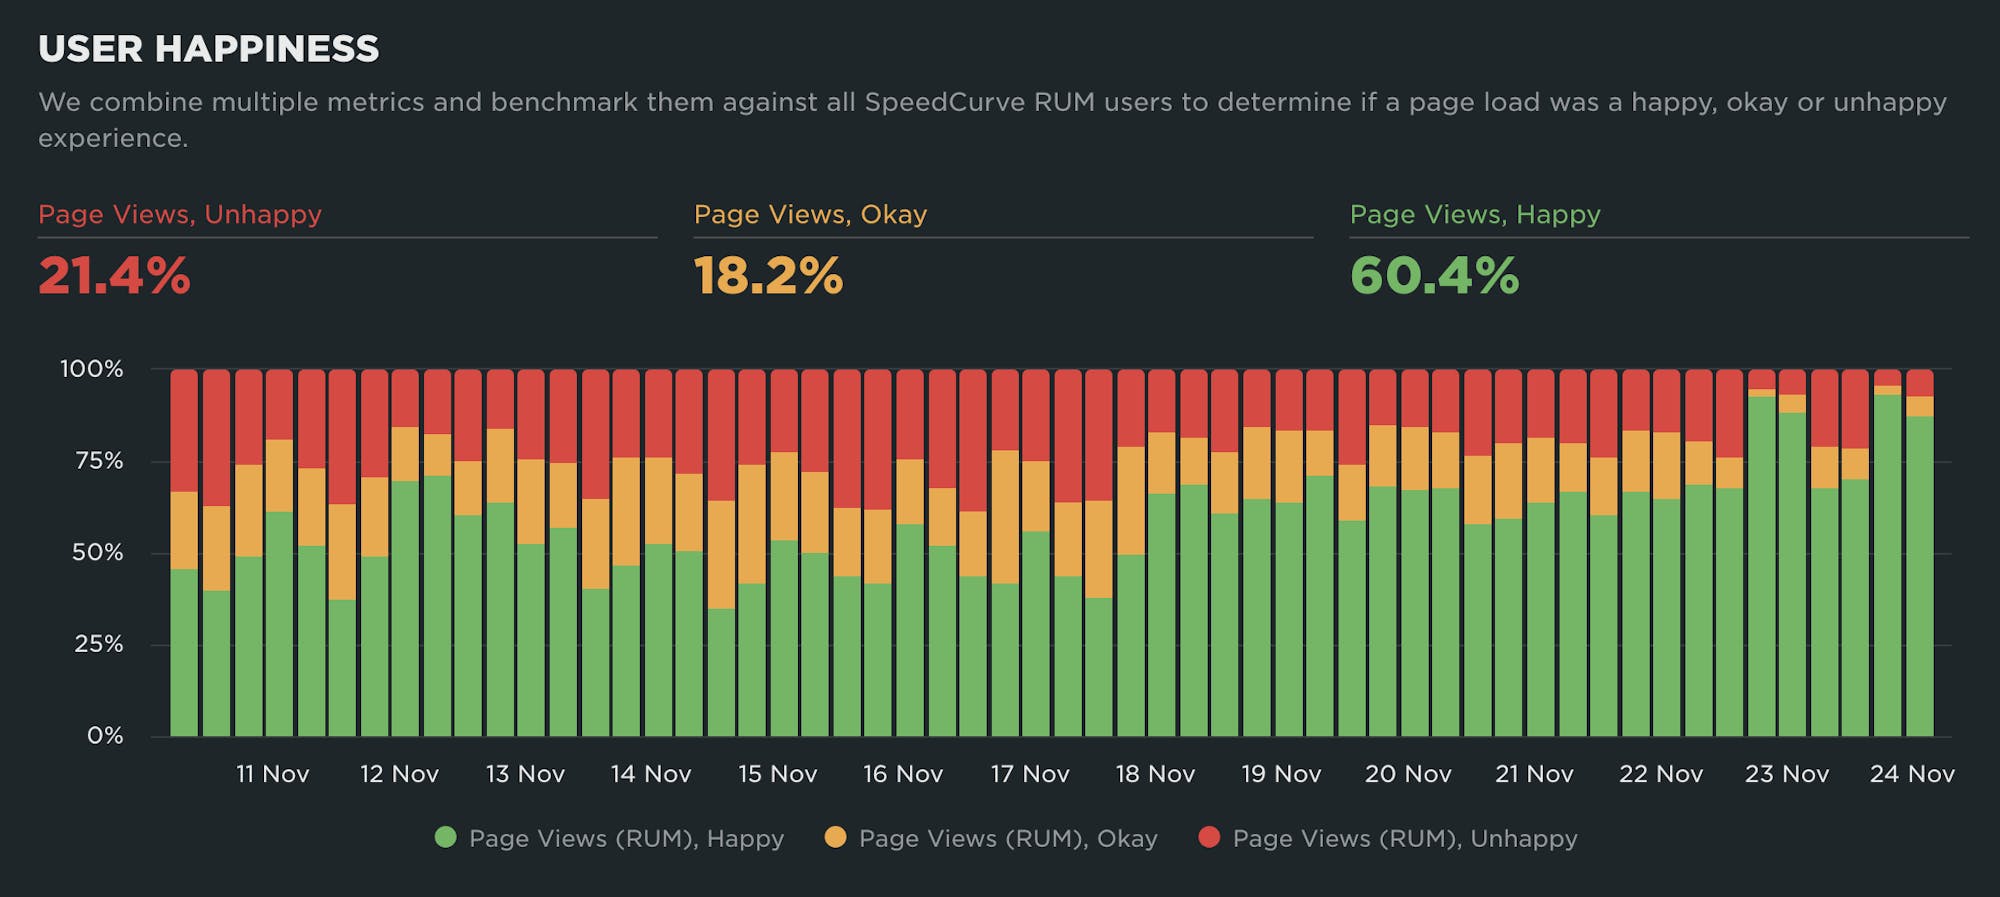
The goal of making websites faster is to make users happier. Since user happiness can't be measured directly, we launched the User Happiness metric more than six years ago. We've just released a fresh User Happiness update to reflect changes in web browsers and the overall web performance space! Back in October 2019, we released our User Happiness metric with the goal of quantifying how a user…
Hey, you! 👋🏽 Yeah, you… the person who just clicked the link to get here and read this. Thanks for clicking, and thanks for giving this node a fraction of your attention. Today, SpeedCurve joins Embrace . It’s going to be awesome and exciting. You can read all the details in the press release and Andrew's blog post or join us for a chat on Dec 9th. I want to take this moment to remind you, and…
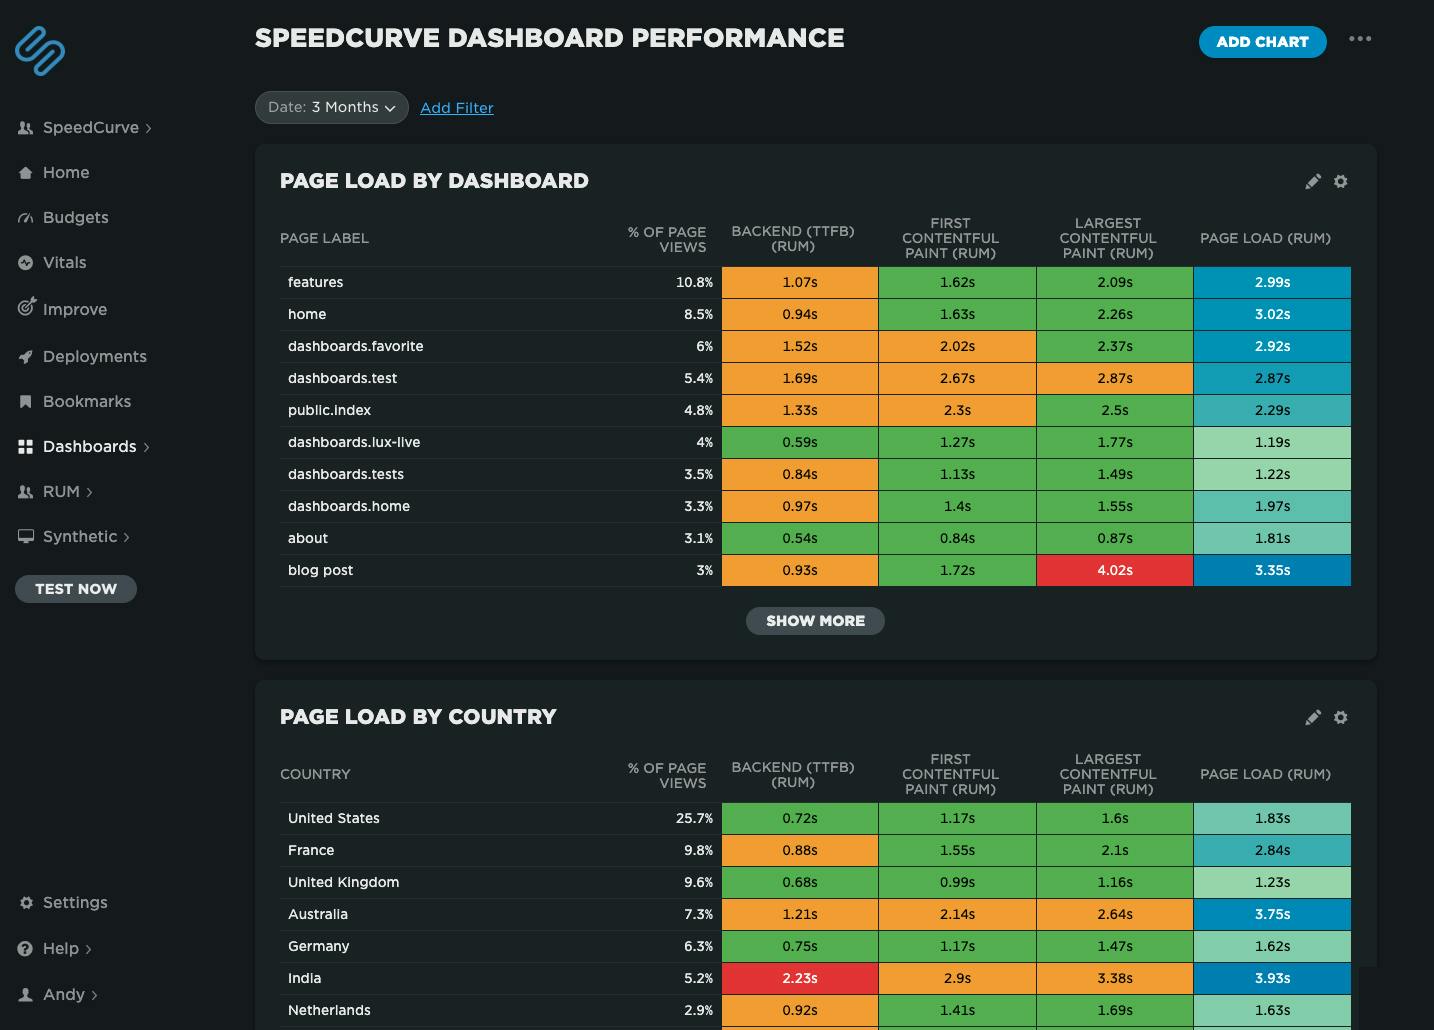
We’re thrilled to announce that you can now add heatmaps to your Favorites (custom) dashboards in SpeedCurve! Speedcurve's own performance data for our dashboards. We've got some issues with our blog post page performance, possibly the huge images I've been uploading! Heatmaps are a powerful way to get an instant overview of where performance issues are hiding across your site. They let you break…
Delivering a great user experience through the holiday season is a marathon, not a sprint. Here are 25 things you can do to make sure your site is fast and available every day, not just Black Friday. Your design and development teams are working hard to attract users and turn browsers into buyers, with strategies like: High-resolution images and videos Geo-targeted campaigns and content…
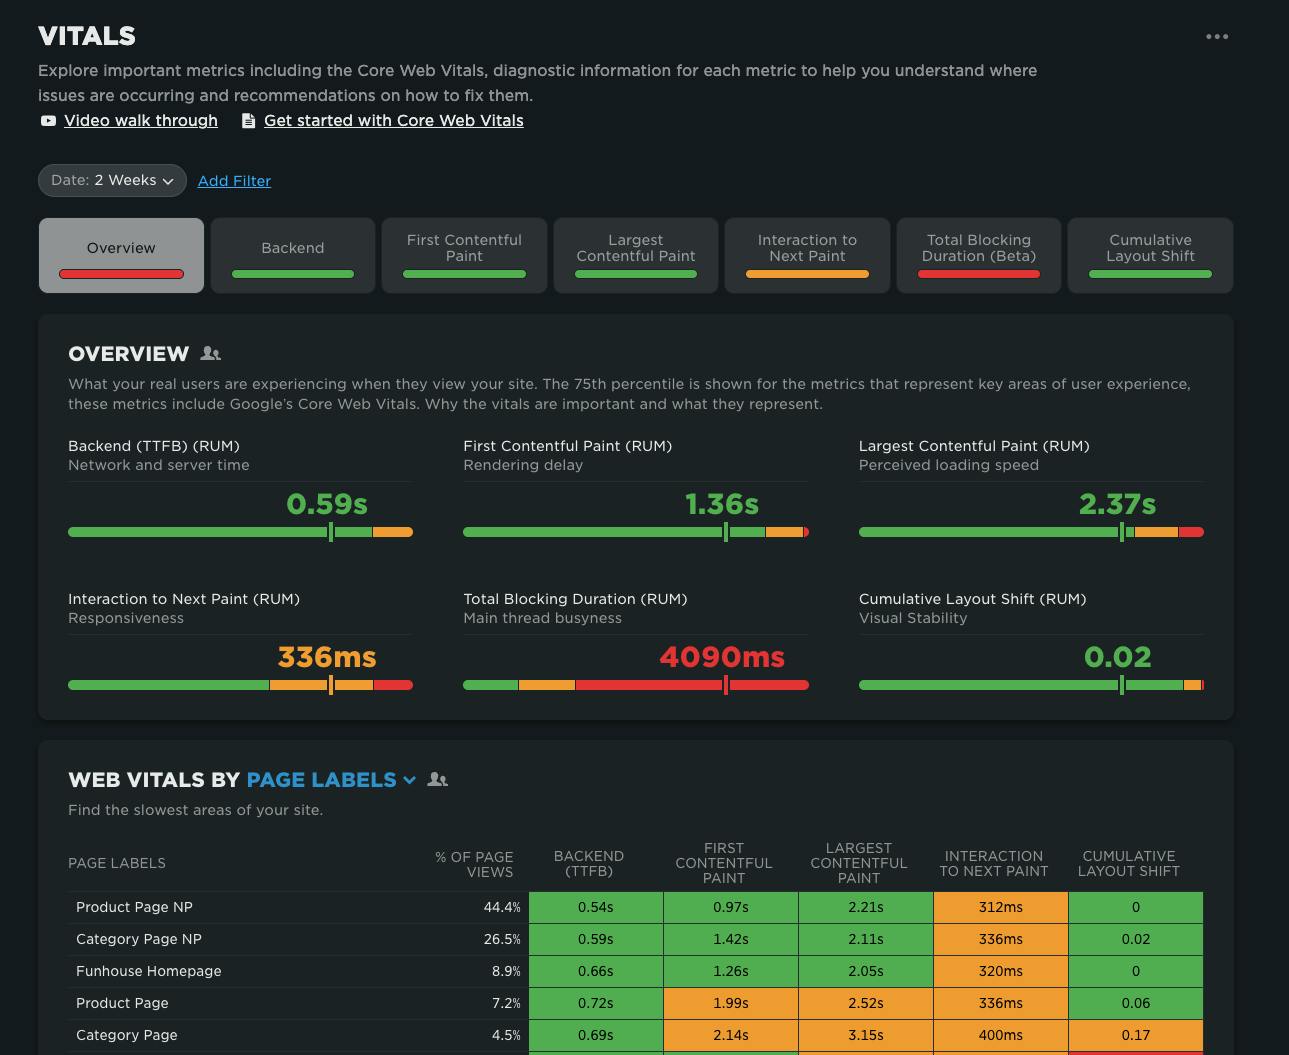
We're excited to announce the launch of the Vitals Overview dashboard in SpeedCurve - your new starting point for exploring the performance of your site. When it comes to improving web performance, the journey usually looks like this: Identify where the problems are Diagnose why they're happening Fix the issues Validate that the fixes worked Our new Vitals Overview dashboard is designed to make…