
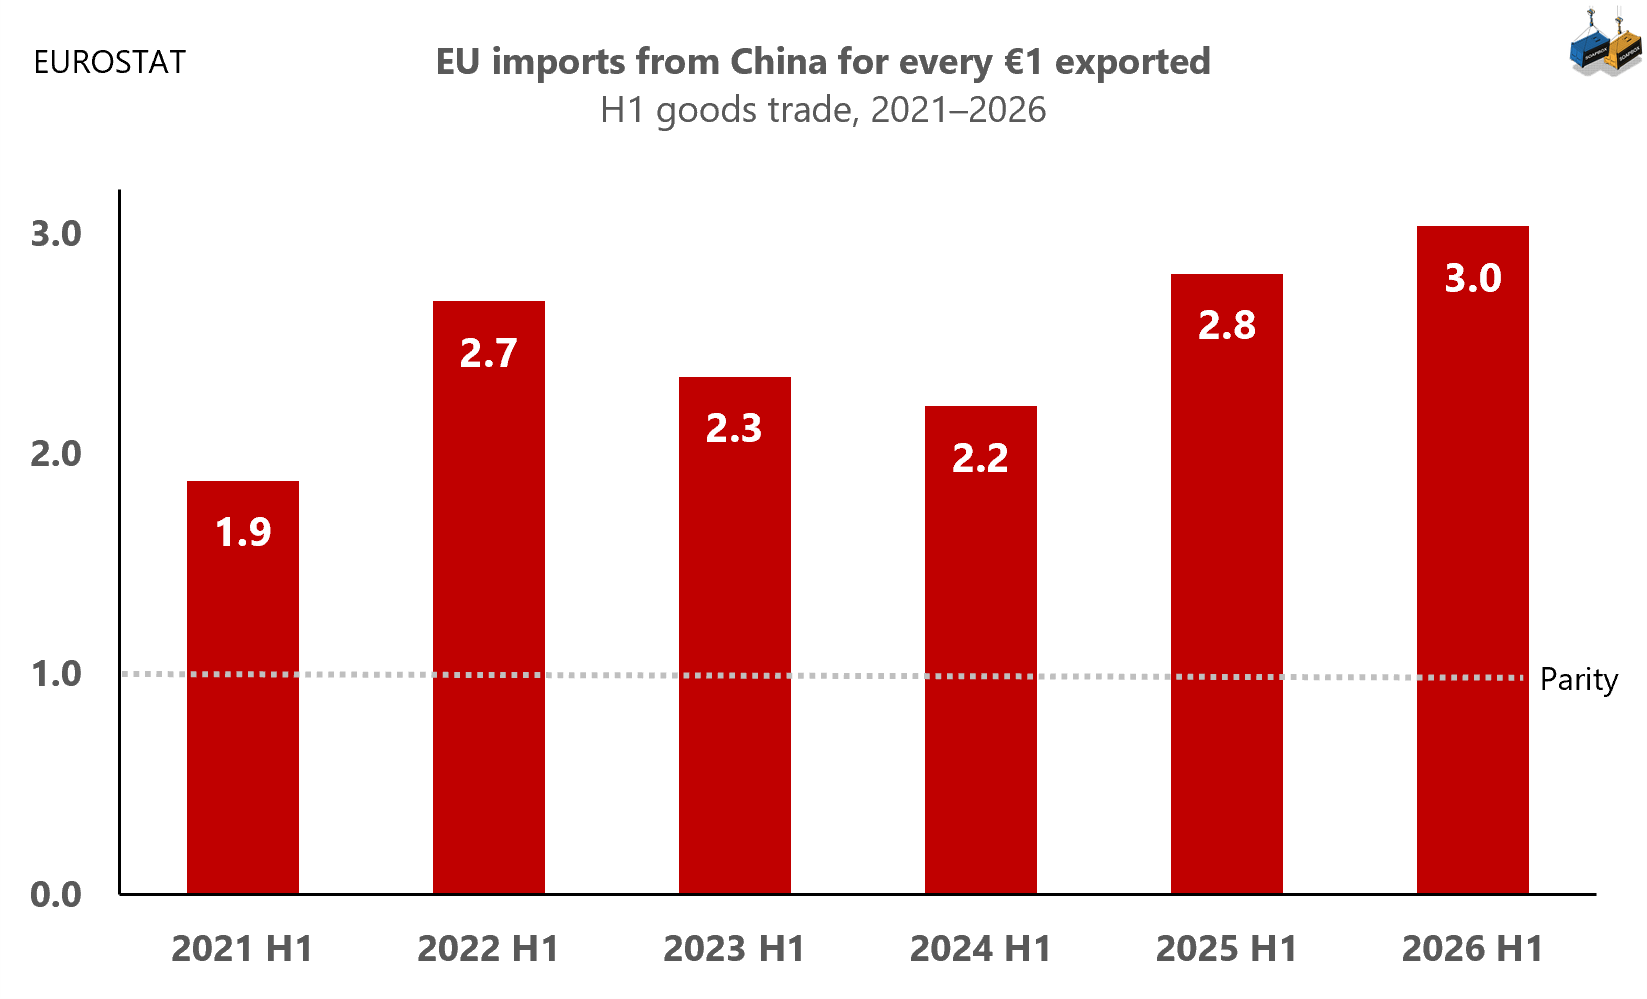
The latest Eurostat data show just how asymmetric EU-China goods trade has become. In H1 2026, the EU imported €3 of goods from China for every €1 it exported there, the highest ratio in the 2021–2026 period shown.
The ratio stood at 1.9 to 1 in H1 2021. After narrowing somewhat in 2023 and 2024, the imbalance widened sharply again, reaching 2.8 to 1 in 2025 and 3 to 1 in 2026.
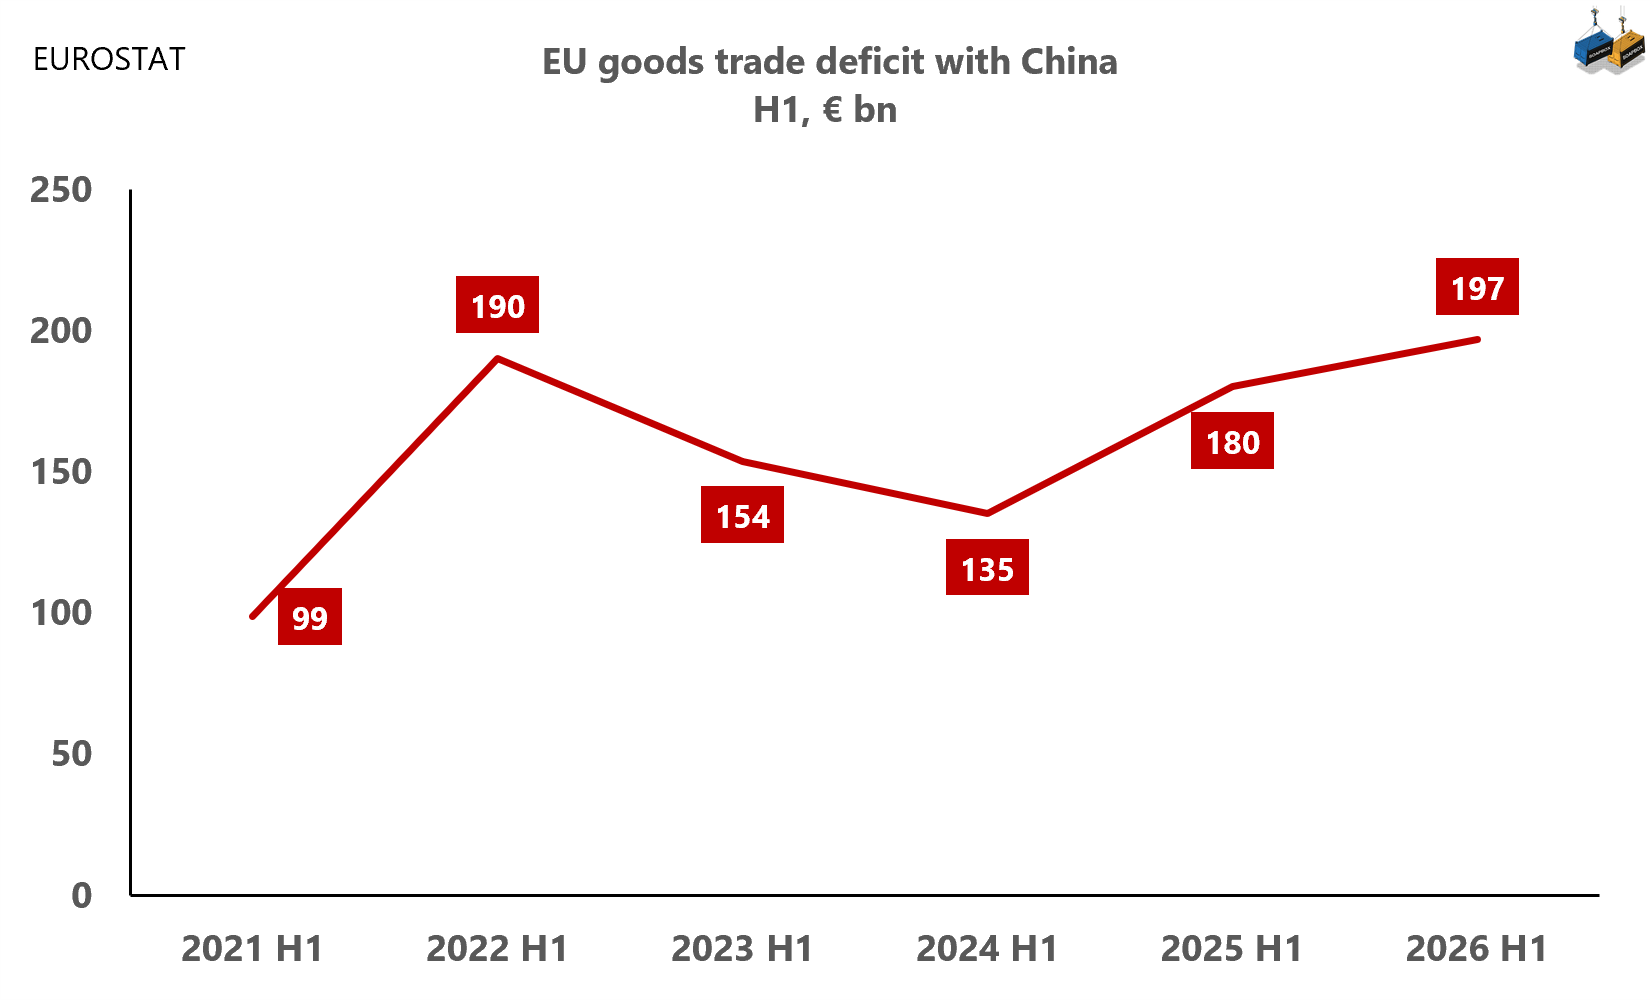
The imbalance is also at a record level in absolute terms. The EU’s goods trade deficit with China reached €197bn in H1 2026, up from €180bn a year earlier and above the previous H1 peak of €190bn in 2022.
After narrowing substantially in 2023 and 2024, the deficit has widened again for two consecutive years.
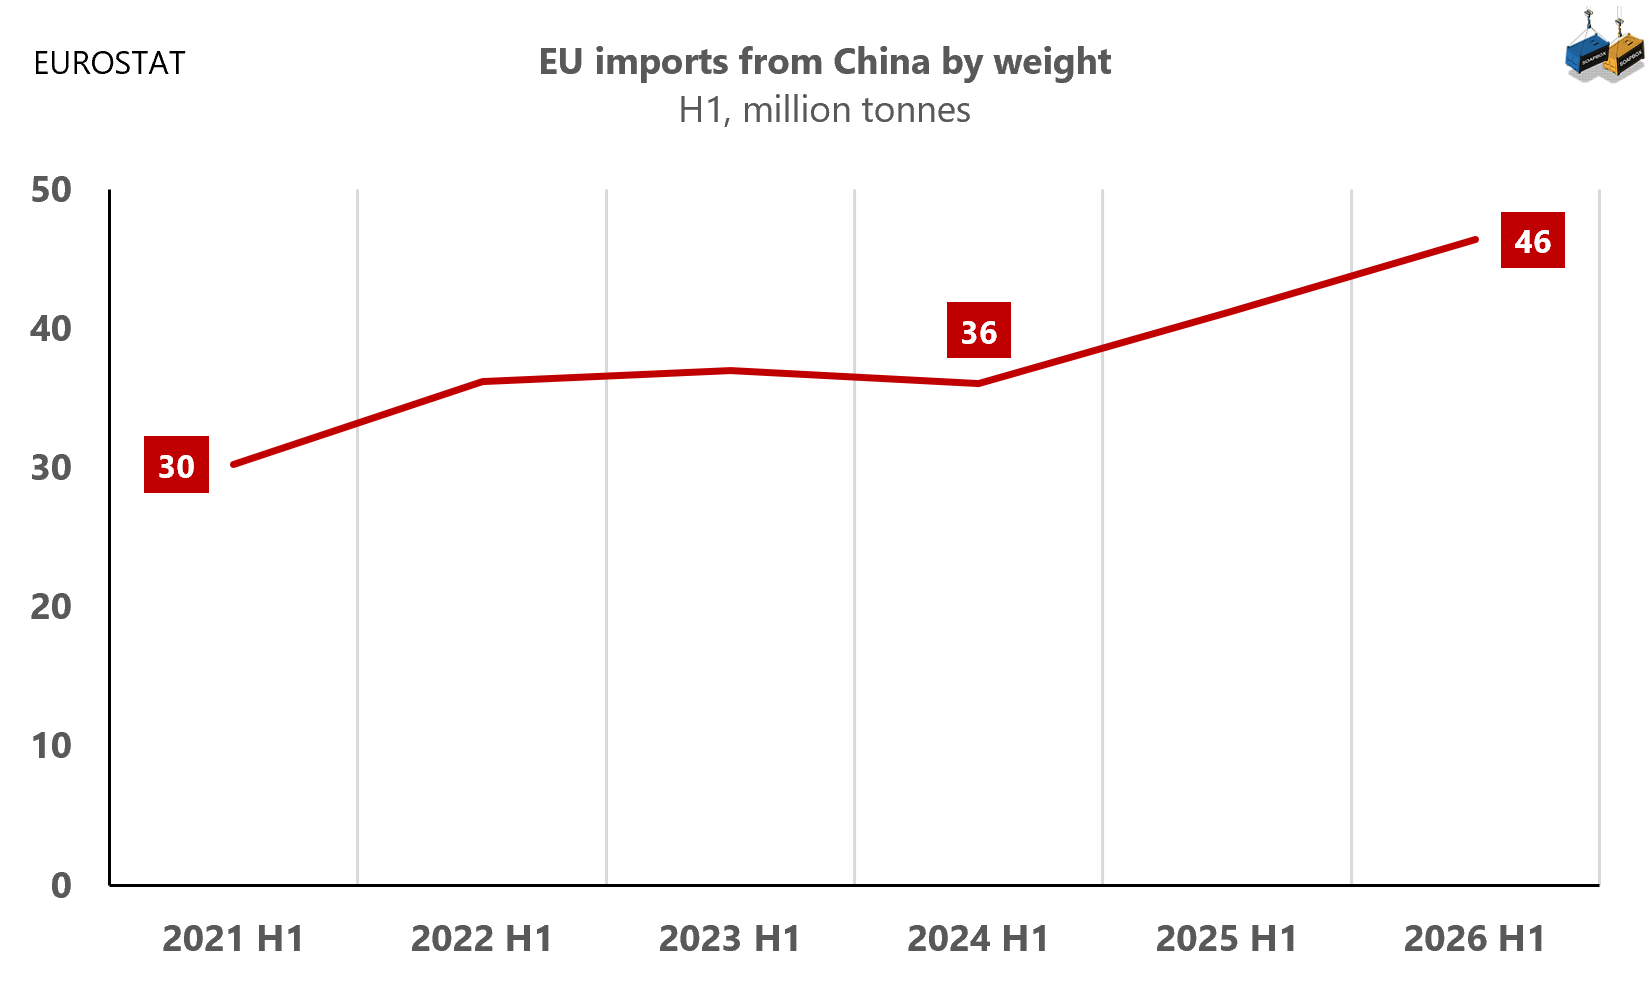
The physical flow of Chinese goods into the EU has expanded markedly. In H1 2026, EU imports from China reached about 46 million tonnes, more than 50% above H1 2021.
The increase has accelerated recently. Import weight is up by roughly 29% in just the past two years, from H1 2024 to H1 2026.
The widening EU-China trade imbalance is therefore not simply a story about prices or higher import values. Substantially more goods, measured by weight, are also entering the EU.
China accounted for 22% of extra-EU goods imports in H1 2026, virtually unchanged from 2021. But its share of extra-EU exports has fallen from 11% to just 7% over the same period.
To put that 7% in perspective, the EU now exports less to China than to the US, UK or Switzerland, and roughly as much as to Türkiye and Norway combined.
China remains one of the EU’s dominant suppliers. As a market for European goods, however, its relative importance has diminished markedly and is becoming increasingly marginal.
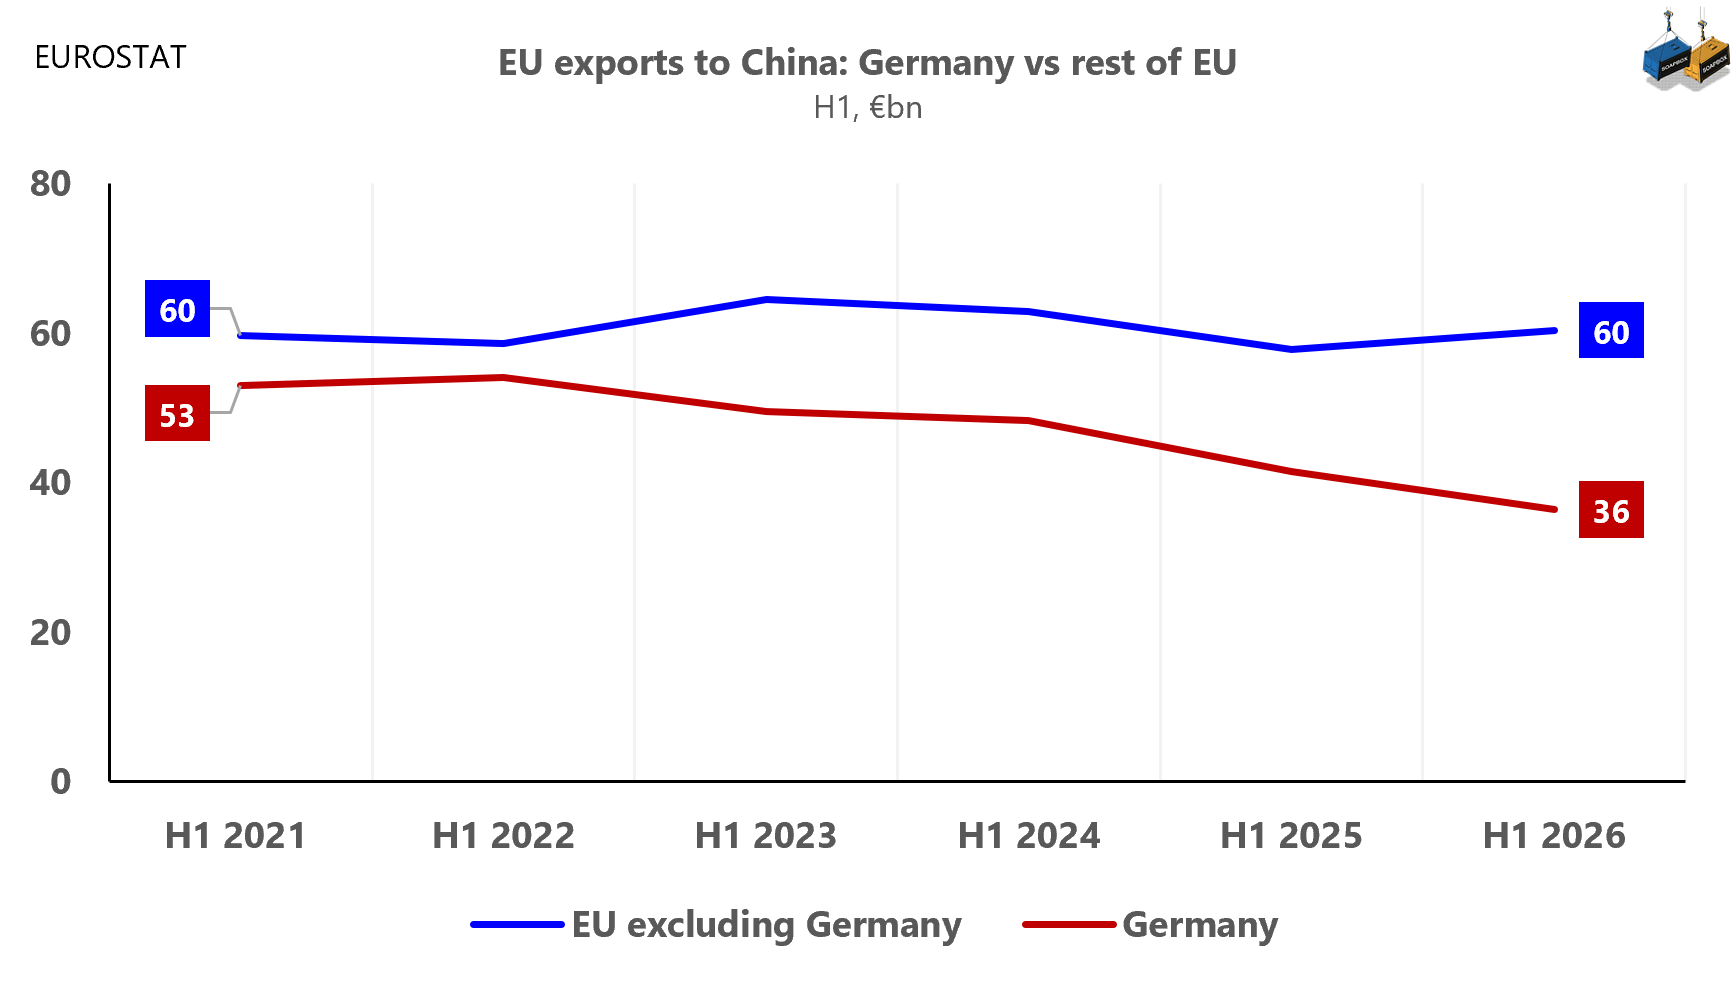
EU exports to China have weakened markedly over the past five years, but the decline is overwhelmingly concentrated in Germany.
In H1 2021, Germany exported €53bn of goods to China. By H1 2026, that had fallen to €36bn, a decline of roughly one third. Over exactly the same period, exports from the other 26 EU countries combined were essentially flat at around €60bn.
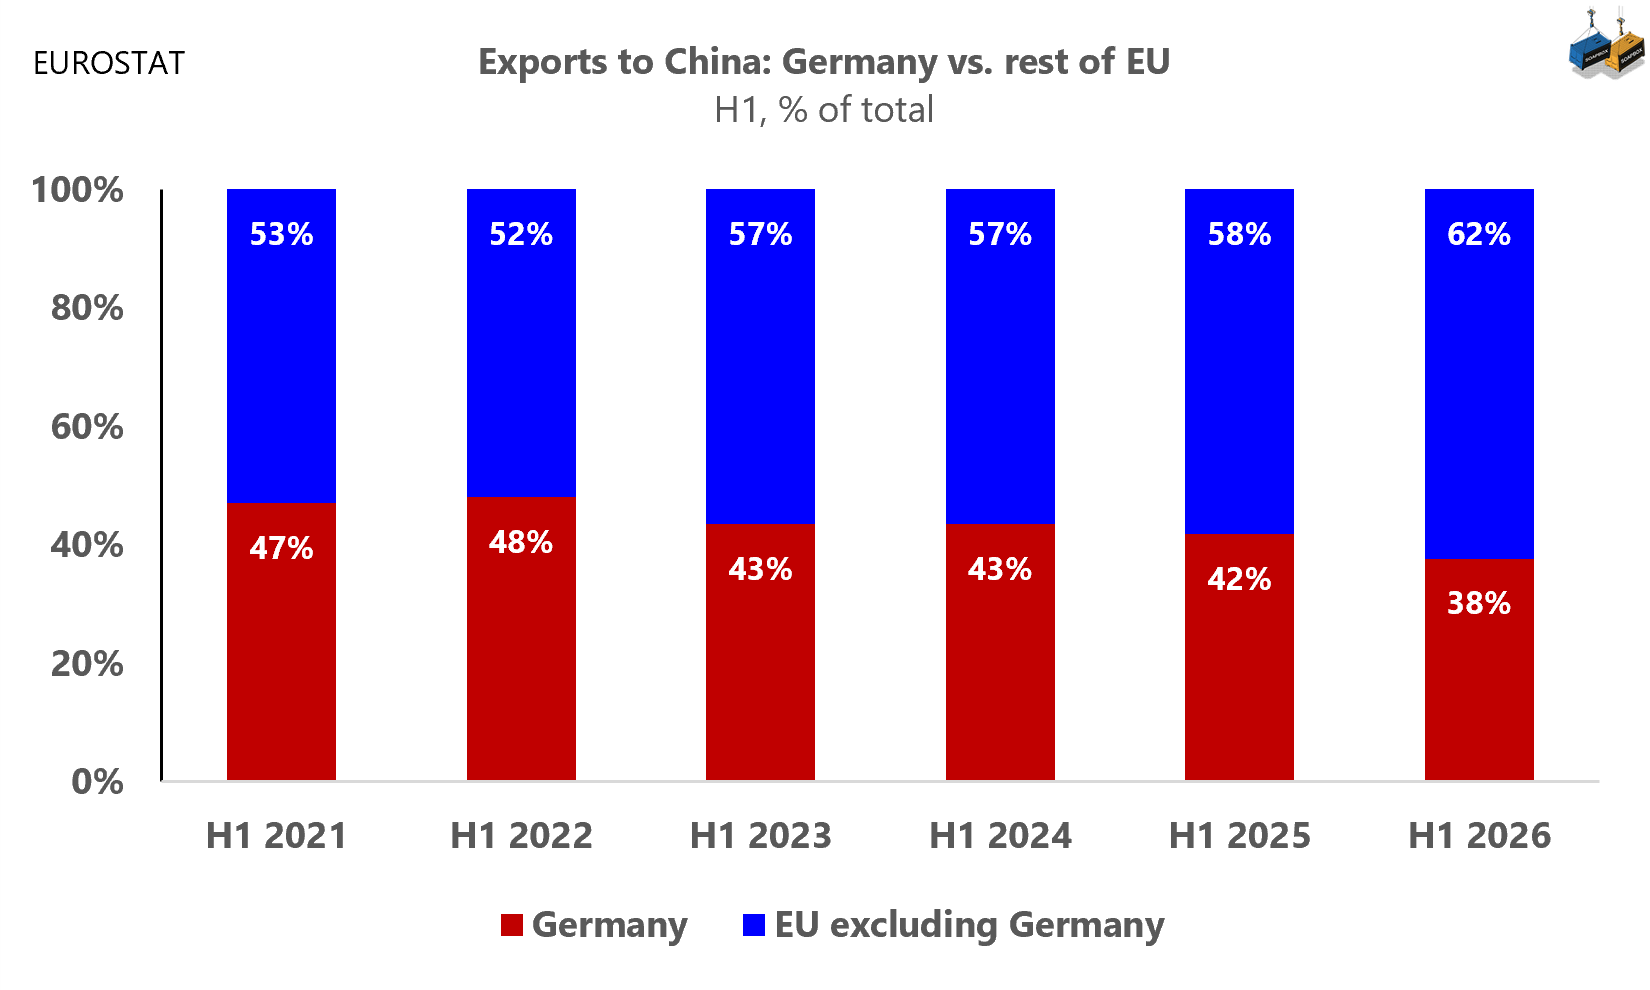
Germany therefore sits at the centre of Europe’s China export problem. Its size means that weakness in German exports has a substantial impact on the EU27 aggregate.
But the rest of Europe offers little comfort either: without Germany, EU exports to China have stagnated for five years.
Something remarkable has happened in the composition of EU vehicle imports from China. In H1 2024, the EU imported €4.7bn of fully electric vehicles from China, versus just €0.8bn of hybrids. By H1 2026, hybrids had surged to €5.2bn, overtaking fully electric vehicles at €4.4bn.
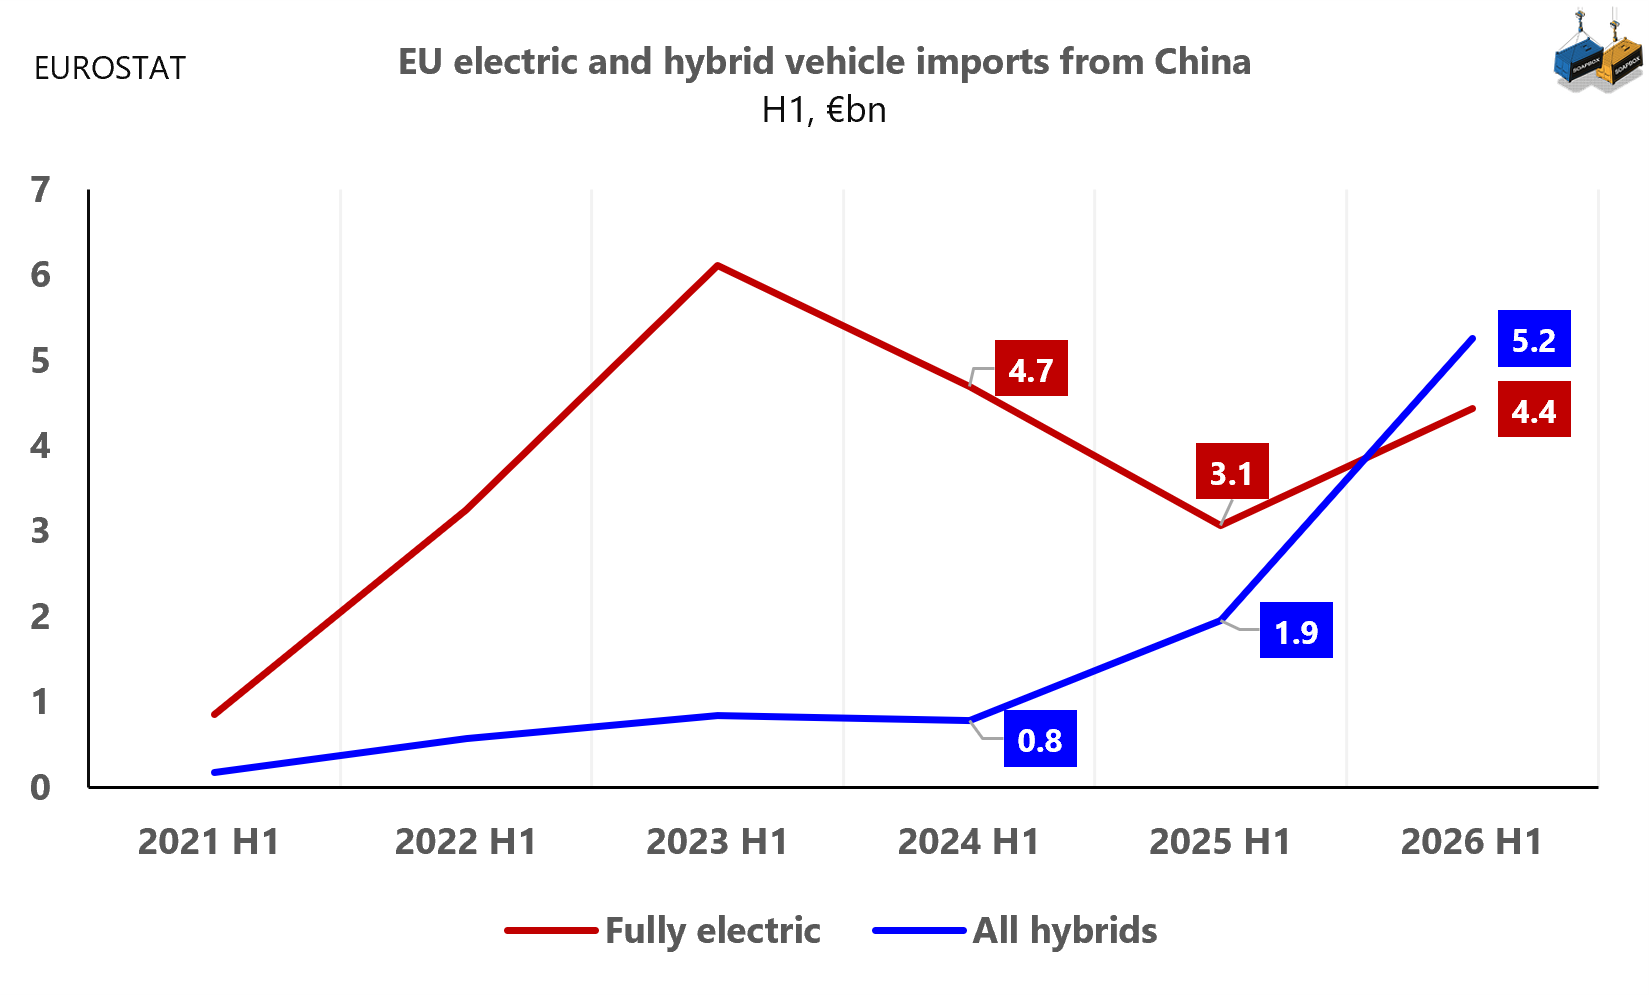
The timing is as expected. H1 2024 was the last half-year before the EU’s provisional countervailing duties on Chinese battery electric vehicles took effect on 4 July 2024. Since then, the mix has changed dramatically. This does not by itself prove that tariffs caused the shift, but it clearly shows that Chinese vehicle exports to Europe have been reconfigured.
The change is not simply a collapse in fully electric cars. Those imports actually recovered by 45% year on year in H1 2026. The bigger story is the extraordinary expansion of hybrids, especially plug-in models. In other words, Chinese vehicle exports to the EU are not disappearing. They are changing shape very quickly.
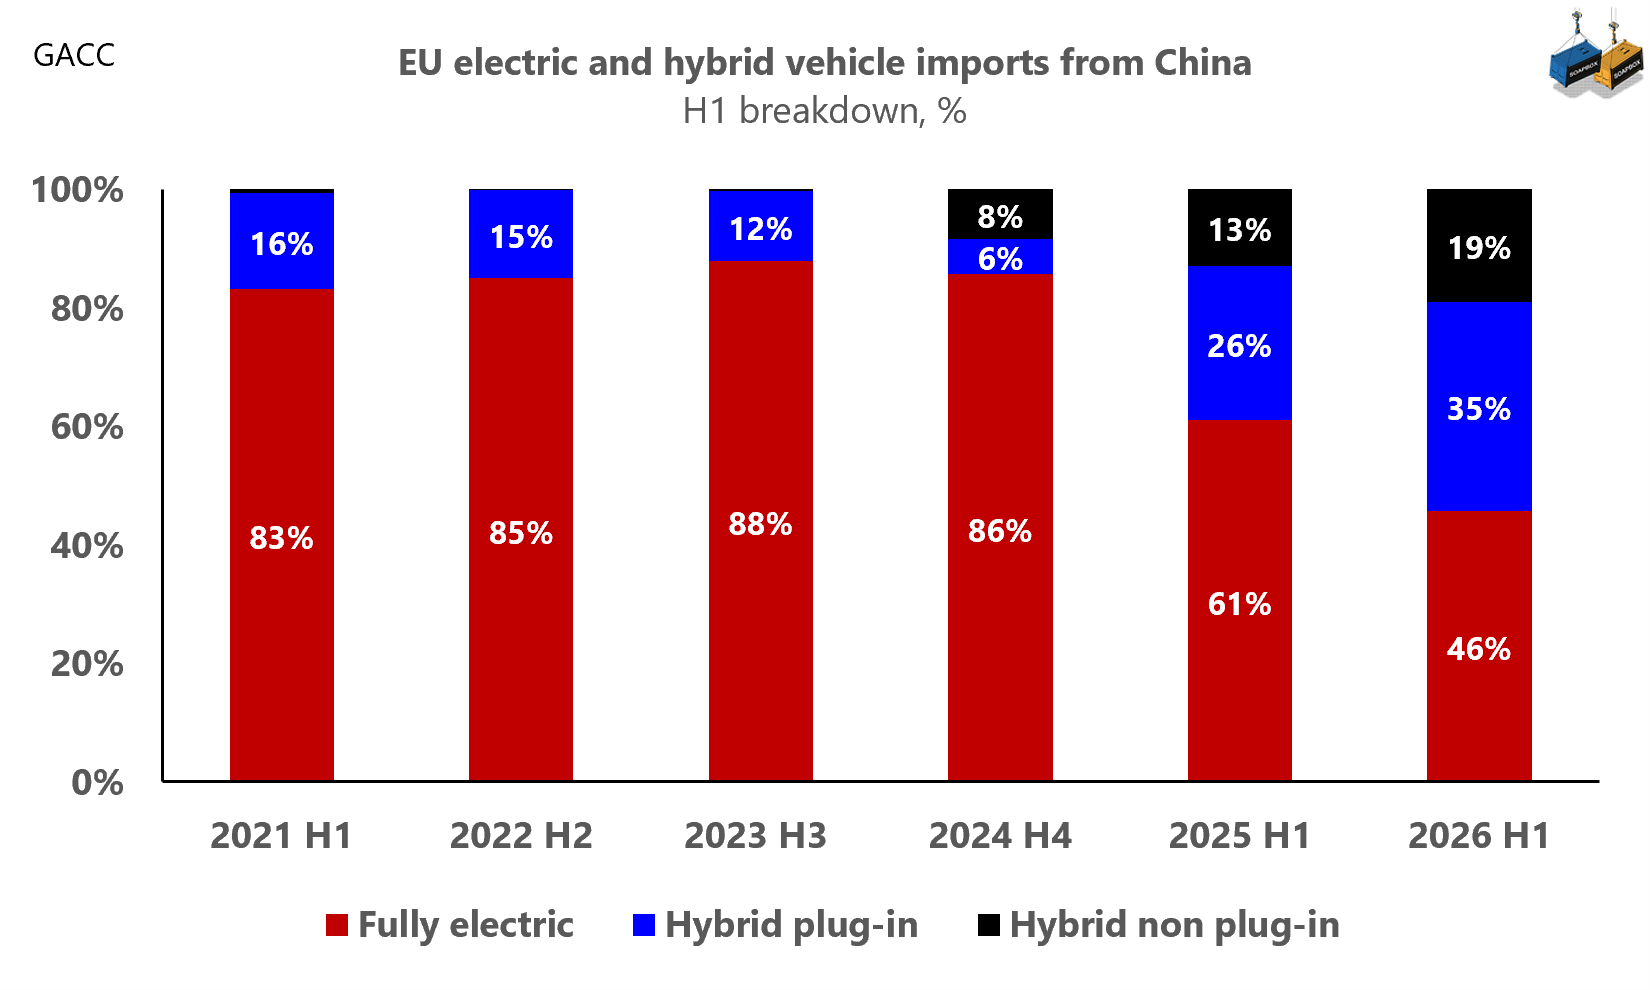
Brussels has noticed. The European Commission is reportedly already examining countervailing duties on Chinese plug-in hybrids, the category currently outside the additional tariffs imposed on fully electric vehicles. If hybrids are becoming the new route into the European market, they may also become the next front in the EU-China trade dispute.
Rare-earth permanent magnets are a small trade line with outsized strategic importance, used in electric motors, wind turbines, robotics and other advanced machinery.
In H1 2026, the EU imported 13.1 million kg of these magnets from outside the bloc. 12.2 million kg came from China, giving China a 94% share by weight.
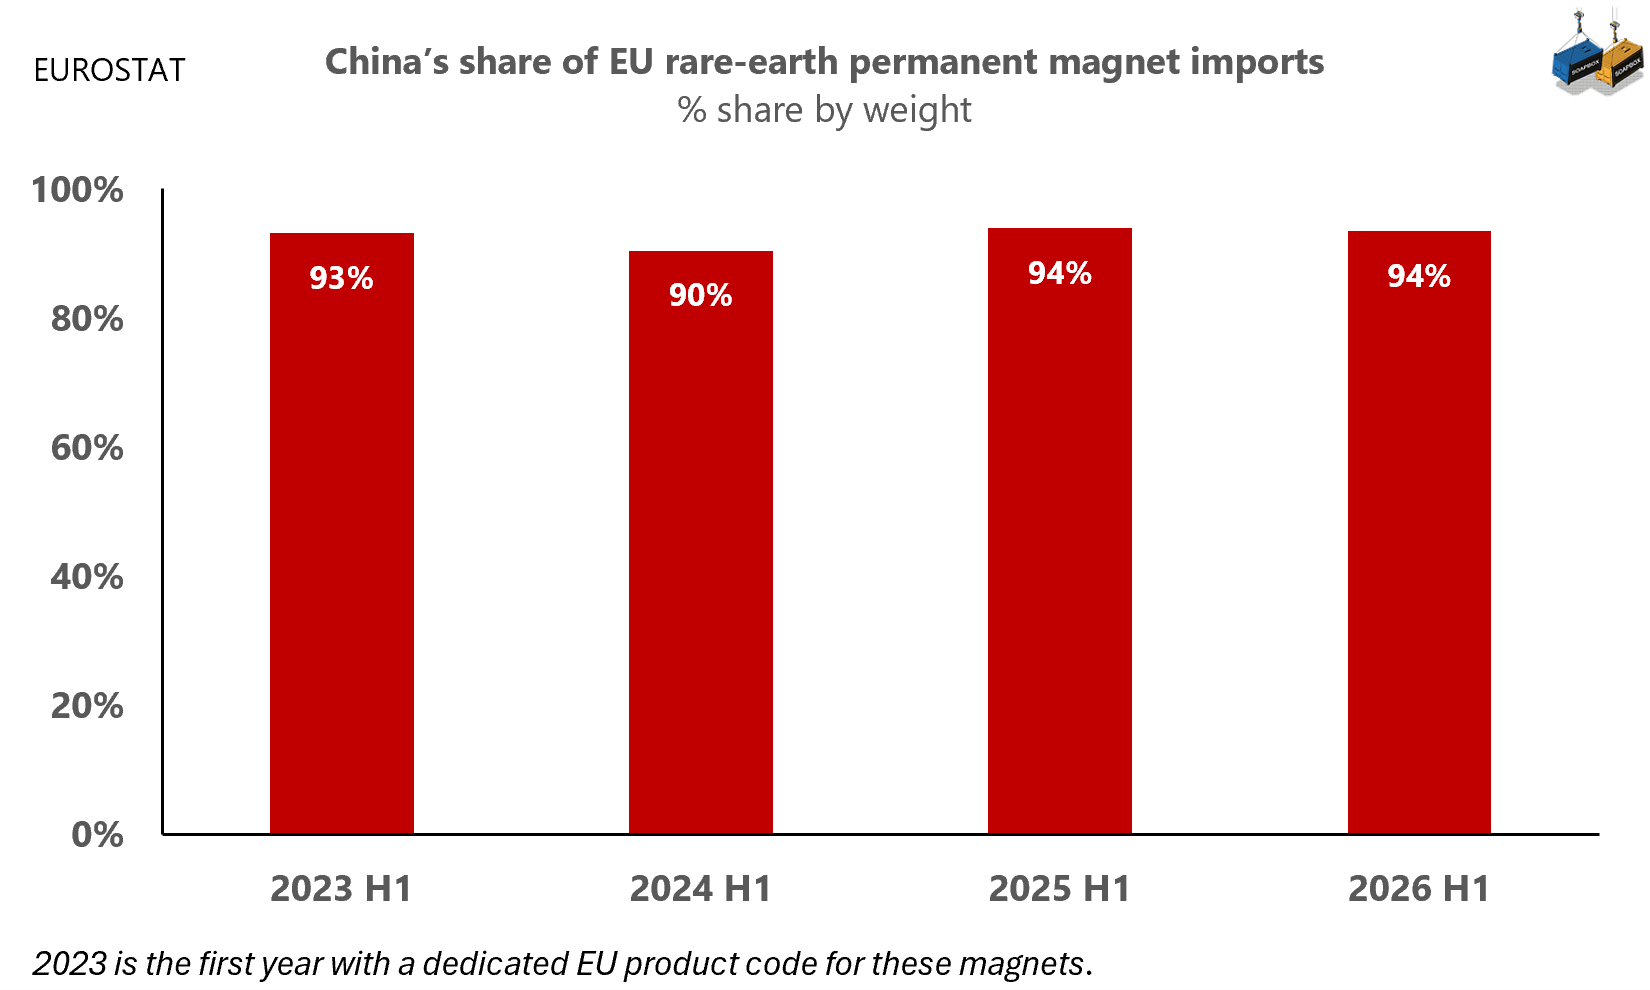
There is little sign of diversification. China’s share was already 93% in H1 2023, the first year for which Eurostat provides this dedicated product code.
It comes as no surprise that imports from China by weight actually rose 28% year on year in H1 2026, reaching the highest level in the four-year series.
The dependency looks slightly smaller in euros, at 91%, partly because Chinese imports averaged about €38/kg, compared with €57/kg from other suppliers.
For all the discussion about de-risking, in this strategically important product EU’s physical dependence on China remains almost absolute.
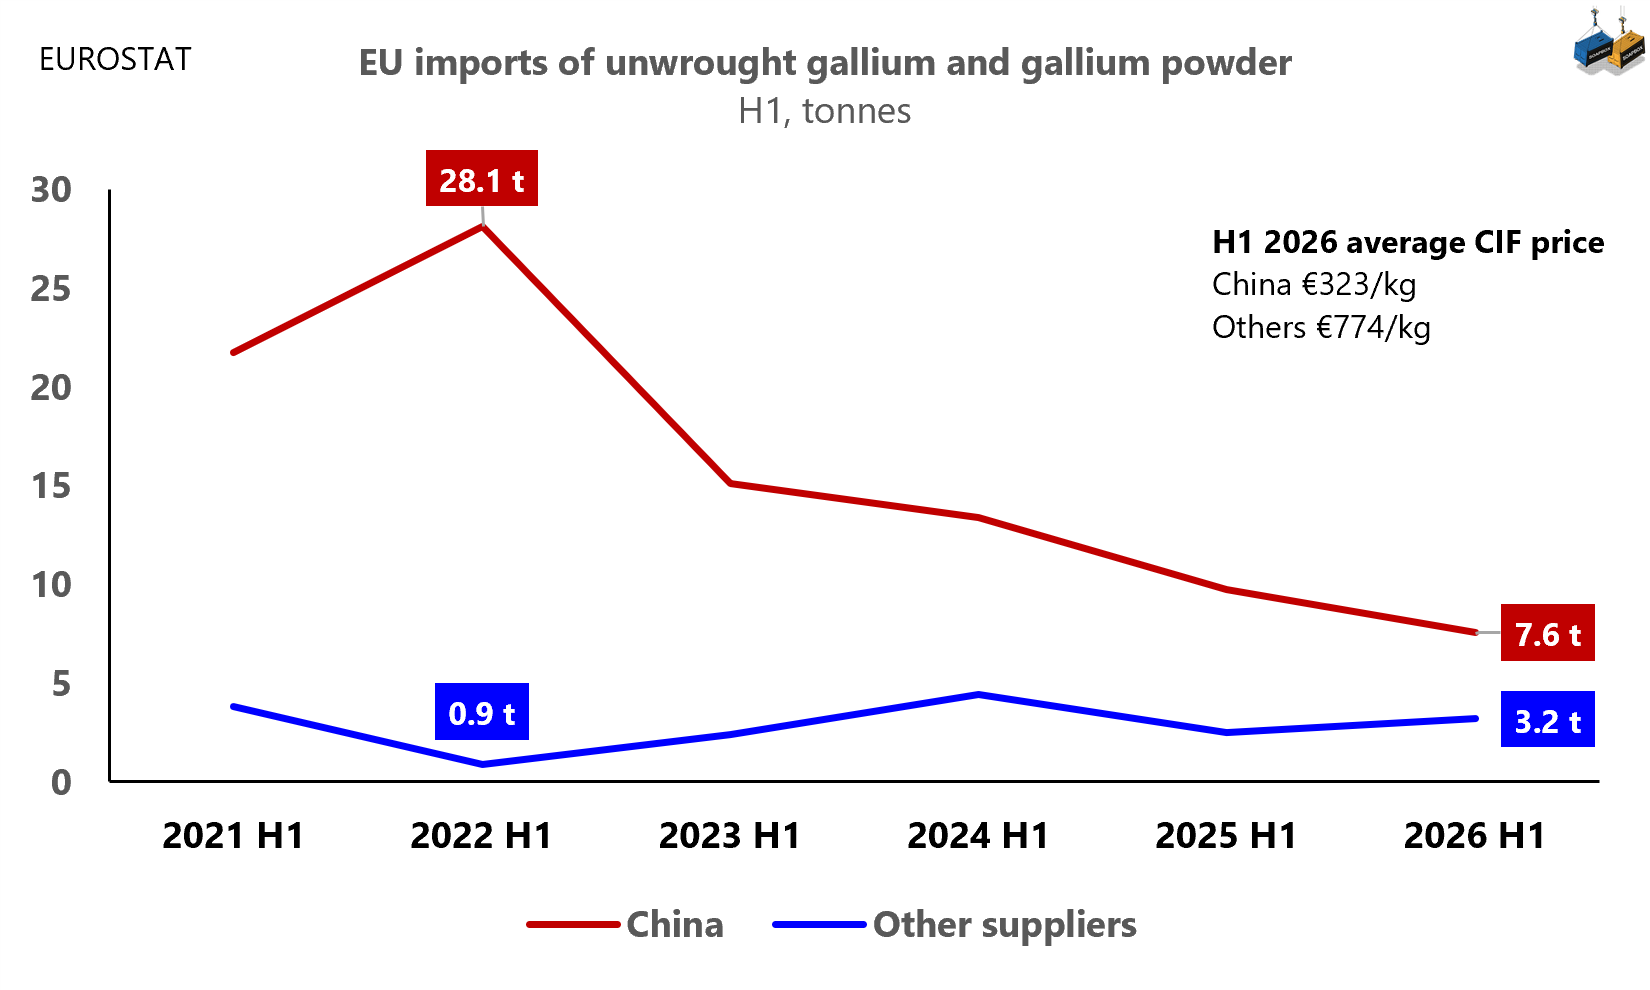
EU imports of unwrought gallium and gallium powder from China have fallen dramatically. From a peak of 28.1 tonnes in H1 2022, they were down to just 7.6 tonnes in H1 2026.
Other suppliers are filling part of the gap, but only part. Non-Chinese imports increased from less than one tonne in H1 2022 to 3.2 tonnes in H1 2026. As a result, total EU imports are still roughly two-thirds below their 2022 level.
And diversification comes at a striking price. In H1 2026, gallium imported from China had an average CIF value of €323/kg. From other suppliers it was €774/kg, around 2.4 times higher.
The figures illustrate the difficulty of diversifying a strategic supply chain once dependence is already deeply entrenched. The challenge for the EU is not simply to buy less from China, but to develop alternative supply at sufficient scale and at a competitive cost.
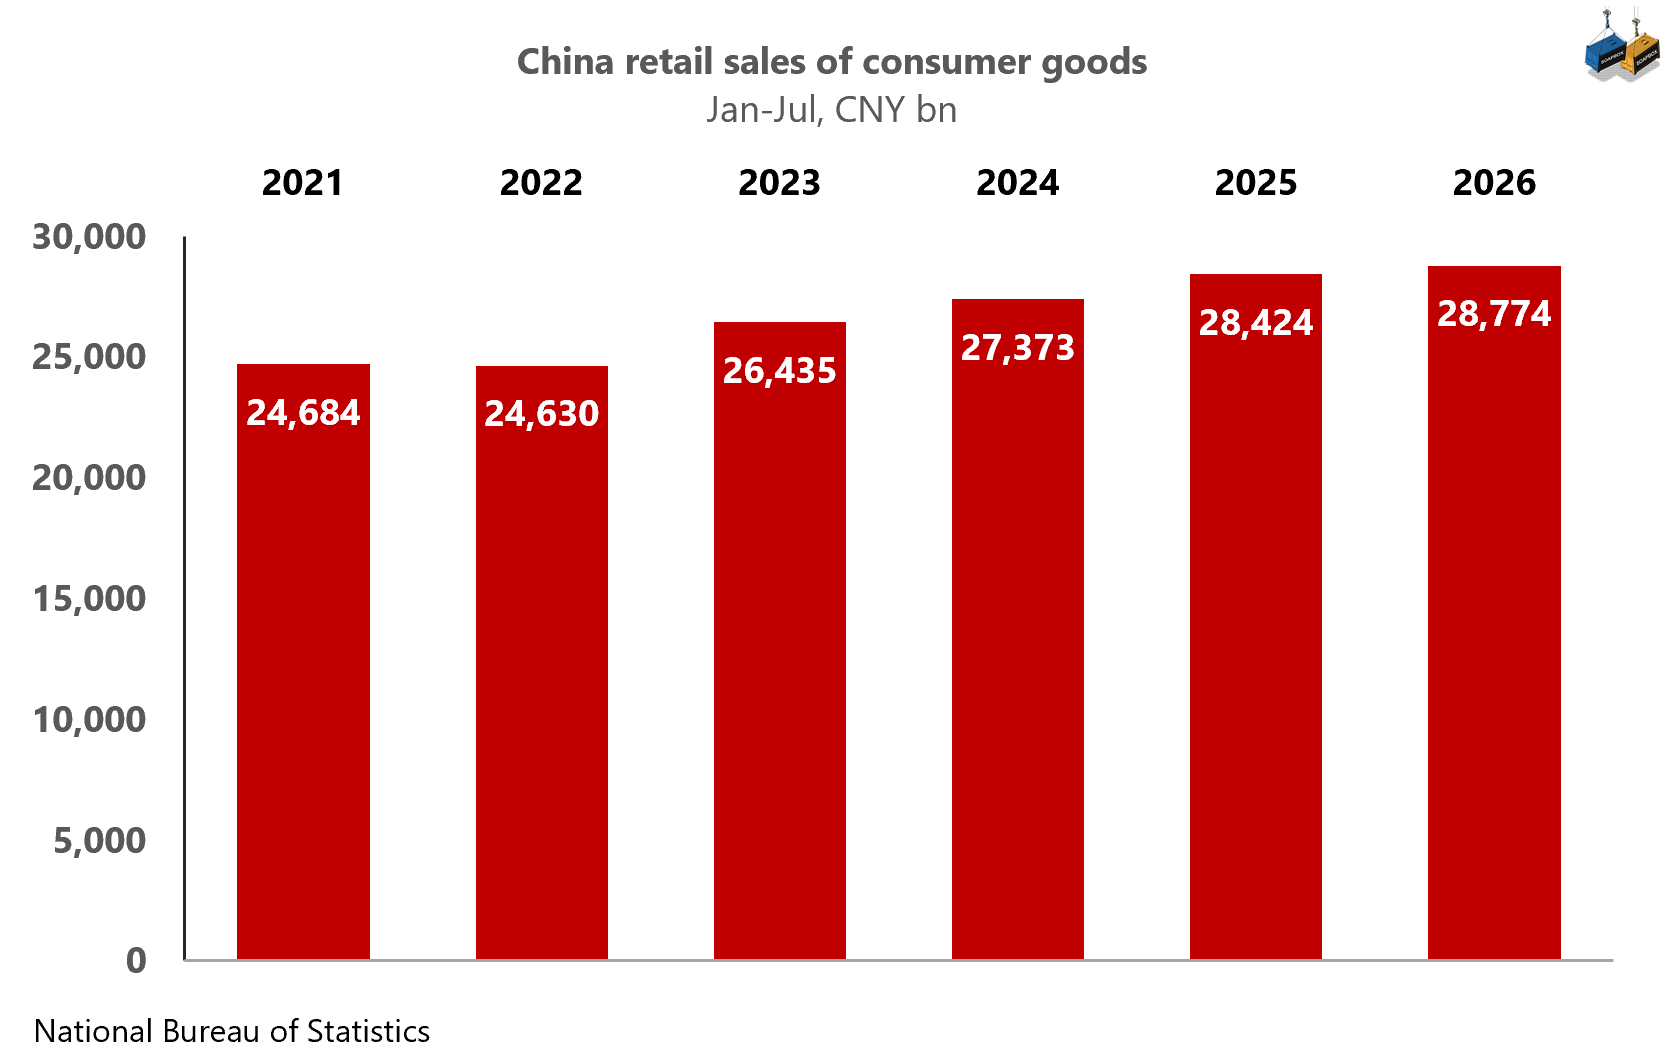
Seven months into 2026, China’s nominal retail sales of consumer goods are barely growing. Jan–Jul sales reached CNY 28.8tn, only about 1.2% above the same period last year.
But the problem is not confined to 2026. Since 2021, Jan–Jul retail sales have grown at a compound annual rate of only about 3.1%, notably slower than the economy as a whole. Over roughly the same five-year period, nominal GDP has expanded at around 5.5% a year.
SOAPBOX has returned to this issue repeatedly. Beijing clearly recognises the need to strengthen domestic demand and give consumption a larger role in growth. Yet the numbers still point in the opposite direction: retail sales are not gaining weight relative to the economy.
For now, the emphasis on consumption remains much more visible in policy language than in the hard data. Read next entry.
(福利主义 means “welfarism”, and it is not our label. It is terminology used by Xi Jinping himself when warning against falling into a “welfarism trap”.)
China’s latest measures to stimulate county-level consumption follow a familiar pattern: better retail infrastructure, more services, new consumption scenarios, support for employment and entrepreneurship, and cheaper credit.
What they do not contain is a meaningful broad transfer of purchasing power to households.
There is an ideological boundary worth remembering. Xi Jinping has explicitly warned against falling into the welfarism (福利主义) trap.
This explains a paradox in China’s consumption policy: families are getting more shopping choices, but no extra money to spend.
Look at the chart carefully. Both lines describe China between 2015 and 2019. Both come from successive versions of the Penn World Table, one of the most widely used international databases for productivity research.
Yet they tell opposite stories.
Under PWT 10.01, China’s total factor productivity fell by about 5% between 2015 and 2019.
Under PWT 11.0, recalculating exactly the same years, it rose by about 11%.
Nothing changed in 2015–2019. The methodology did.
Total Factor productivity (TFP) is not something statisticians observe directly. It is essentially what remains after economists estimate how much economic growth can be explained by additional labour and capital. If measured output grows faster than those inputs, the unexplained part is attributed to productivity.
That makes the result particularly sensitive to the GDP series used.
The earlier Penn World Table methodology (PWT 10.01) used an adjusted measure of Chinese GDP rather than simply relying on China’s official real growth series.
PWT 11 changed that treatment and now uses official Chinese GDP.
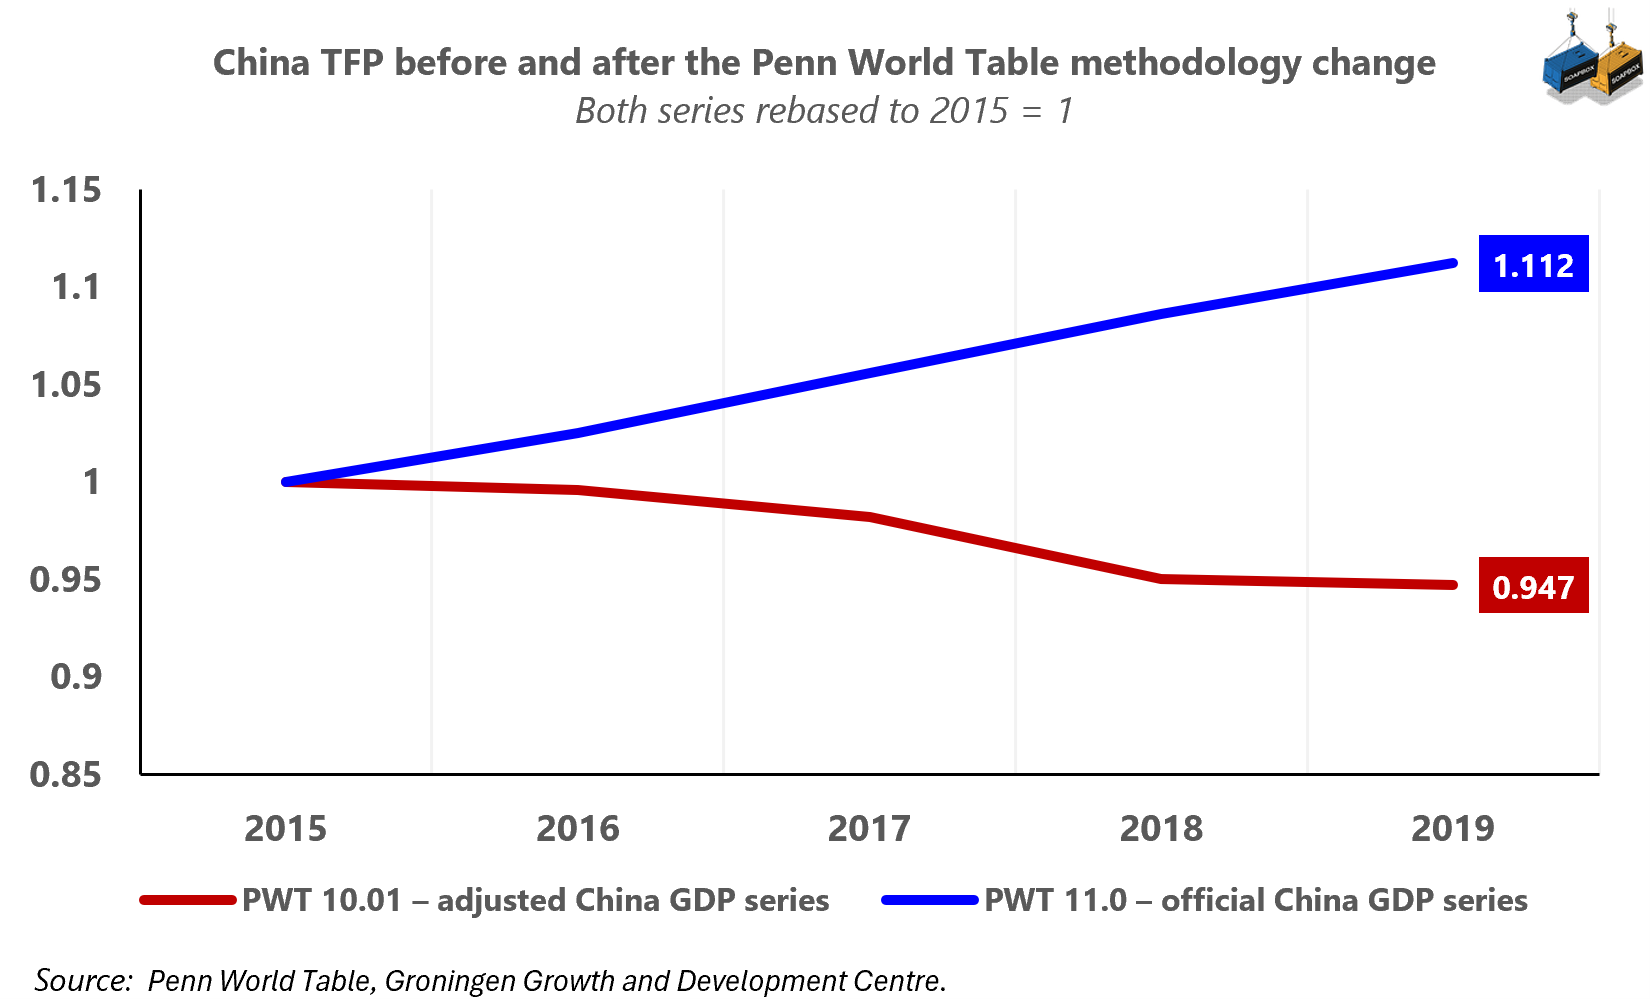
The consequence is remarkable. A historical period that previously showed falling Chinese productivity now shows strongly rising productivity. Rebasing both series to 2015 = 1 makes the divergence impossible to hide. By 2019,
One methodology puts Chinese TFP at 0.947.
The other puts it at 1.112.
In our view, a gap this large should make us very cautious about treating any single estimate of China’s TFP as a hard economic fact. When the same five years can move from −5% to +11% largely because the treatment of underlying GDP changes, the uncertainty is not at the margin. It sits at the centre of the result.
What surprised SOAPBOX most was not that Penn World Table revised its methodology. Databases do that. It was the scale of the consequence and how little attention it seems to have attracted. For 2015–2019, the revision does not merely move China’s estimated TFP up or down a little. It reverses the direction of the story, from a 5% decline to an 11% increase.
Zhu Rongji, China’s premier from 1998 to 2003, died on August 12 at 98. The official obituary credits him with driving major market reforms and overseeing the difficult negotiations that culminated in China’s accession to the WTO.
In hindsight, Zhu's remarks from that period look spectacularly misguided today, in 2026. In April 1999, Zhu said that if a trade deficit allowed China to import technology and improve management, it could be a pleasant burden.
The pleasant burden line is a jewel. It tells us much more than the generic description of Zhu as a reformer. This was the Chinese premier, in the middle of the WTO negotiations, explicitly arguing that importing more than China exported could be beneficial.
What makes the remark especially interesting is that China never actually experienced Zhu’s pleasant burden. It has not recorded an annual goods-trade deficit since 1993, and every year since WTO accession has ended in surplus.
A trade deficit was a burden Zhu said China was prepared to embrace. It never did.
The White House recently published a report with a title difficult to ignore: The Great Transshipment Scam.
Its central argument is that part of the sharp decline in direct Chinese exports to the United States since the 2018 tariffs did not simply disappear. Some of that trade, it argues, was rerouted through third countries. At the end of the analysis, the White House cites $89.6 billion of trade consistent with this pattern.
The claim was bold enough that we wanted to look for ourselves. We used CEPII’s BACI database, which records bilateral world trade product by product, and we compared 2017, before the Section 301 tariffs, with 2024.
The basic test is intuitive.
Take a particular product. China loses share in the U.S. market. At the same time, a third country begins importing more of that same product from China and exporting more of it to the United States.
That does not prove transshipment. But it is precisely the statistical pattern one would expect if rerouting were taking place.
Our first result was remarkable. Applying a broad screen similar to the one described by the White House produced $89.63 billion. Almost exactly the White House figure.
It was not yet convincing. The problem is that such a broad calculation can capture a great deal of perfectly legitimate trade. A country may already have been exporting that product to the United States before the tariffs. It may have developed new production capacity. Also, Chinese components may have undergone substantial transformation abroad. And we cannot forget that Chinese companies may simply have moved manufacturing overseas. Aggregate trade statistics cannot distinguish those possibilities from simple rerouting. So we made the test harder:
We counted only the increase relative to the pre-tariff period rather than the entire existing trade flow.
We required the China-to-third-country and third-country-to-U.S. legs actually to move in the expected direction.
We constrained the amount attributed to third countries by the corresponding decline in China’s direct exports to the United States.
We prevented several countries from effectively claiming the same disappearing Chinese export flow, which would create double counting.
Finally, we imposed what seemed an indispensable condition: the product itself had to have been affected by the U.S. Section 301 tariff increase on China.
After all those constraints, the number falls dramatically and the $89.6 billion becomes about $18 billion. That is the figure with which we are much more comfortable.
It does not mean the White House figure is wrong because the two numbers answer different questions.
The White House’s $89.6 billion represents a broad universe of trade consistent with the rerouting pattern.
SOAPBOX $18 billion asks something more demanding: how much of that pattern survives after aggressively removing pre-existing trade, constraining the flows, limiting double counting and requiring actual Section 301 exposure?
There is an obvious reason for being cautious. Aggregate customs statistics can show that China lost U.S. market share in a product, that another country simultaneously bought more of that product from China and sold more of it to United States, and that the White House had imposed additional tariffs on that product.
What those statistics cannot tell us is what happened inside the factory. They cannot determine whether a Vietnamese, Mexican or Turkish producer carried out enough manufacturing to create a legitimate new origin. They cannot distinguish substantial transformation from minor processing, repackaging or relabelling.
For that reason, our $18 billion is an estimate of potential rerouting. Establishing fraud requires shipment-level records, company information, production capabilities, rules-of-origin analysis and ultimately customs enforcement evidence.
But something much more robust emerges when we stop asking how much and start asking where: the White House map barely changes.
Vietnam remains one of the clearest concentrations. Thailand, South Korea, India, Mexico, Malaysia and Türkiye remain prominent.
Jurisdictions identified by the White House account for about 93% of our much more conservative $18 billion estimate.
98.6% of our conservative signal falls in products actually hit by the U.S. tariff increase on China.
In other words, after trying quite hard to shrink the White House result, we managed to shrink the number enormously but we did not make the geography disappear.
The available trade data seem much better at telling us where potential rerouting is concentrated than at telling us exactly how much is being rerouted.
China is not incidental to the pattern because it is built into the test itself. We are looking specifically for products in which China loses direct U.S. market share while its exports of the same product to an intermediary rise and that intermediary simultaneously gains U.S. market share.
None of this proves a global transshipment scam but neither does the pattern disappear when subjected to much more sceptical assumptions. Our conclusion is the White House headline number becomes much smaller but the map survives.
Comments
Nothing yet. Say the first thing.
Sign in to join the conversation.