
There are weeks where the market hands you a clean trend and asks nothing of you but patience. And then there are weeks like the one we’re walking into now, where price has done exactly what it needed to do to get interesting — it’s arrived at a decision point, and it’s making everyone wait to see which way it leans.
Let’s start with where we’ve been, because the last two weeks explain exactly why this moment matters.
Both ES and NQ spent the back half of July doing something that looked, in the moment, like the start of real trouble. NQ broke down hard, eventually flushing all the way into the 27,184 area, while ES followed a similar script, dropping into the low 7,330s. These weren’t gentle pullbacks. They were fast, aggressive moves that cleared out a lot of weak positioning in a hurry — the kind of flush that makes developing traders assume the trend has flipped, right before it usually hasn’t.
What happened next is the part that actually mattered. Buyers didn’t sit on their hands at those lows. The rally off both bottoms was immediate and persistent, and importantly, it wasn’t a one-and-done bounce — it was a grind, with dips along the way getting bought rather than sold. That’s a different kind of strength than a sharp relief rally. A relief rally exhausts itself quickly. A grind that keeps absorbing pullbacks is telling you buyers are still in control of the tape, not just reacting to an oversold reading.
That rally carried both markets right back into resistance zones that had already proven themselves once before — NQ into the 28,730 area, ES into the 7,542-7,549 zone that had capped price back on July 22nd and 23rd. Markets rarely forget a level that’s already turned them once, and this was no exception. Both indices ran into that supply and paused.
If ES has felt harder to read than usual over the last couple of weeks, there’s a structural reason for that, and it’s worth understanding rather than just feeling frustrated by it.
Zoom out on ES and you’ll notice the market isn’t really trending through this whole period so much as it’s rotating through a stack of four ranges. The top box runs from 7,560 up to 7,640. Below that sits a second box from 7,480 to 7,560. Below that is a third box from 7,420 to 7,480 — and this one is noticeably tighter than the others, only around sixty points wide compared to the roughly eighty-to-hundred point ranges above and below it. Beneath everything sits a fourth box stretching from 7,320 down to 7,420.
That compressed third box is the reason price tends to get congested and choppy whenever it’s rotating through the second and third ranges. Less room inside a box means less room for a trade to breathe, which means more false breaks and more whipsaw before the market actually commits. If ES has felt like it was working against you lately rather than with you, that narrower structure is a real part of why — it’s not that your read was wrong, it’s that the range itself gave you less to work with.
Friday’s close landed around 7,502, putting ES roughly in the middle of that second box. And that’s exactly where the story picks up when the new week opens
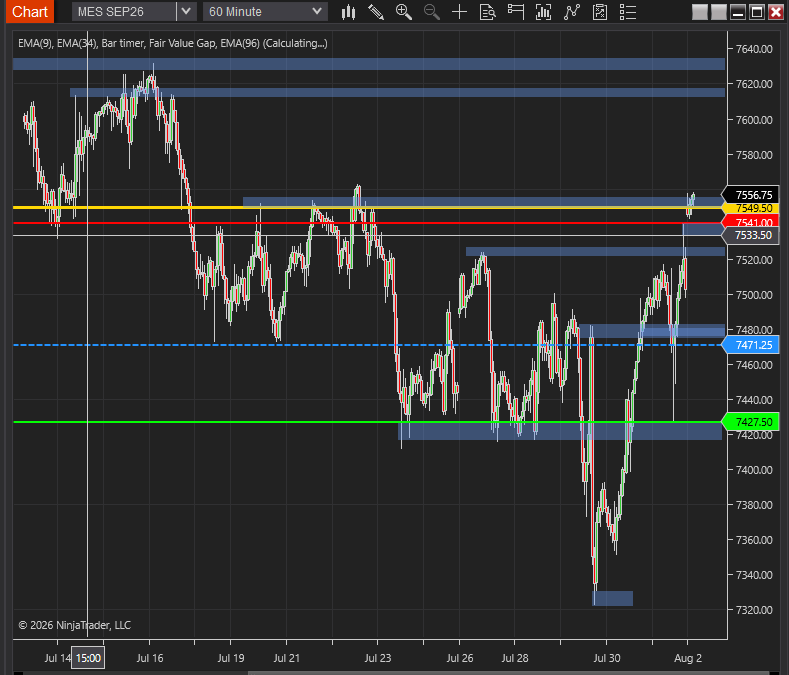
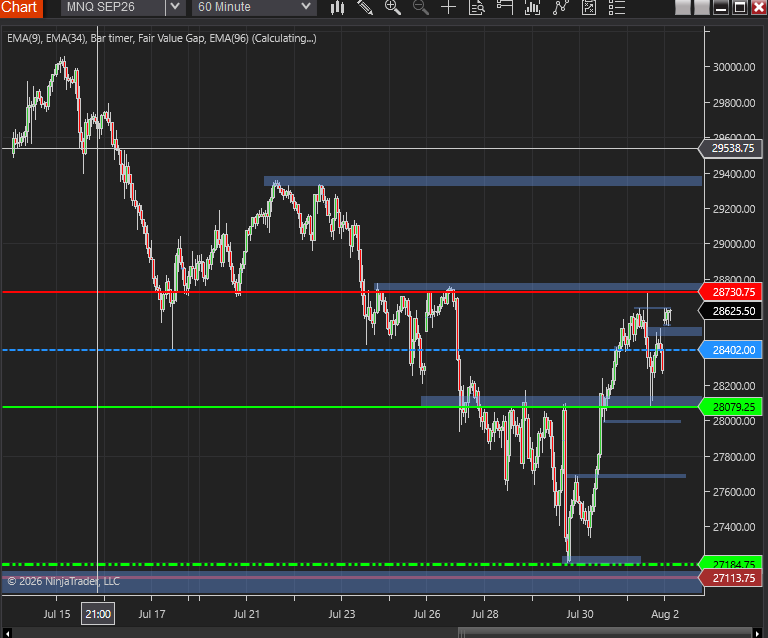
Markets opened Sunday evening at 6pm, and both ES and NQ gapped up right out of the gate — which is exactly one of the scenarios we’d flagged as worth watching for. Since the open, both have settled into a tight consolidation, and where each one is sitting relative to the levels we’d already mapped out tells two slightly different stories.
ES opened almost precisely on the key zone we’d identified, not above it and not below it — just parked directly on the level in a tight coil. NQ did something a little different. It gapped up just above its own previous high and has been stuck consolidating right at that level ever since. Neither market has resolved yet. A few hours into the session, this has looked more like absorption than decision — price sitting at a level and digesting it rather than pushing through or rejecting it outright.
Pulling back to the daily chart adds some useful context to what we’re watching this week. ES opened above its 50-day SMA, which is a constructive sign on the bigger picture — it’s holding above a level that’s acted as dynamic support through this entire advance. NQ is in a different spot. It’s attempting to reclaim the 29,000 level on the daily chart, but it’s still trading below its 150-day SMA, which currently sits up near 29,655 while NQ itself trades closer to 28,620. That’s a meaningful gap between where price is and where that longer-term average sits, and it tells us NQ still has real overhead to work through even though its immediate momentum has been pointing up.
Overall momentum remains up on both indices coming into the week. But momentum alone doesn’t answer the question that actually matters right now, which is whether that momentum has enough behind it to push both markets through resistance and into new highs, or whether this is the pause where the market reconsiders, rejects the highs, and rotates back down to retest last week’s lows.
Specifically, for NQ, the levels to watch are straightforward. A gap up and acceptance above 28,730 opens the door to the next leg higher. A failure to hold that level sends price back toward 28,402, the pivot that’s been the fulcrum of the whole range, with 28,079 as the deeper level if sellers take more control than expected.
On ES, the same logic applies around 7,549. Acceptance above it keeps continuation on the table. Rejection there puts 7,471 back in focus as the first real test, with 7,427 underneath as the deeper support if the pullback has more room to run. And within the box structure, a genuine breakout above 7,560 would mark the shift into the next range entirely — something worth watching for on its own, separate from the shorter-term reaction levels.
None of this is a prediction, and it shouldn’t be treated like one. It’s a map of the doors the market can walk through from here, and price itself is going to tell us which one it chooses. That’s really the whole discipline in a moment like this — not guessing at the outcome, but knowing exactly what each outcome would look like so you’re not scrambling to figure it out after the fact.
A tight range sitting right on a key level isn’t indecision for its own sake — it’s the market doing its work before it commits. The temptation here is to jump ahead of that work, to decide which way it’s going to break and start positioning for it. That’s usually where trouble starts. The better approach is to let the range resolve, let acceptance or rejection show itself at the level, and then align with whatever the market has actually decided rather than what you assumed it would decide.
Trade what is happening, not what you think should happen. The levels are set. Now we watch how price treats them.
This content is for educational purposes only and does not constitute financial advice. Trading futures involves substantial risk of loss and is not suitable for all investors.
If you’re still working on building more structure into how you read levels like this, or you’re trying to bring more consistency to a smaller account, I’ve been helping traders work through exactly that kind of framework. If you’re interested, check the link below — or just reply and I’ll walk you through it.
📊 Follow along in real time on X: Shawn | Day Trading Mentor
www.TheSmartTraders.com
Comments
Nothing yet. Say the first thing.
Sign in to join the conversation.