

Inflation came in better than expected. Oil stalled, consumer data suggested a slowing in spending behavior is under way. Last week, the employment numbers suggested the jobs picture may be getting worse.
Stocks made new highs. And the bond market sold off raising market interest rates.
Normally, you’d expect stable oil, a weakening consumer and jobs market, flat oil prices, and better than expected inflation to trigger lower bond yields. But that’s not what we saw.
As they say in the world of slang: “that’s messed up.”
All of which leads to the conclusion that either somebody is selling bonds regardless of what the economic data shows or that there is so much money sloshing around in the system that bond traders are a bit skittish about monetary inflation being rekindled.
Maybe it’s both.
Certainly recent data suggests that Japan, the largest holder of U.S. treasuries is leading the way in treasury as they try to protect their currency and sell U.S. treasuries to finance their Yen purchases.
But in the current world, it could be just about any central bank or other mega entity which is quietly trying to protect its currency or is concerned about the U.S. economy and growing fiscal deficits.
What’s most important from a market standpoint is that someone with lots of bonds is selling them.
Moreover, they sell every time bond yields dip, which means they’re astute as selling on yield dips gets them a better (more profitable) exit point.
Oh boy!
Tales from the Road
I’m on the road this week and what I’m seeing isn’t quite what the government numbers are suggesting. What I’m seeing is more akin to what the market is saying.
The airports and the airplanes are full. Construction in roads, buildings, and everything in between is moving steadily along.
That’s fiscal stimulus. That’s real world liquidity at work.
The hotel where I’m staying is full, with buses parked outside bringing in the crowds.
I went to a Texas Roadhouse restaurant and had to wait in line for an early dinner. The place was packed. And nobody was ordering the dieter’s plate or holding back on the libations.
Incidentally, the tater skins are exceptional.
While munching on mine I saw plenty of families with kids and grandmas and grandpas just chowing down on big burgers, ribeyes (bone in and bone out) and other large cuts which don’t exactly have small sticker prices.
The brews and the umbrella drinks were flowing too.
And here’s the thing, compared to prior trips to the same area (located in the Midwest U.S., where I escape the Texas heat in August), nobody looked worried.
Clearly these are not statistically backed or statistically significant findings. These are just observations, which may point to a regional phenomenon. But then this area is not a resort town. It’s a quiet working class place with a classic Midwest industrial economy.
That maybe the steadily rising 401 (k) plan talking.
The Double Grind
All of which brings raises the question. Where is the data that says the U.S. economy is slowing down coming from?
Maybe Warsh’s “outside expert” work groups will figure it out.
Maybe they can break things down a little more usefully, say regionally or on a state by state basis.
Maybe they can use real time data like Walmart, Google, Costco and Amazon. I’m sure American Express, Visa and Master Card will be glad to sell the Fed and the U.S. government purchase by purchase data - you know so they can compute economic data as it happens.
I mean these cats attach cookies to your browser and track your cell phone as you walk through their stores, so they know what to pitch you with the highest chance of getting you to buy it.
Maybe the Fed can join the 21st century. Maybe they can get a Poly Market analyst on the FOMC.
Right?
One more thing. When stock prices rise and bond yields rise simultaneously, it’s often a sign that there’s too much money floating around (like when the Fed is quietly buying $40 billion of U.S. T-bills per month through its RMP program).
If that’s the case, then we’re in a double grind scenario where we can expect to see the stock market and bond yields continue to grind higher together as double barrel liquidity (fiscal stimulus and cheap margin money in the Repo system) team up.
This is o.k. as long as the double grind is equitable. On the other hand, if bond yields take the lead in moving higher, things aren’t likely to end well for stocks, or for the economy.
Stick with your Trading Rules
Trading Rules matter in all trading environments, especially uncertain ones. Here are mine:
Rule #1 - Don’t fight the Fed (and liquidity) – liquidity is currently stable – watch the bond market and how stocks respond.
Rule #2 - Don’t fight the market’s momentum – Momentum is pointing generally higher.
Rule #3 - Stay alert for important market changes – When the dip buyers don’t appear, it’s likely a signal that liquidity is drying up.
Rule # 4 – Adapt accordingly – if a stock you own remains in good shape hold it. If it hits the Sell stop, move on.
Disclaimer: The Smart Money Passport and Joe’s Weekend Portfolio offer market analysis and opinion not financial advice.
Sentiment Summary – Stock Sentiment Leans Bullish.
The CNN Greed/Fear Index (GFI) closed at 65 on 8/14/26. This is a Greed Reading which means investors should be wary of increasing volatility. Excessive Greed often precedes a market top.
The Coinmarketcap.com Crypto Greed/Fear was at 36 on Friday evening– this is still a bullish reading.
The CBOE Composite Put/Call Ratio is at 0.82. The index P/C ratio closed at 0.99. Options sentiment is neutral.
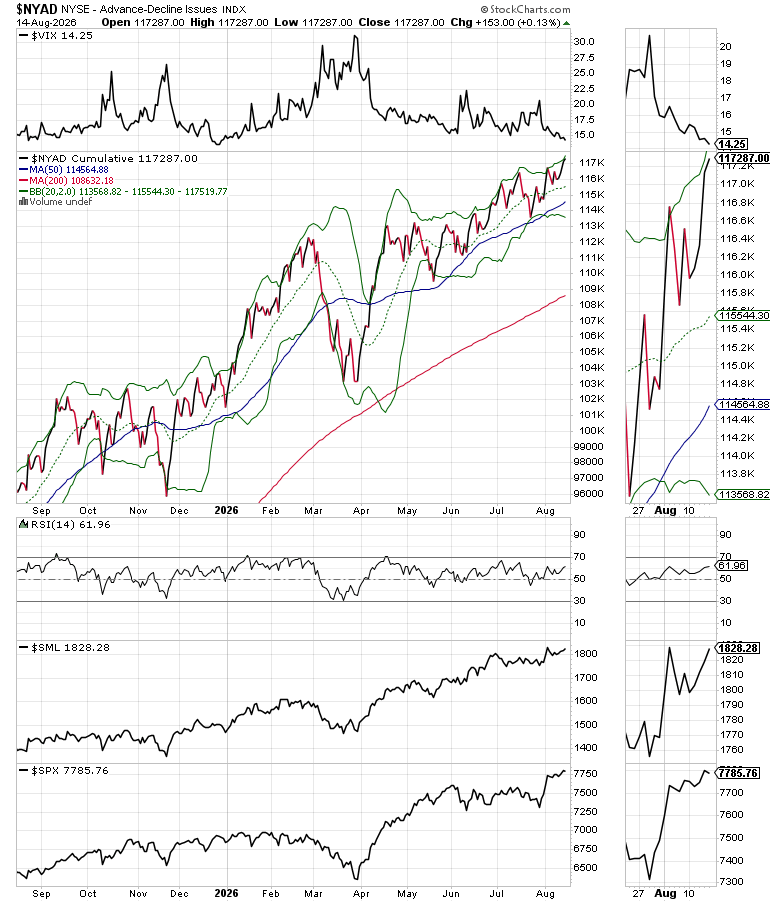
The CBOE Volatility Index (VIX) closed at 14.25. This is a low neutral level bordering on excessive bullishness. VIX rises when traders buy large volumes of put options. A rise in put option volume leads market makers to sell stock index futures to hedge their risk and leads markets lower. A fall in VIX is bullish signaling lower put option volume, eventually leads to call buying which is bullish as it causes market makers to buy stock index futures raising the odds of higher stock prices.
The Tradition Continues - The Fifth Editions of “Options Trading for Dummies. #1 Best Seller in Options Trading New Releases –
Liquidity Watch – Liquidity is Stable.
The latest reading of the Fed’s National Financial Conditions Index (NFCI) (8/7/26) was -0.55 (This means liquidity is stable but not growing). Declining NFCI reading are bullish. Negative NFCI readings signify adequate liquidity.
Caution: Bond Yields Remain in Bearish Trend
Yields on U.S. Treasury bonds rose on 8/14/26 despite lower inflation and slowing retail sales.
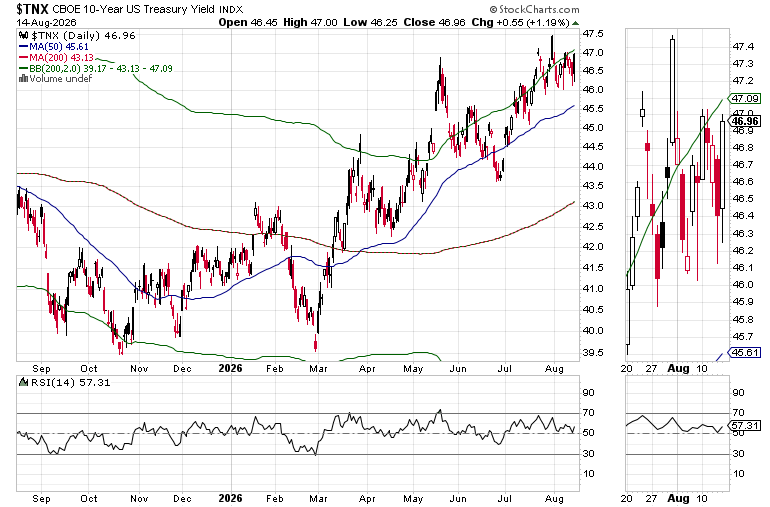
The U.S. Ten Year Note yield (TNX) ended just below 4.7% continuing to trace a bearish higher high, higher low pattern above its 50-day moving average which has crossed above the 200-day moving average signaling that the tendency toward higher yields is nearly fully adopted in the markets.
NYAD, SML, and SPX Make New Highs.
The New York Stock Exchange Advance Decline line (NYAD) is above its 20 and 50-day moving averages and delivered new highs on 8/13 and 8/14. For now, the trend in stocks remains up. Small stocks and SPX confirmed.
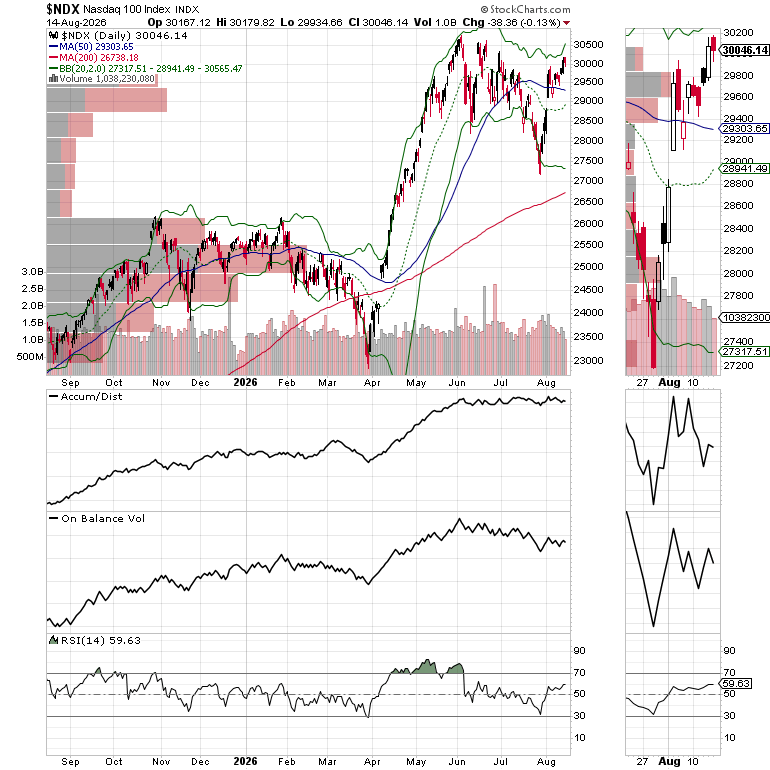
The Nasdaq 100 Index (NDX) closed the week just above 30,000. Let’s see what happens next
The S&P 500 (SPX, above) made a new high last week but could not close above 7800.
The S&P Small Cap 600 Index (SML, above) made a new high.
Your Long Term Investing Plan is Here - “The Everything Guide to Investing in Your 20s & 30s” is right on the money. To get started on day trading, consider “Day Trading 101.” If you’re an active trader. Take good care of yourself. Visit my Health Page for smart, high quality products.

No posts
Comments
Nothing yet. Say the first thing.
Sign in to join the conversation.