
Visit our Dune dashboard on ParaSwap
https://dune.com/sixdegree/paraswap-insight
Following last year's FTX fiasco, there is a growing trend of people embracing decentralized exchanges (DEXs) due to their transparency and self-custody features.
Trading a large volume of tokens on a DEX is more cost-efficient compared to a CEX.
The sensitivity analysis examines the fee differences between swaps on Arbitrum and Binance. On Binance, the fees are fixed at 0.1% of the trade size. To illustrate, if you were to swap $20k worth of tokens on a DEX on Arbitrum, you would save $18 compared to trading on Binance(calculated as 0.1*$20k).
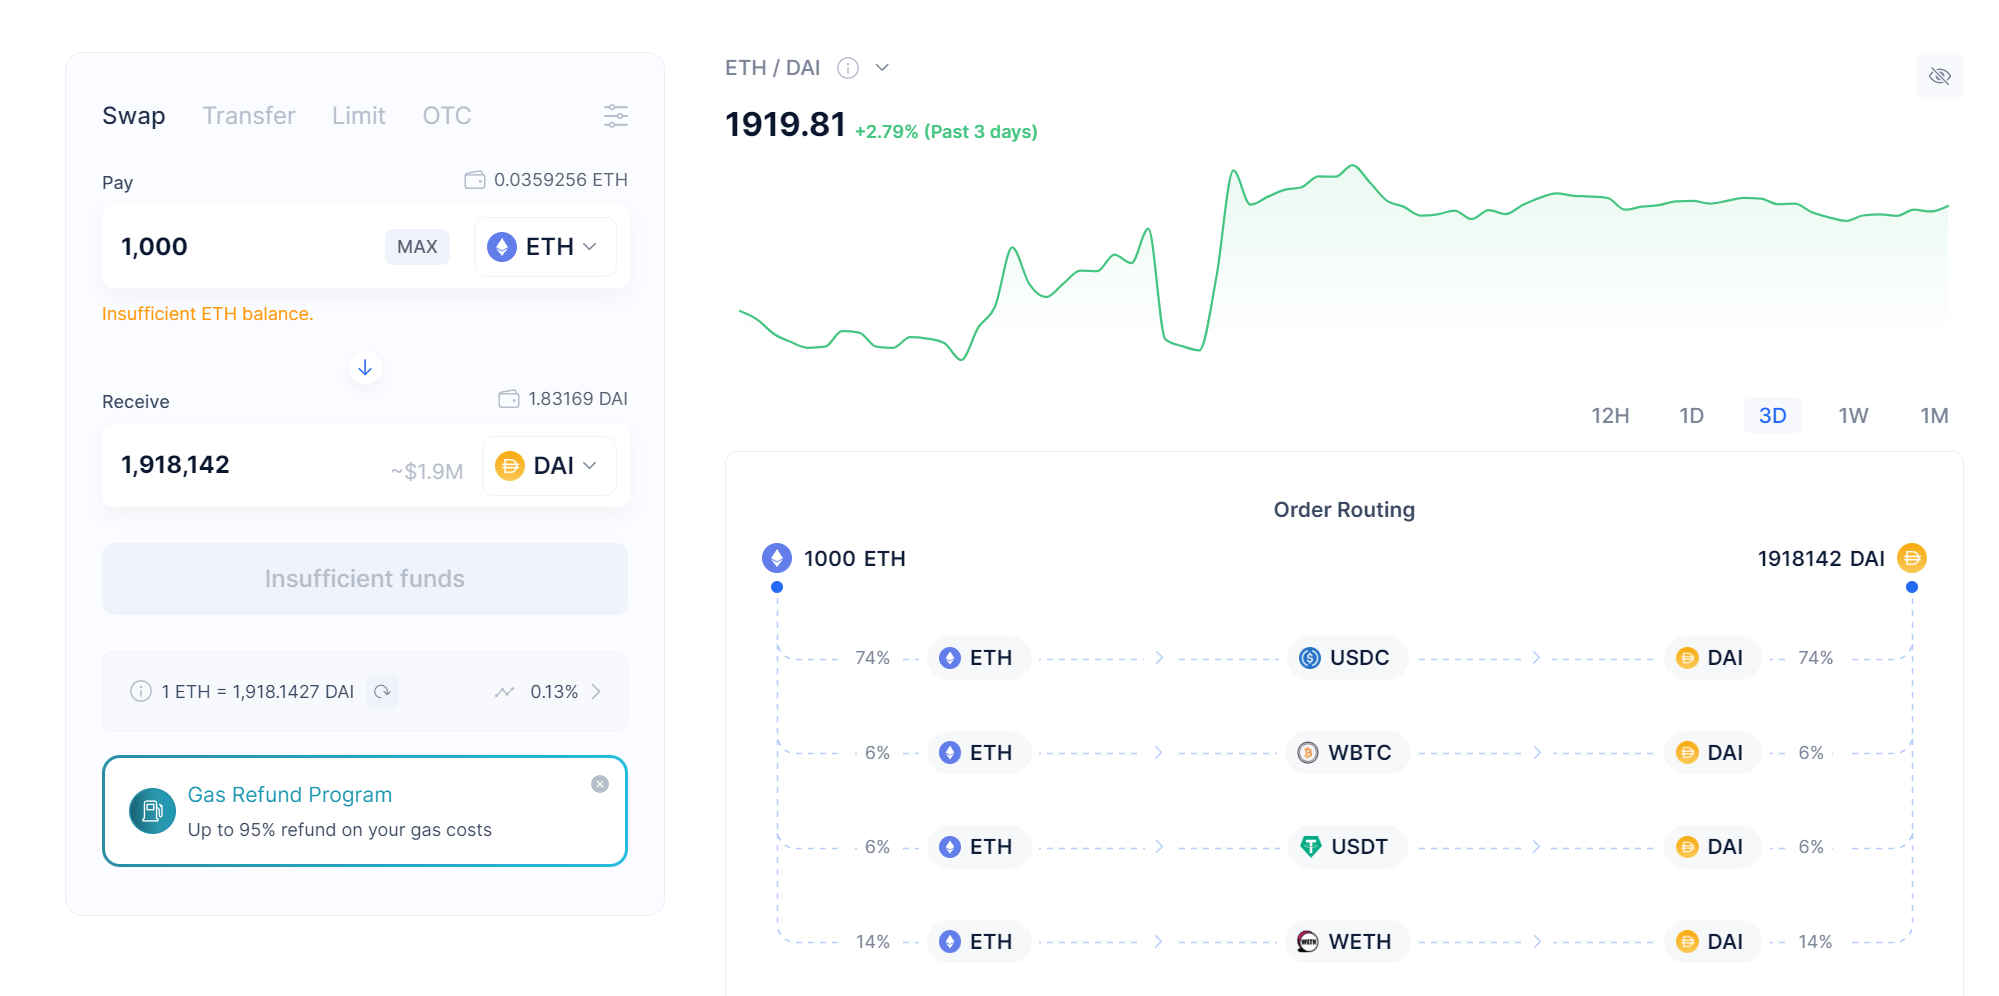
Trading huge amounts on a single DEX might result in significant slippage.
To tackle this issue, ParaSwap provides a solution by breaking down the order and executing it across multiple DEXs. This approach helps avoid substantial losses caused by slippage. The following is an example.
ParaSwap is a decentralized finance middleware and aggregator.
By curating decentralized exchanges and lending protocol pools into a single source, users can seamlessly exchange any assets seamlessly and get the best rates and liquidity.
With its V4 and V5, volume on ParaSwap surpassed $49 billion, with over 1.3 million total users swapping their assets more than 13.5 million times.
ParaSwap has been successfully deployed on seven blockchain mainnets, including Ethereum, Arbitrum, Polygon, Avalanche, Optimism, BNB, and Fantom.
So far, 9k+ whales have traded over $28B on ParaSwap.
Apparently, whales benefit most from ParaSwap as ParaSwap can minimize their loss due to the liquidity limits.
Retailers exhibit remarkable loyalty to the platform.
Retention rate is a valuable metric for assessing a project's user appeal. We conducted an analysis of ParaSwap's retention rates for both whales and retailers over a period of 12 months. Our findings reveal that retailers exhibit a remarkable loyalty to the platform, with an average retention rate of 24% after six months while whales display a retention rate of 14.3%.
If we dive into the aggregator section,
In terms of daily trading volume in the aggregator section:
1inch holds the majority share at 59%.
ParaSwap accounts for 19.4%.
0x captures 11.2%.
These percentages are based on the current data at the time of writing.
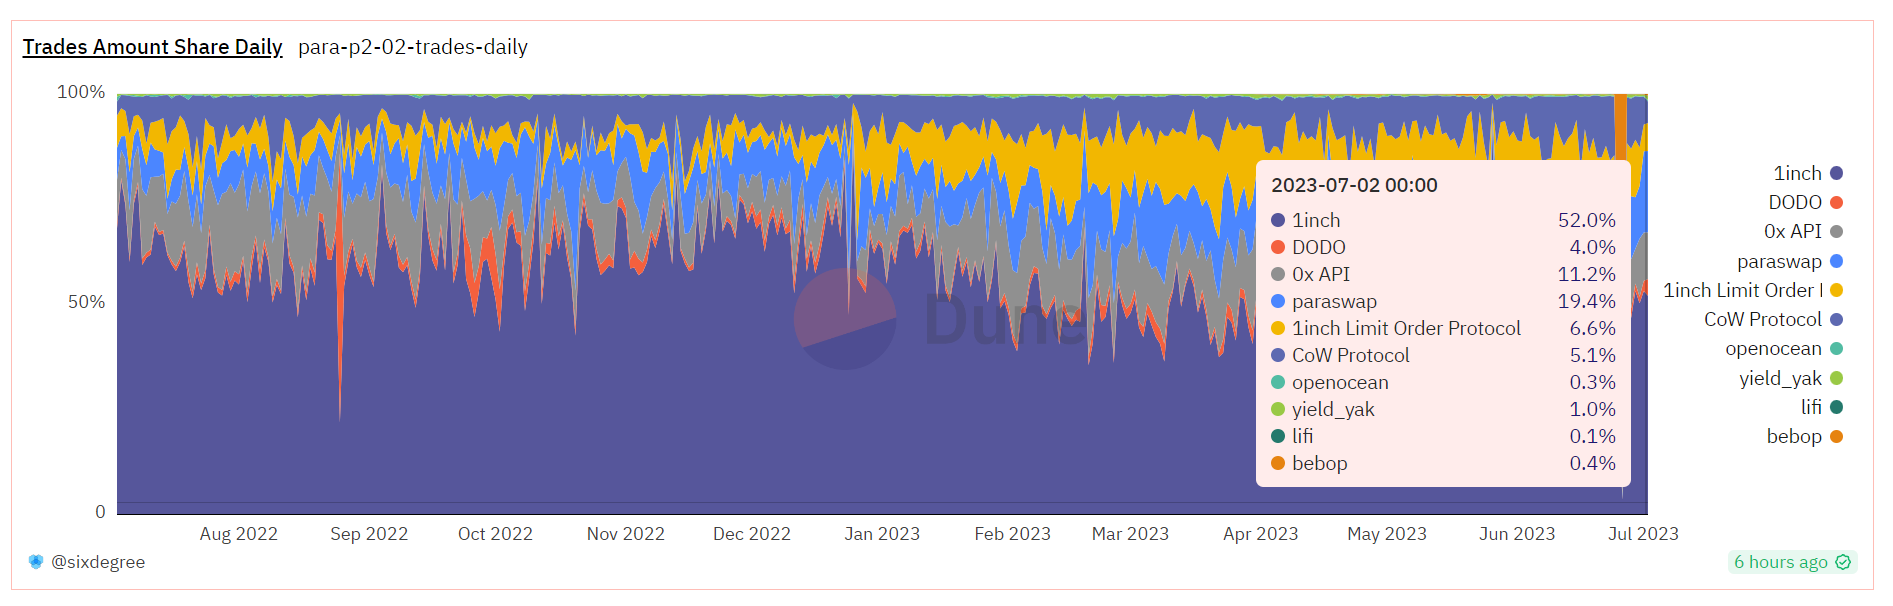
30-day moving average of trading volume for the top 4 aggregators:
1inch consistently holds over 60% market share.
ParaSwap recently secured second place with 14.4% market share.
0x is closely trailing behind ParaSwap with 12.9% market share.

Here is a breakdown of PSP 2.0 and its features:
PSP 2.0 is a significant update to the PSP tokenomics model.
It aims to reduce the emission of PSP tokens and provide incentives for users who add value and perform services on ParaSwap.
Users who contribute to the platform will be compensated with a portion of the protocol fees in the form of native gas tokens (like ETH).
In PSP 2.0, 80% of the protocol fees will be distributed to stakers, while the remaining 20% will go to the DAO treasury.
These fees come from all the chains where ParaSwap is deployed and will be distributed every epoch in the gas token of each network that supports staking.
So far, 840 users have claimed their PSP2.0 rewards, with a total of 344.13 $ETH distributed in the past 5 months. The average reward per user is around 0.41 ETH, which is a decent amount.
It's interesting to note that there is a whale who has locked $1m worth PSP-ETH LP and earned 137 ETH in 5 months. This translates to an impressive 62.4% APR!
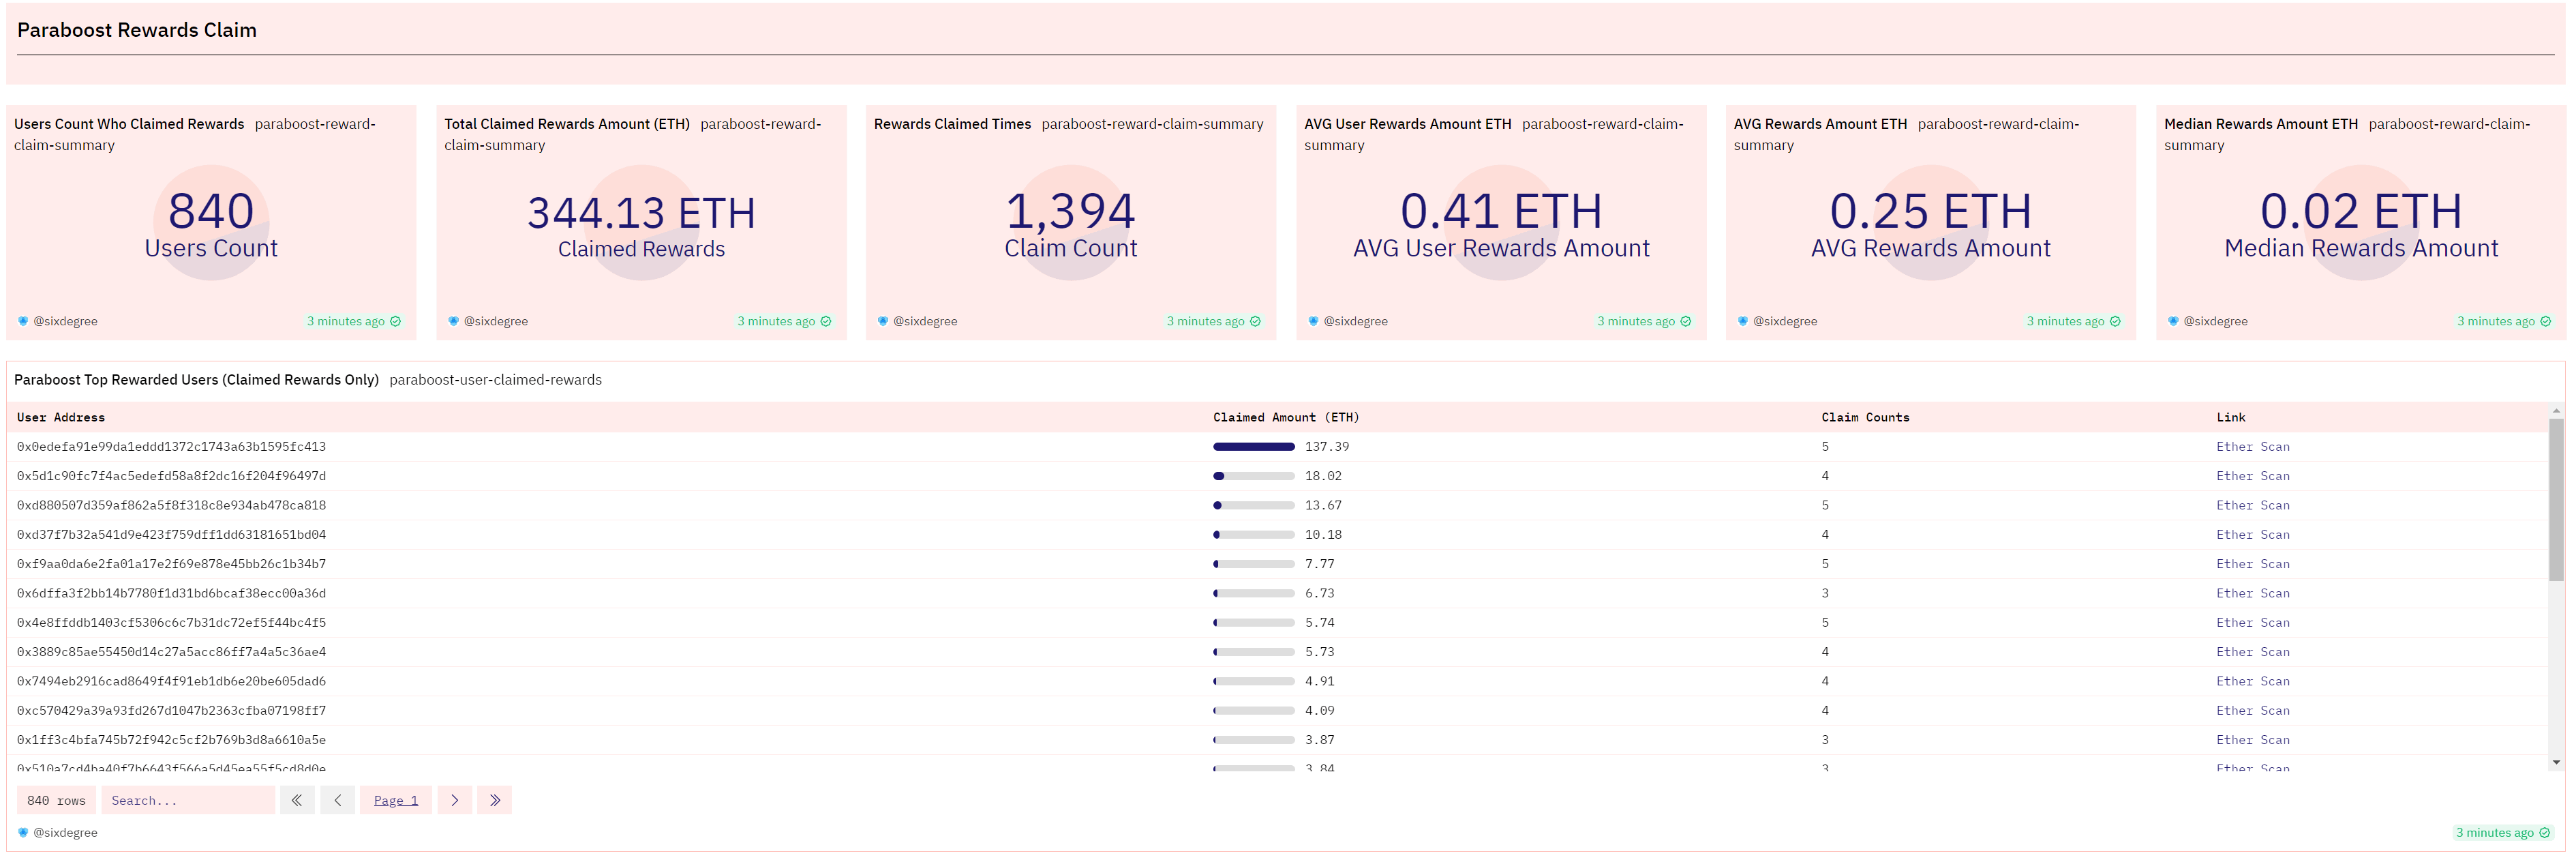
Since the rewards are reimbursed in ETH, it can indeed be seen as real yields. These numbers are surprising and indicate the potential for significant earnings through participating in PSP 2.0 and locking the PSP-ETH tokens.
Also check out great work from our friend at Decentralised.co! Payment Pipelines
No posts
Comments
Nothing yet. Say the first thing.
Sign in to join the conversation.