
Shanaka Anslem Perera | 15 August 2026
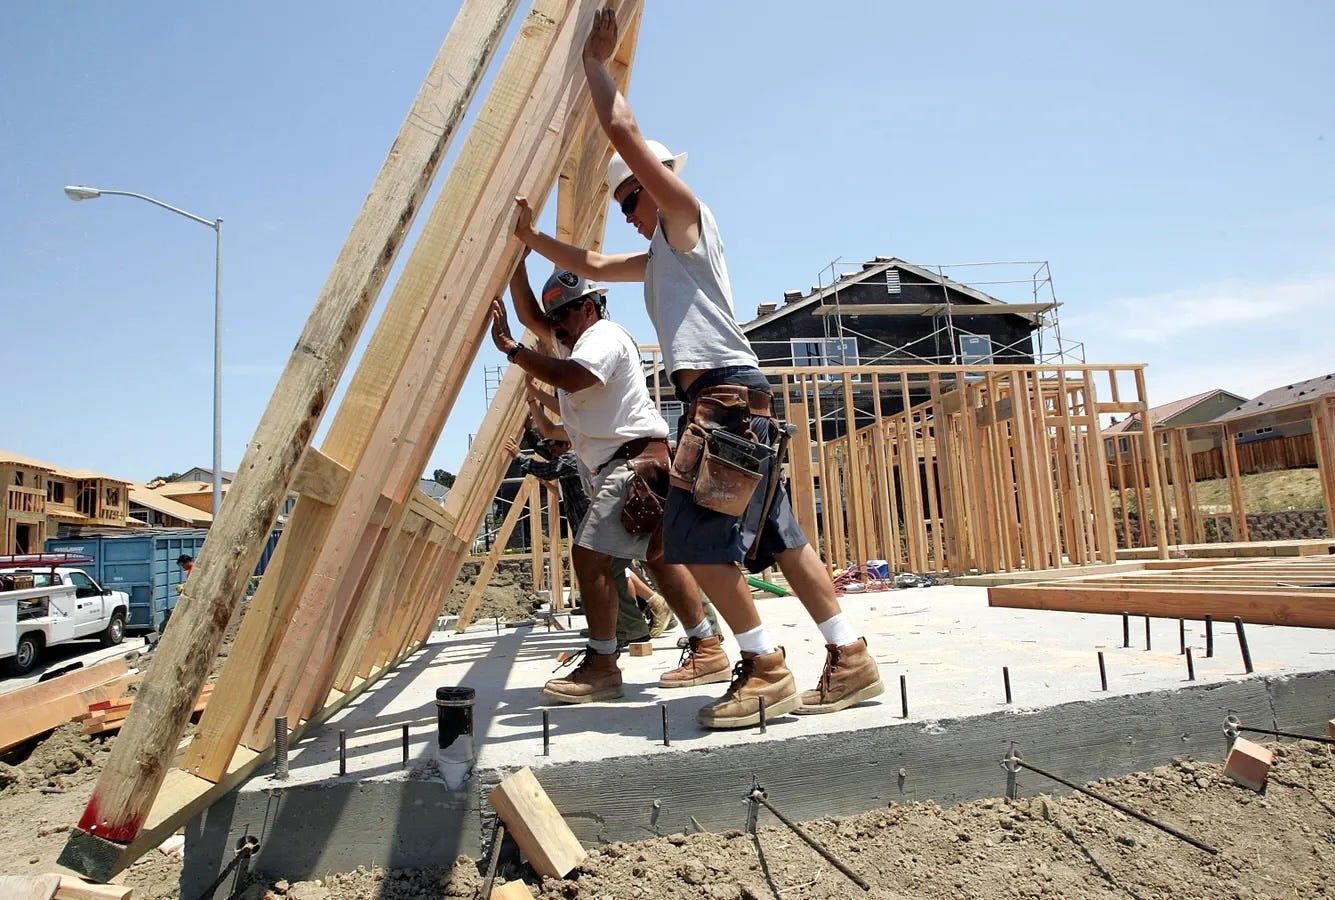
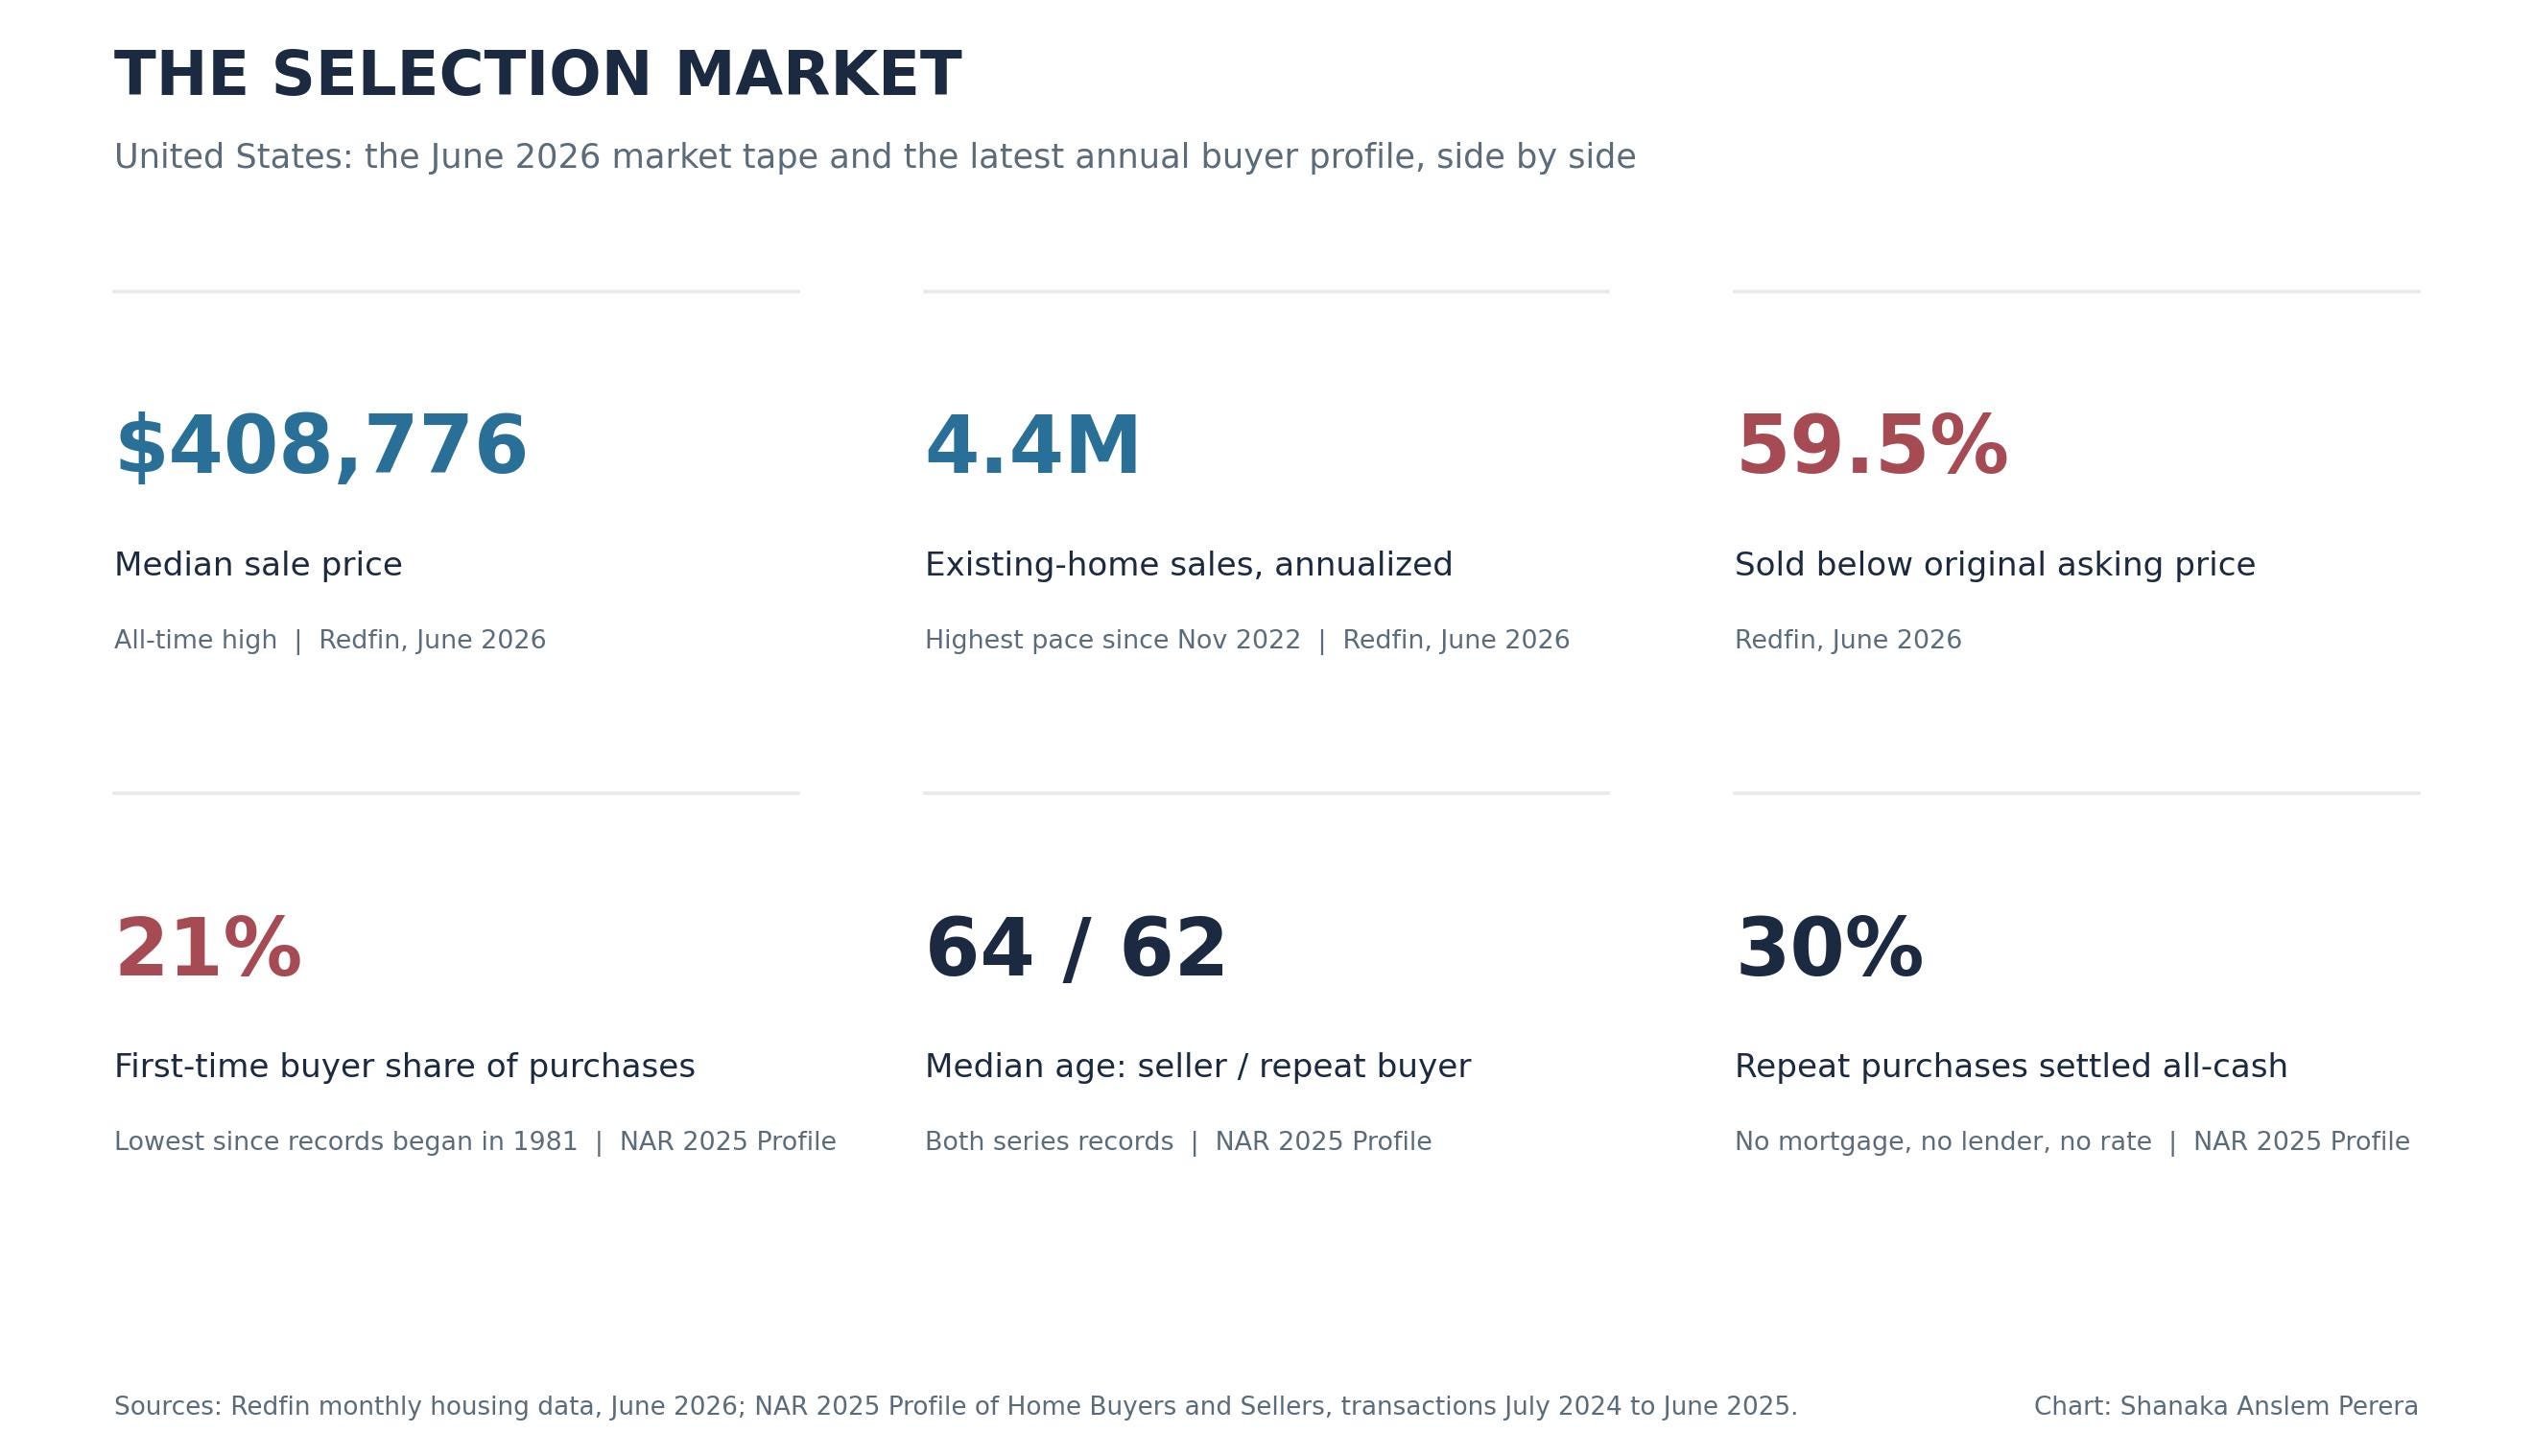
On 13th July, Redfin reported that the median US home sold for $408,776 in June, the highest figure in its national series. Its estimate of existing-home sales reached an annualized pace of roughly 4.4 million, the strongest since November 2022. Read alone, the early-summer tape looked like repair.
The rest of the dataset said otherwise.
Nearly 60 percent of homes sold below their original asking price. Only 22.2 percent sold above it. The average home cleared at 98.4 percent of its final asking price, while supply stayed under four months. The strongest gains were concentrated in affluent markets, and Redfin said many first-time and ordinary move-up buyers remained priced out.
The buyer profile sharpened the contradiction. The National Association of Realtors’ latest annual survey put first-time buyers at 21 percent of purchases, the lowest share in its series. Repeat buyers had a median age of 62. The median seller was 64. Thirty percent of repeat purchases were completed in cash. Only about one quarter of buyers had a child under eighteen at home, against 58 percent in 1985.
Then the forward tape weakened again. Mortgage rates rose for six consecutive weeks before easing slightly on 13th August to 6.67 percent. Purchase applications, refinancing activity, pending sales and new pending listings softened during the late-July rate spike. Active-listing growth stalled. Buyers and sellers stepped back together.
That is the mechanism.
Sellers resist moving because a sale can require surrendering a mortgage near 3 percent and replacing it with debt above 6 percent. Entrants confront payments, deposits, insurance and qualification rules that no longer fit the same income. Demand falls. Supply retreats with it. Turnover thins. The price remains firm because an index does not require a crowd. It requires one capitalized winner for each transaction.
This is not a normal recovery. It is not a 2008 replay. It is a selection market.
Housing research usually treats population, household formation, homeownership, transaction volume and prices as different readings of one system. They are separate ledgers joined by conversion gates. A country can lose people while adding households, add households while losing first-time owners, and lose first-time owners while prices hold. Homes can get cheaper through distress while births keep falling. Mortgage payments can stay protected while the borrowers holding them cannot move.
The correct object is the household option set: the rights and constraints that determine whether a person can establish, finance, move, enlarge and retain an independent household.
Below the line, the system comes apart in that order: four ledgers that most models compress into one, then the Danish mortgage right that strips most of the American lock-in mechanism out of a fixed-payment loan, then the causal research that keeps finding fertility effects inside housing wealth, mortgage cash flow and origination access. The countries that break every easy version of the thesis each get their full force. Parental capital, inherited equity and retirement withdrawals are followed into the first rung. The final sections turn to the Australian reform beginning on 1 July 2027 and to the portfolios exposed to transaction failure even when the national price holds.
The article closes with dated tests that can kill the thesis.
The base case is not an imminent national housing crash.
That is what makes the risk harder to see.
Comments
Nothing yet. Say the first thing.
Sign in to join the conversation.