
Each week, I’ll publish a recap breaking down the key valuation metrics across the SaaS sector, highlighting where growth, efficiency, and market expectations intersect.
Forward EV/Sales vs. NTM Estimated Revenue Growth (current and historical chart), including the top 10 fastest-growing SaaS companies
Forward EV/Gross Profit vs. NTM Revenue Growth
PSG (Price/Sales/Growth) — current and historical chart
Forward P/E vs. NTM Revenue Growth
Rule of 40
Rule of 40 vs. Forward EV/S Multiple
Pricing models (Seat-Based vs. Consumption and other Subscription models)
Dilution (SBC/Revenue and Outstanding share growth)
SaaS companies are typically valued by comparing EV/Sales multiple to projected NTM (next twelve months) revenue growth. Forward revenue expectations give investors a view of the company’s future potential performance.
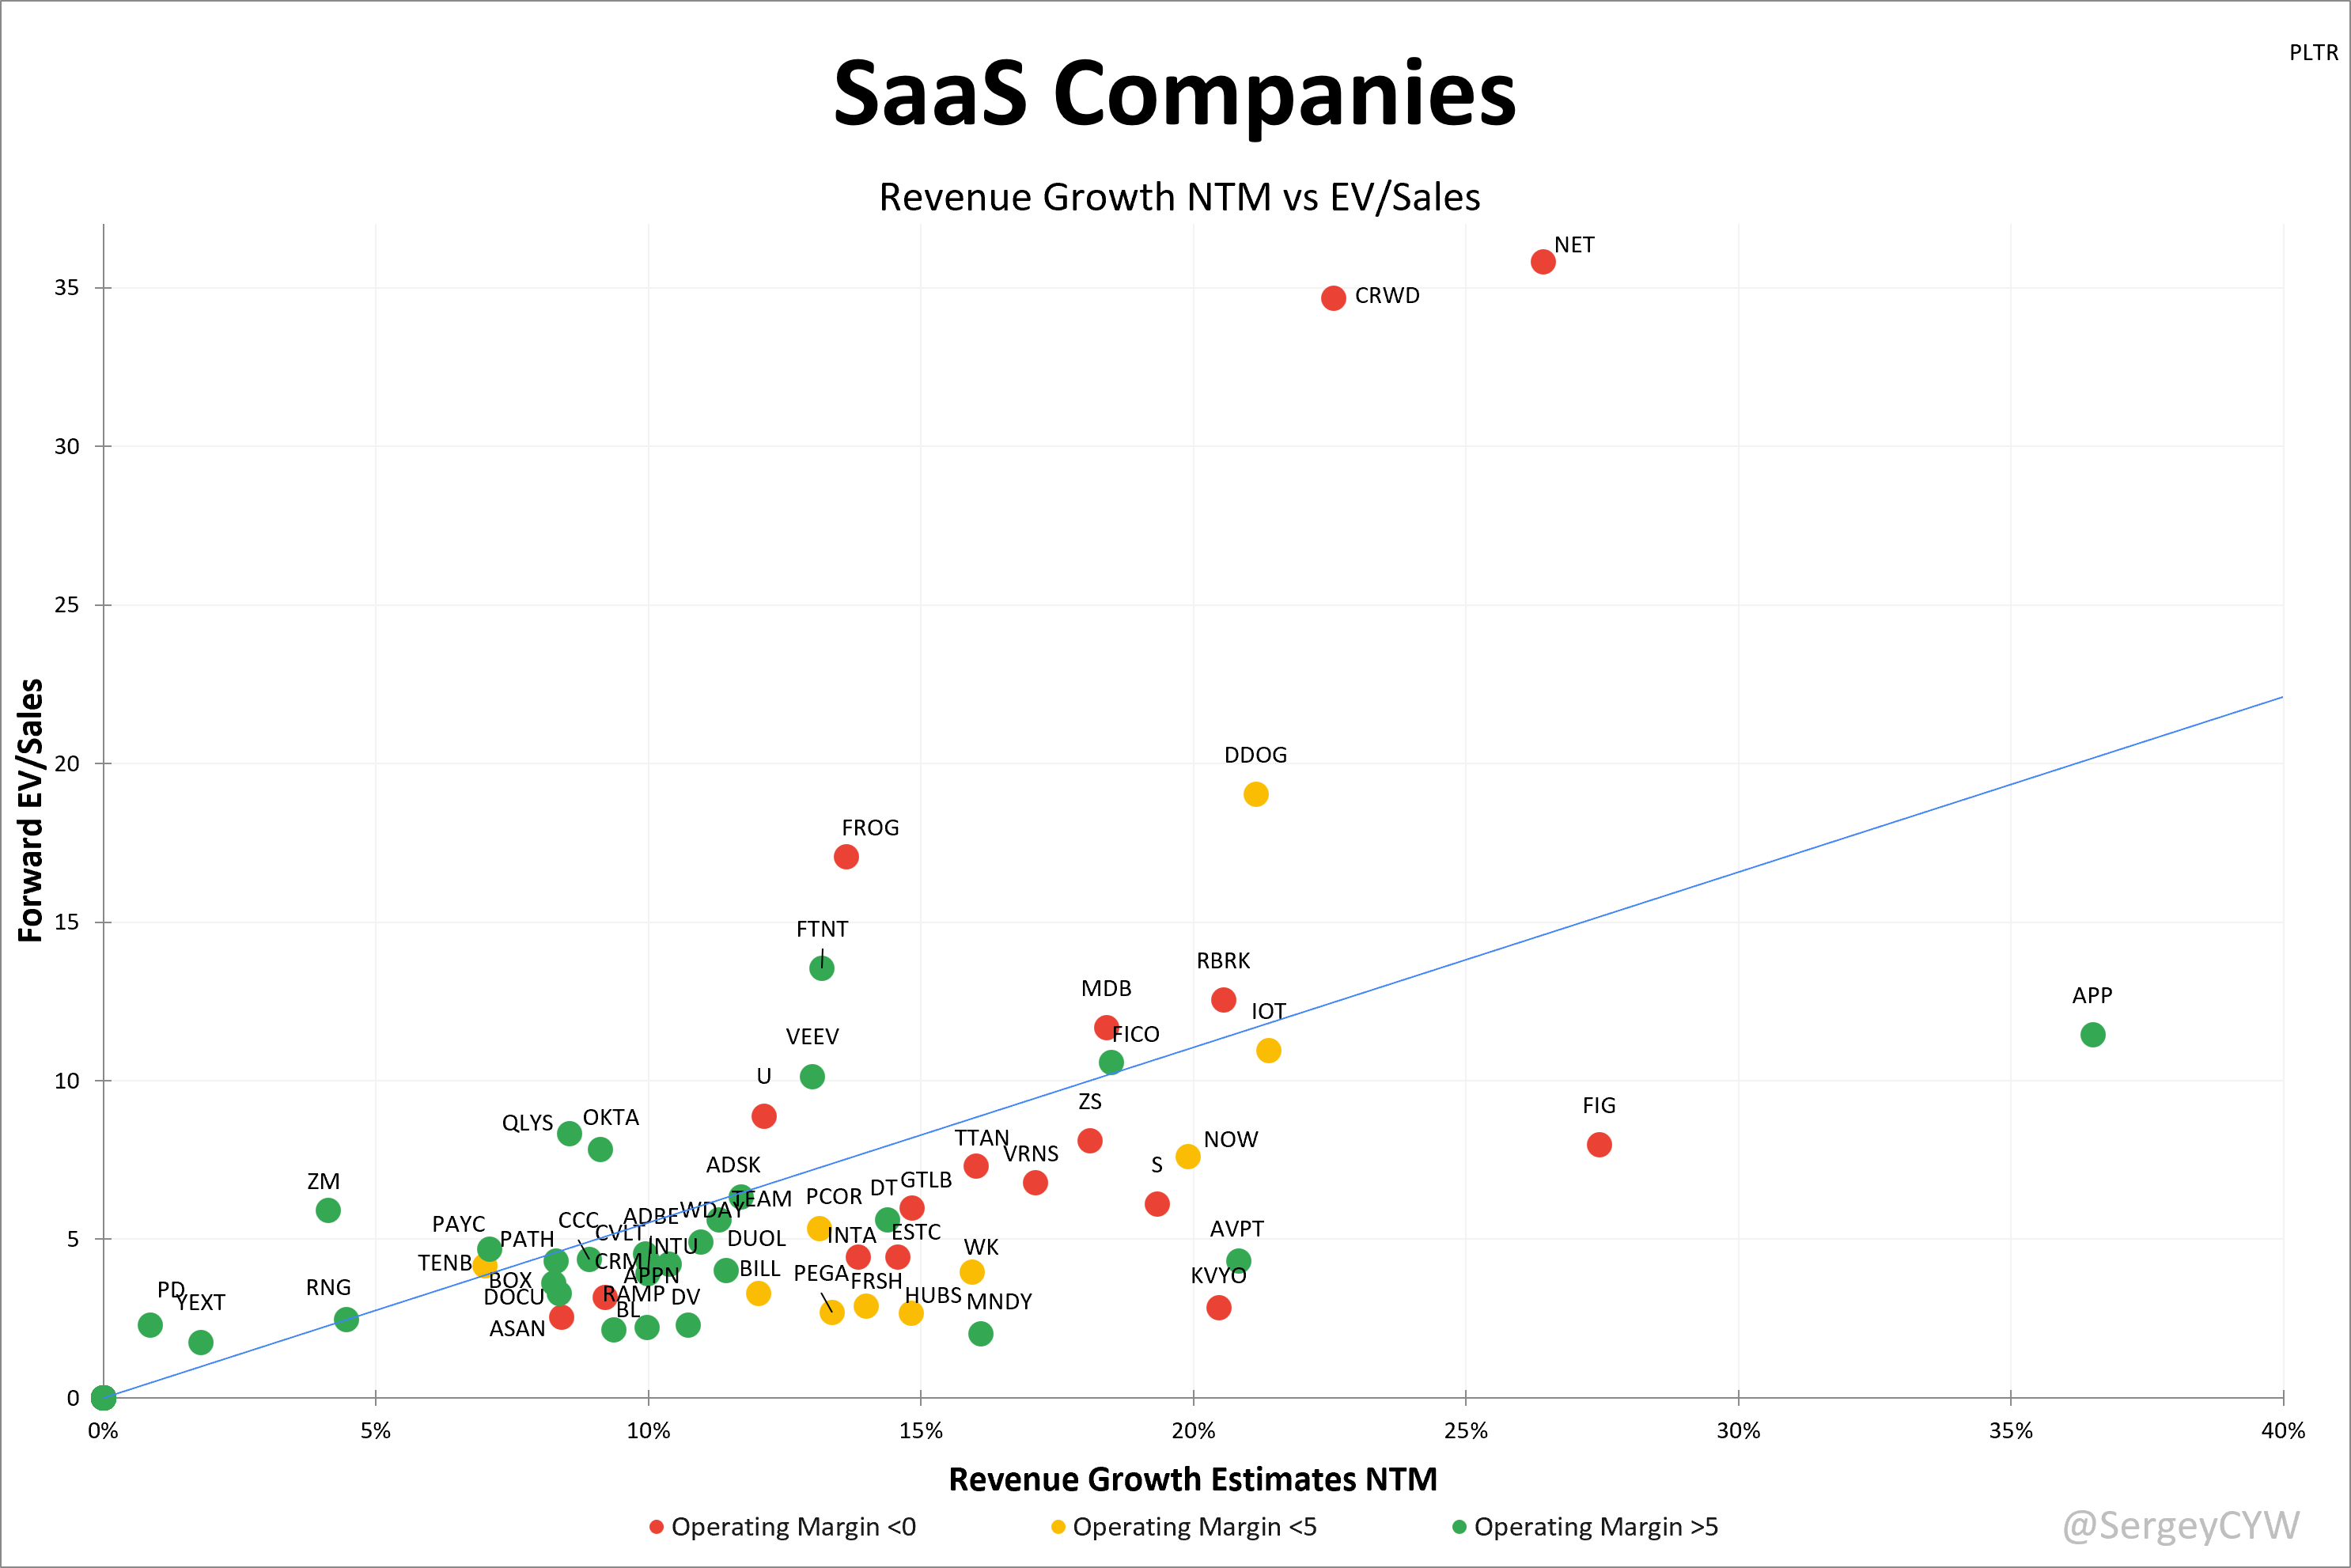
Note: For readability, PLTR was excluded, it trades at Forward EV/Sales of 41.2 and +63.9% estimated Growth Rate. The chart includes SaaS software companies with an EV above $1B and Gross Margins >70%.
To provide deeper valuation context, I also include Operating Margin across the EV/Sales, EV/Gross Profit, and Rule of 40 charts. Operating profitability directly influences valuation, companies with positive margins deserve higher multiples than companies operating at a loss.
On the charts:
Red: Negative operating margin
Yellow: Operating margin below 5%
Green: Operating margin above 5%
In this case, I used the GAAP Operating Margin from the recent quarter. This highlights the latest trends and helps identify companies that have recently achieved operating profitability. However, for seasonal businesses, this data can be distorted.
The median EV/Sales for SaaS companies stands at 4.62, with analyst estimates NTM revenue growth of 13.3% YoY.
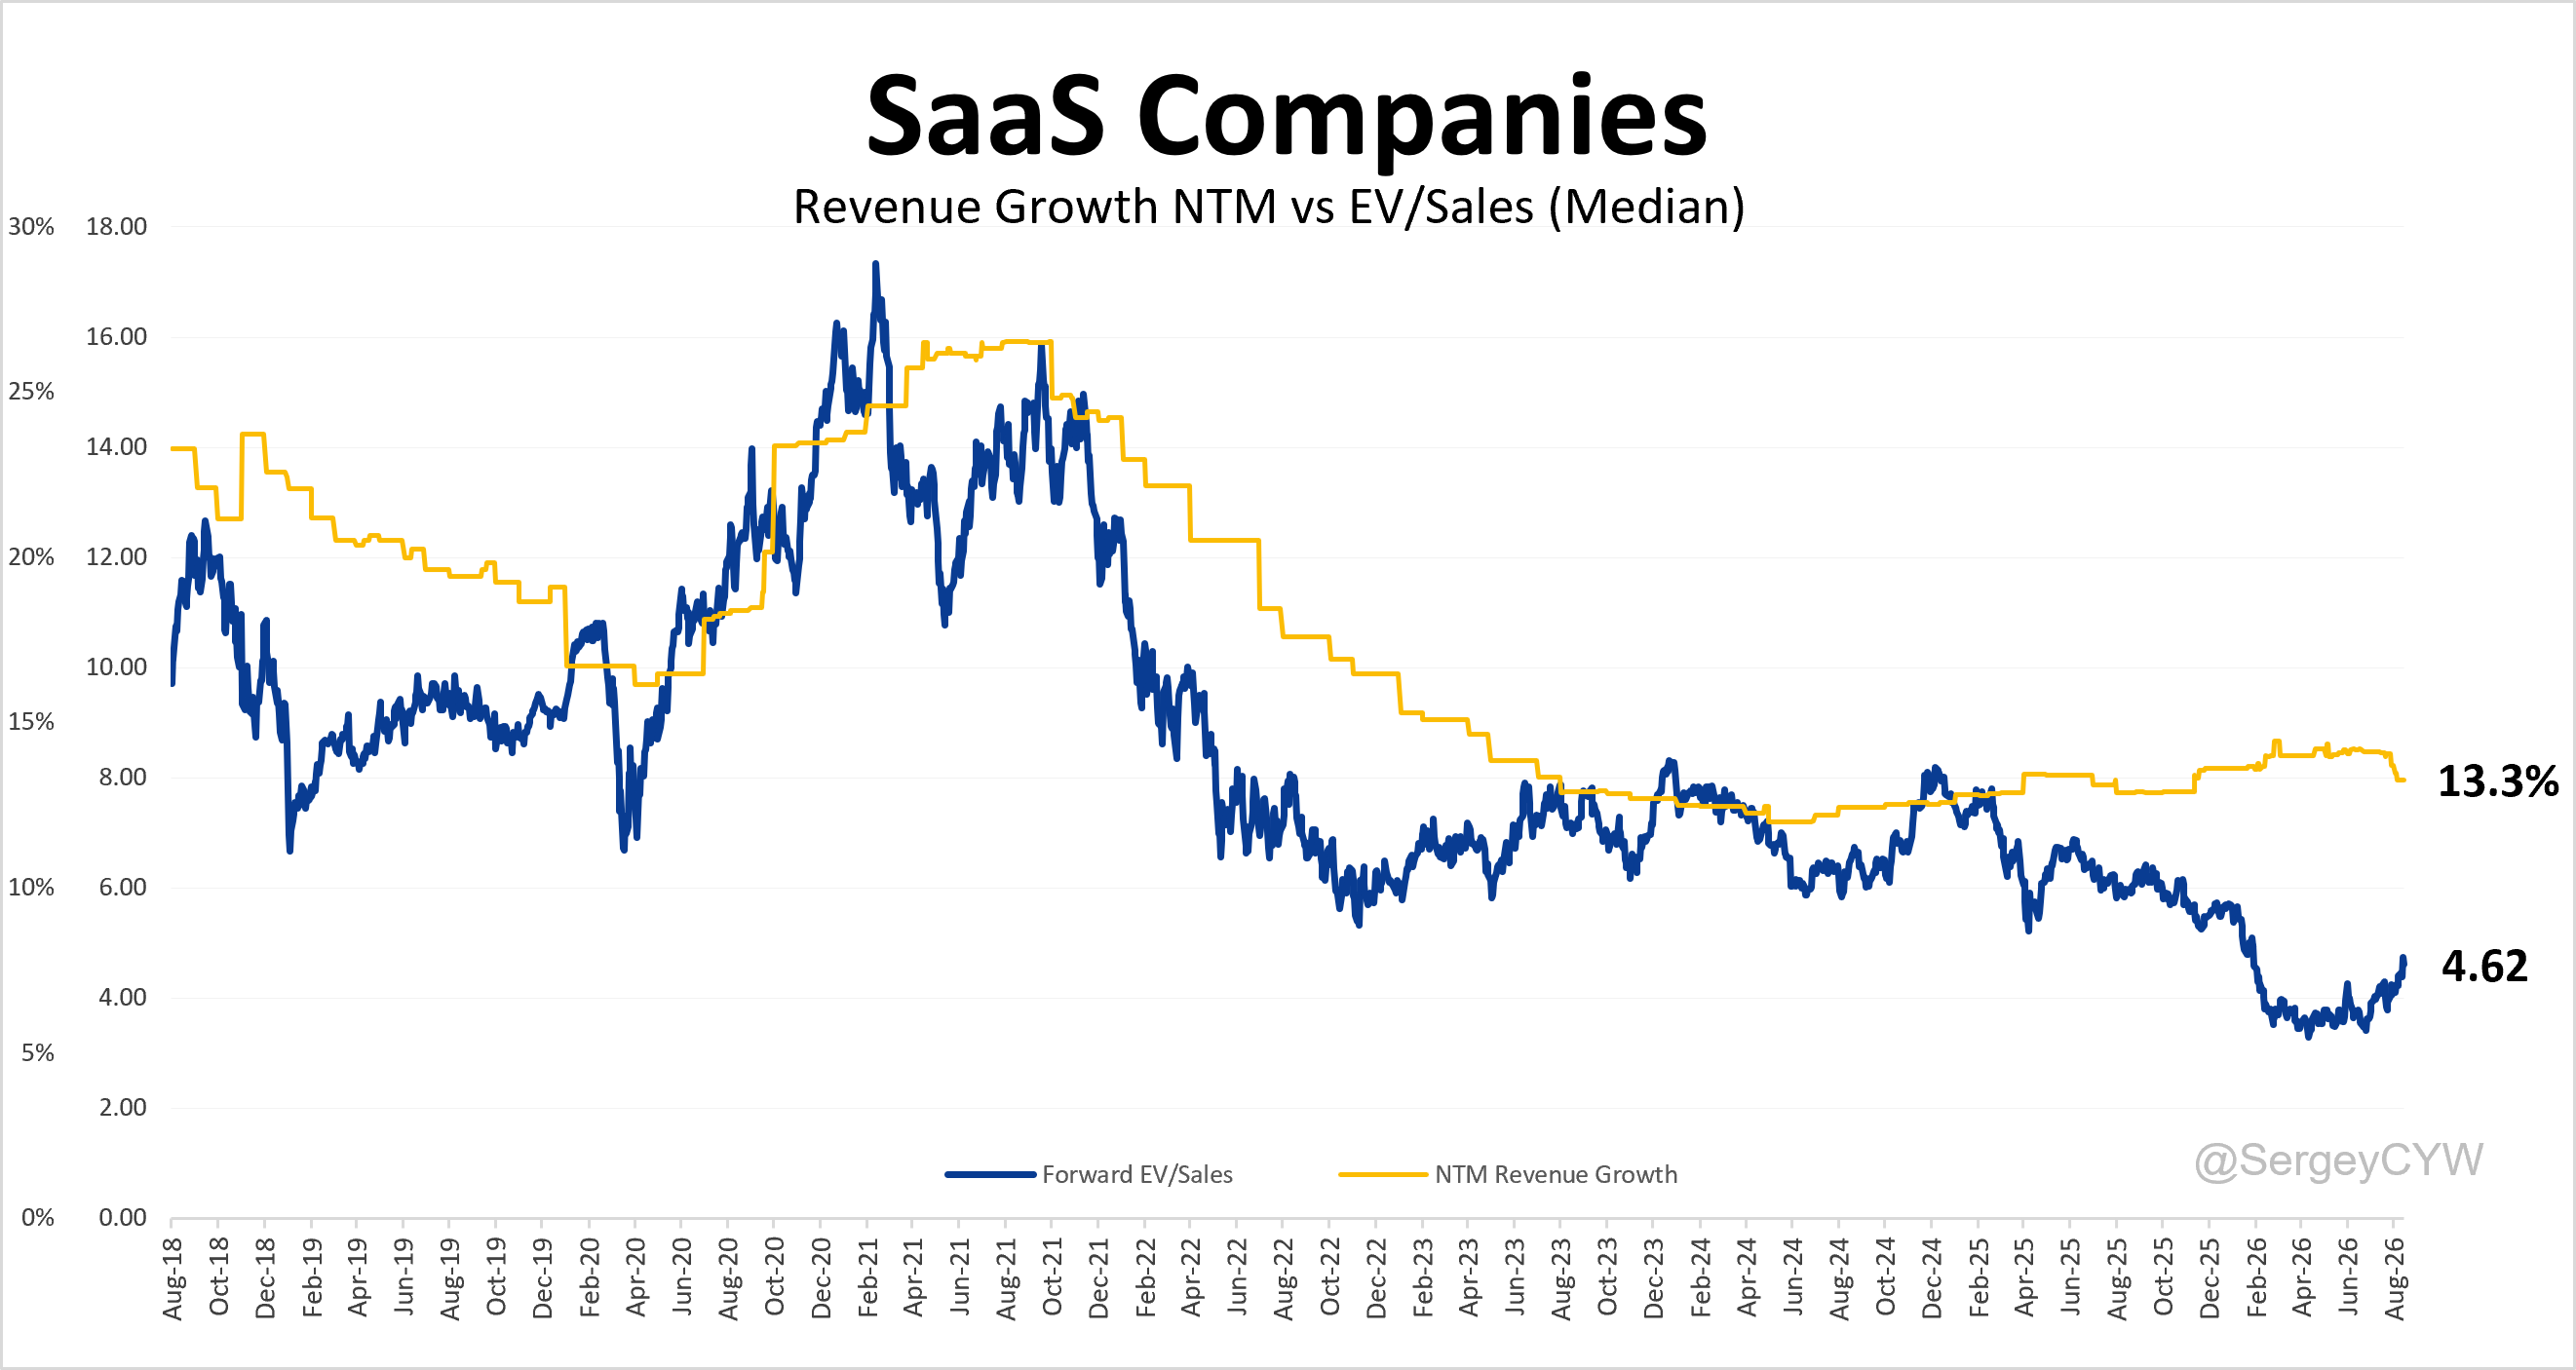
The dataset includes 85 public subscription-based software companies, with historical data from no longer publicly traded companies.
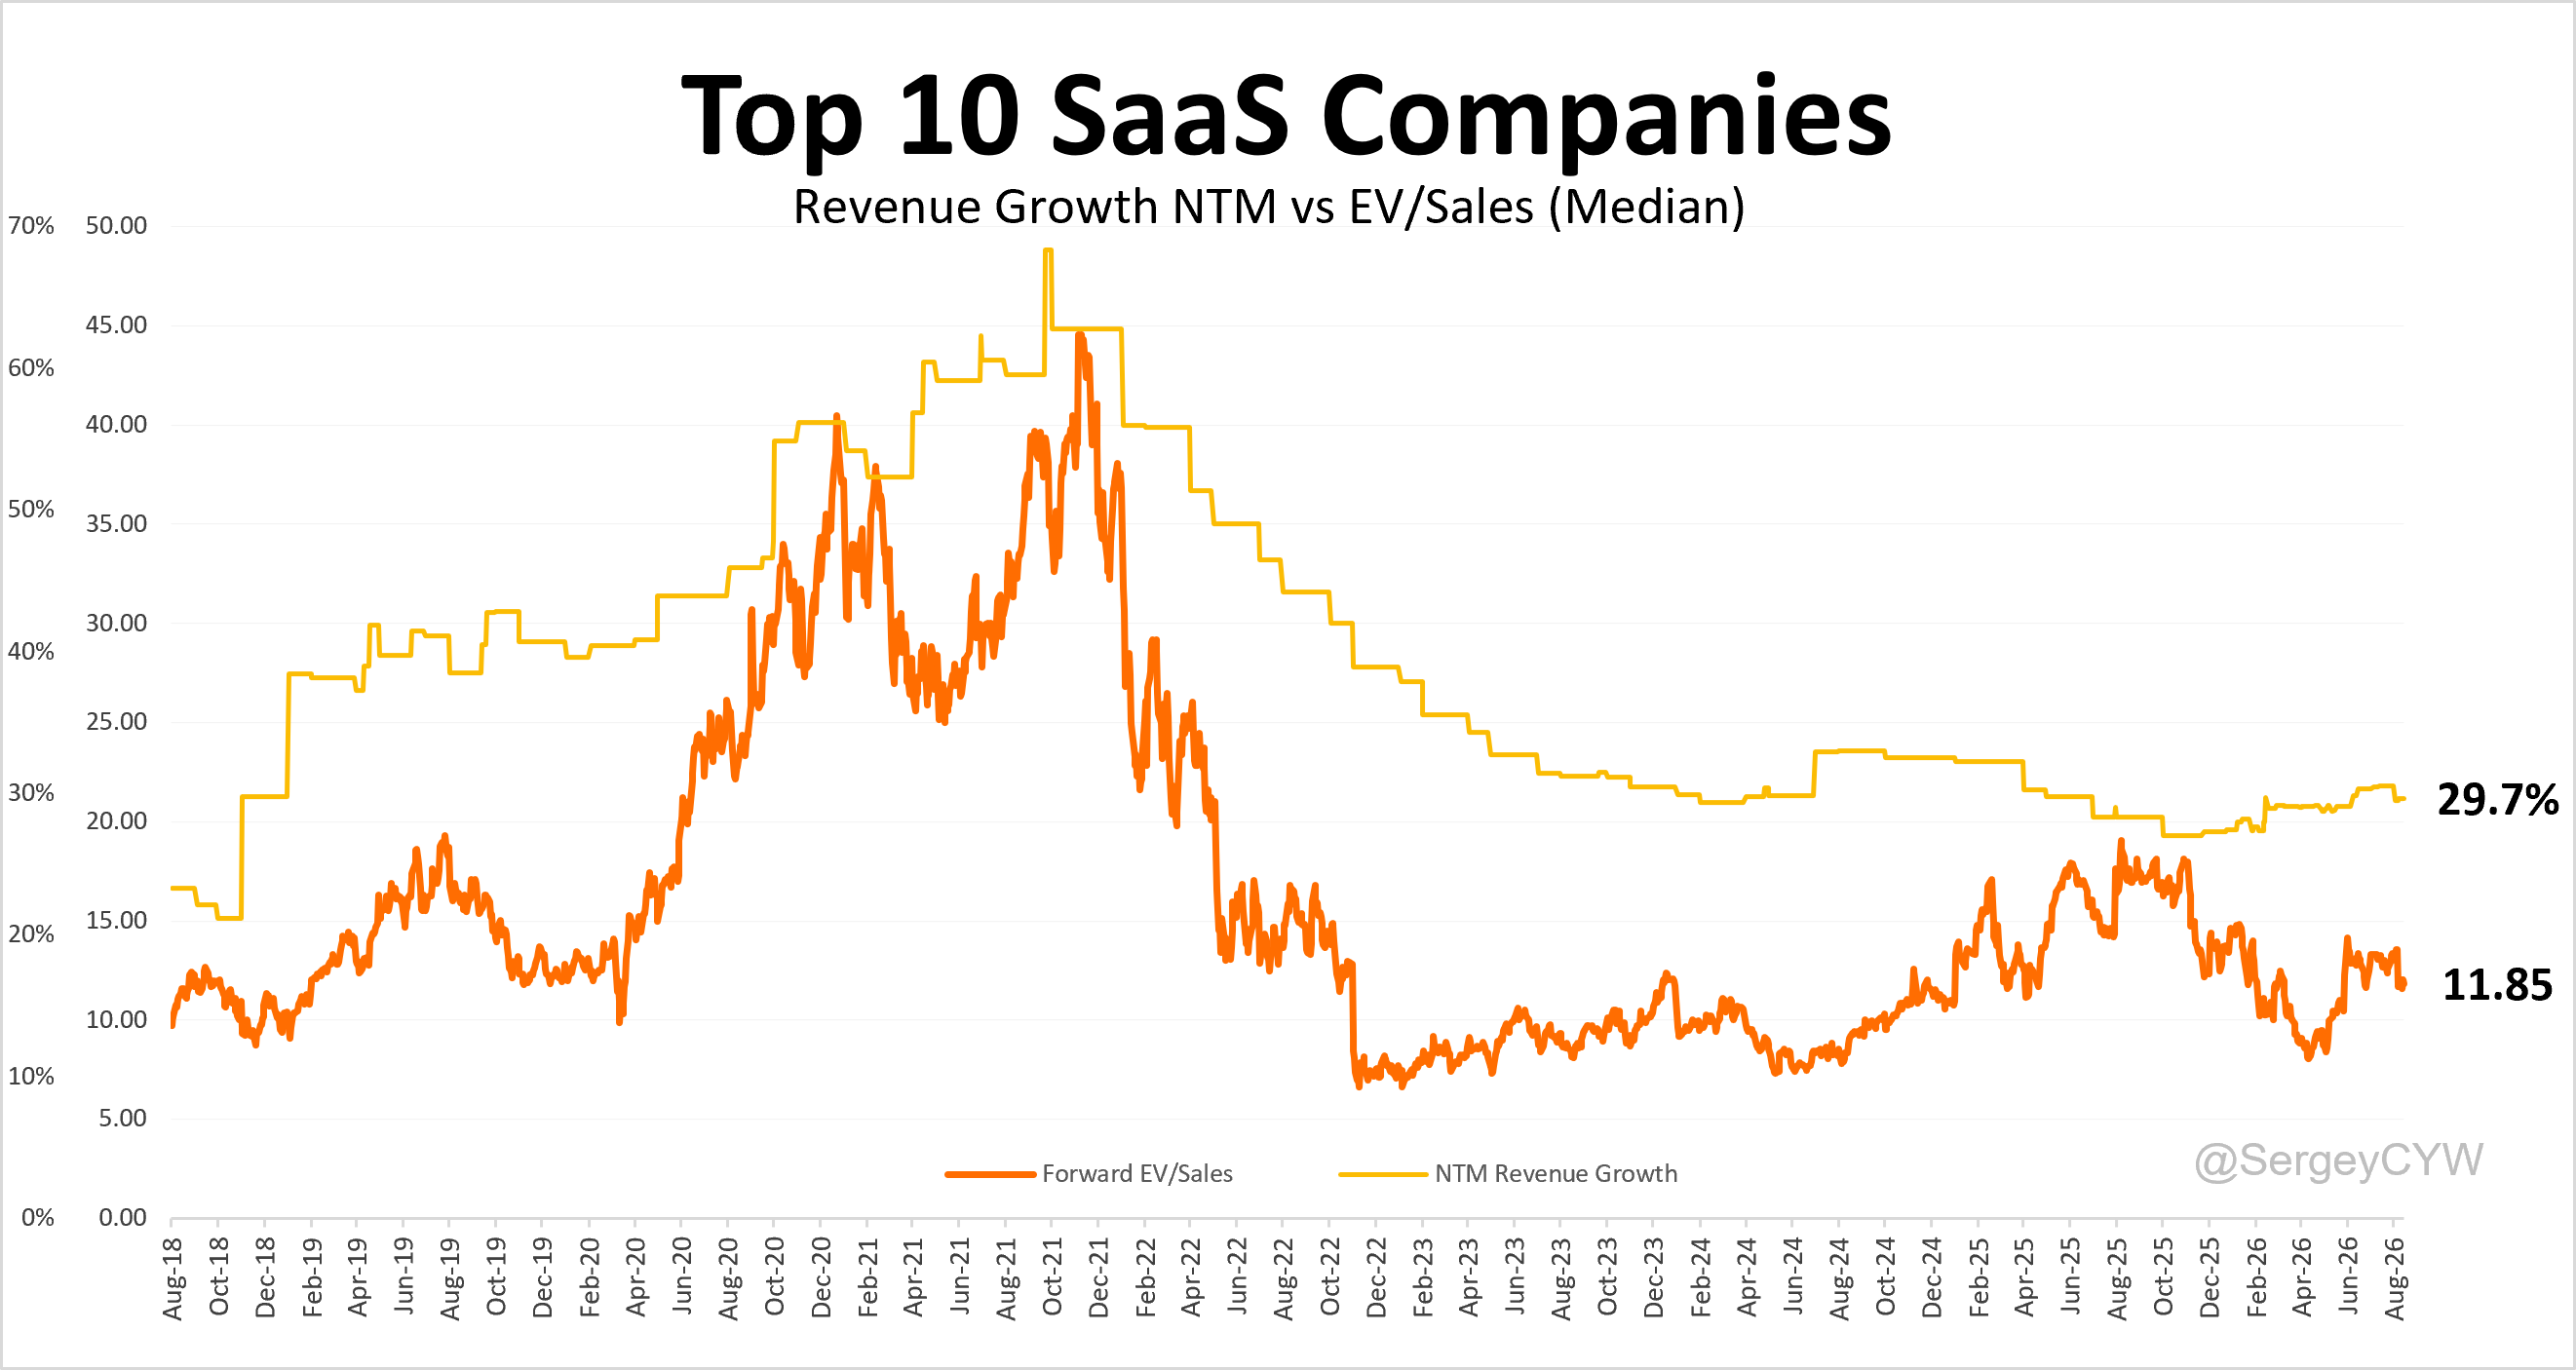
For the top 10 fastest-growing SaaS companies, the median EV/Sales multiple is 11.85, with 29.7% NTM revenue growth.
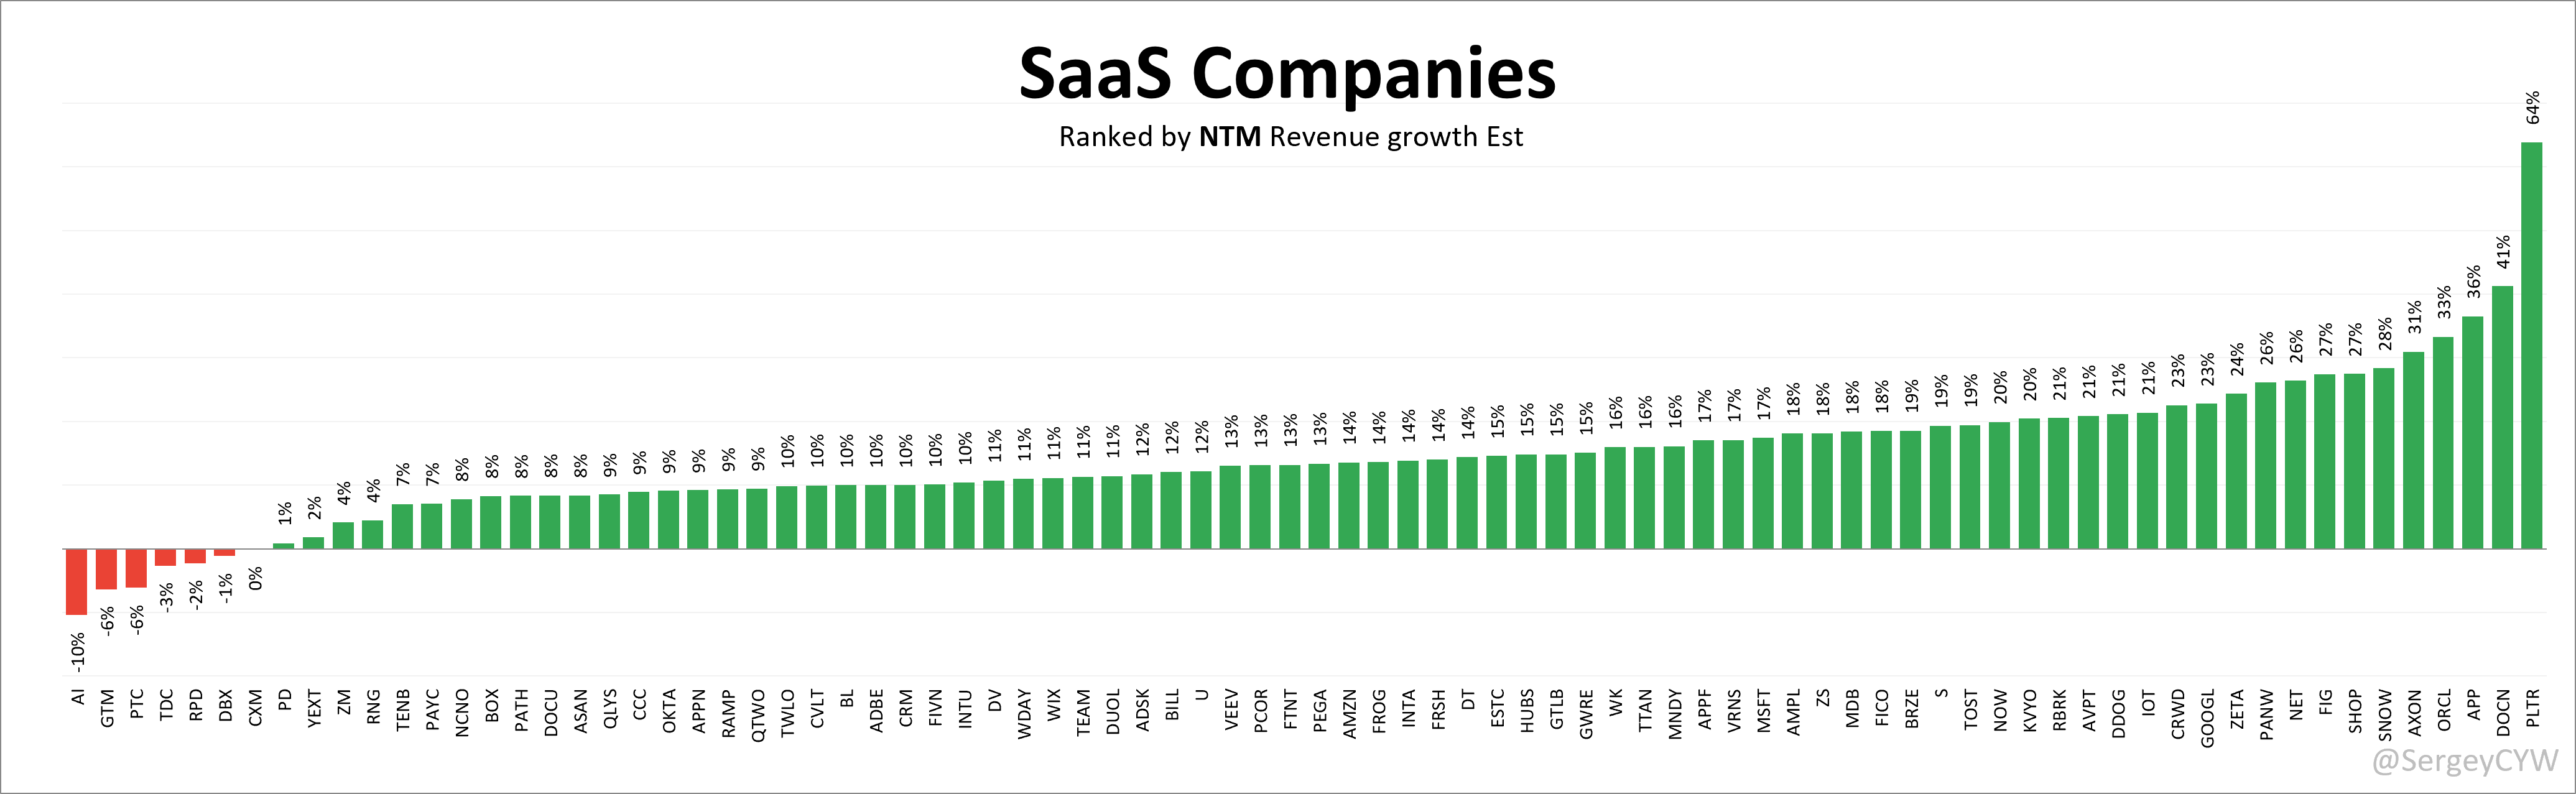
Evaluating growth stocks using forward projected revenue growth is crucial for investors because it provides insight into the company’s future potential, rather than just its current performance.
The EV/Gross Profit (GAAP) multiple relative to projected NTM revenue growth incorporates product efficiency, reflected through gross margin. Gross margin is a critical measure for software companies — consistently high or improving margins usually indicate strong competitive positioning and long-term potential.
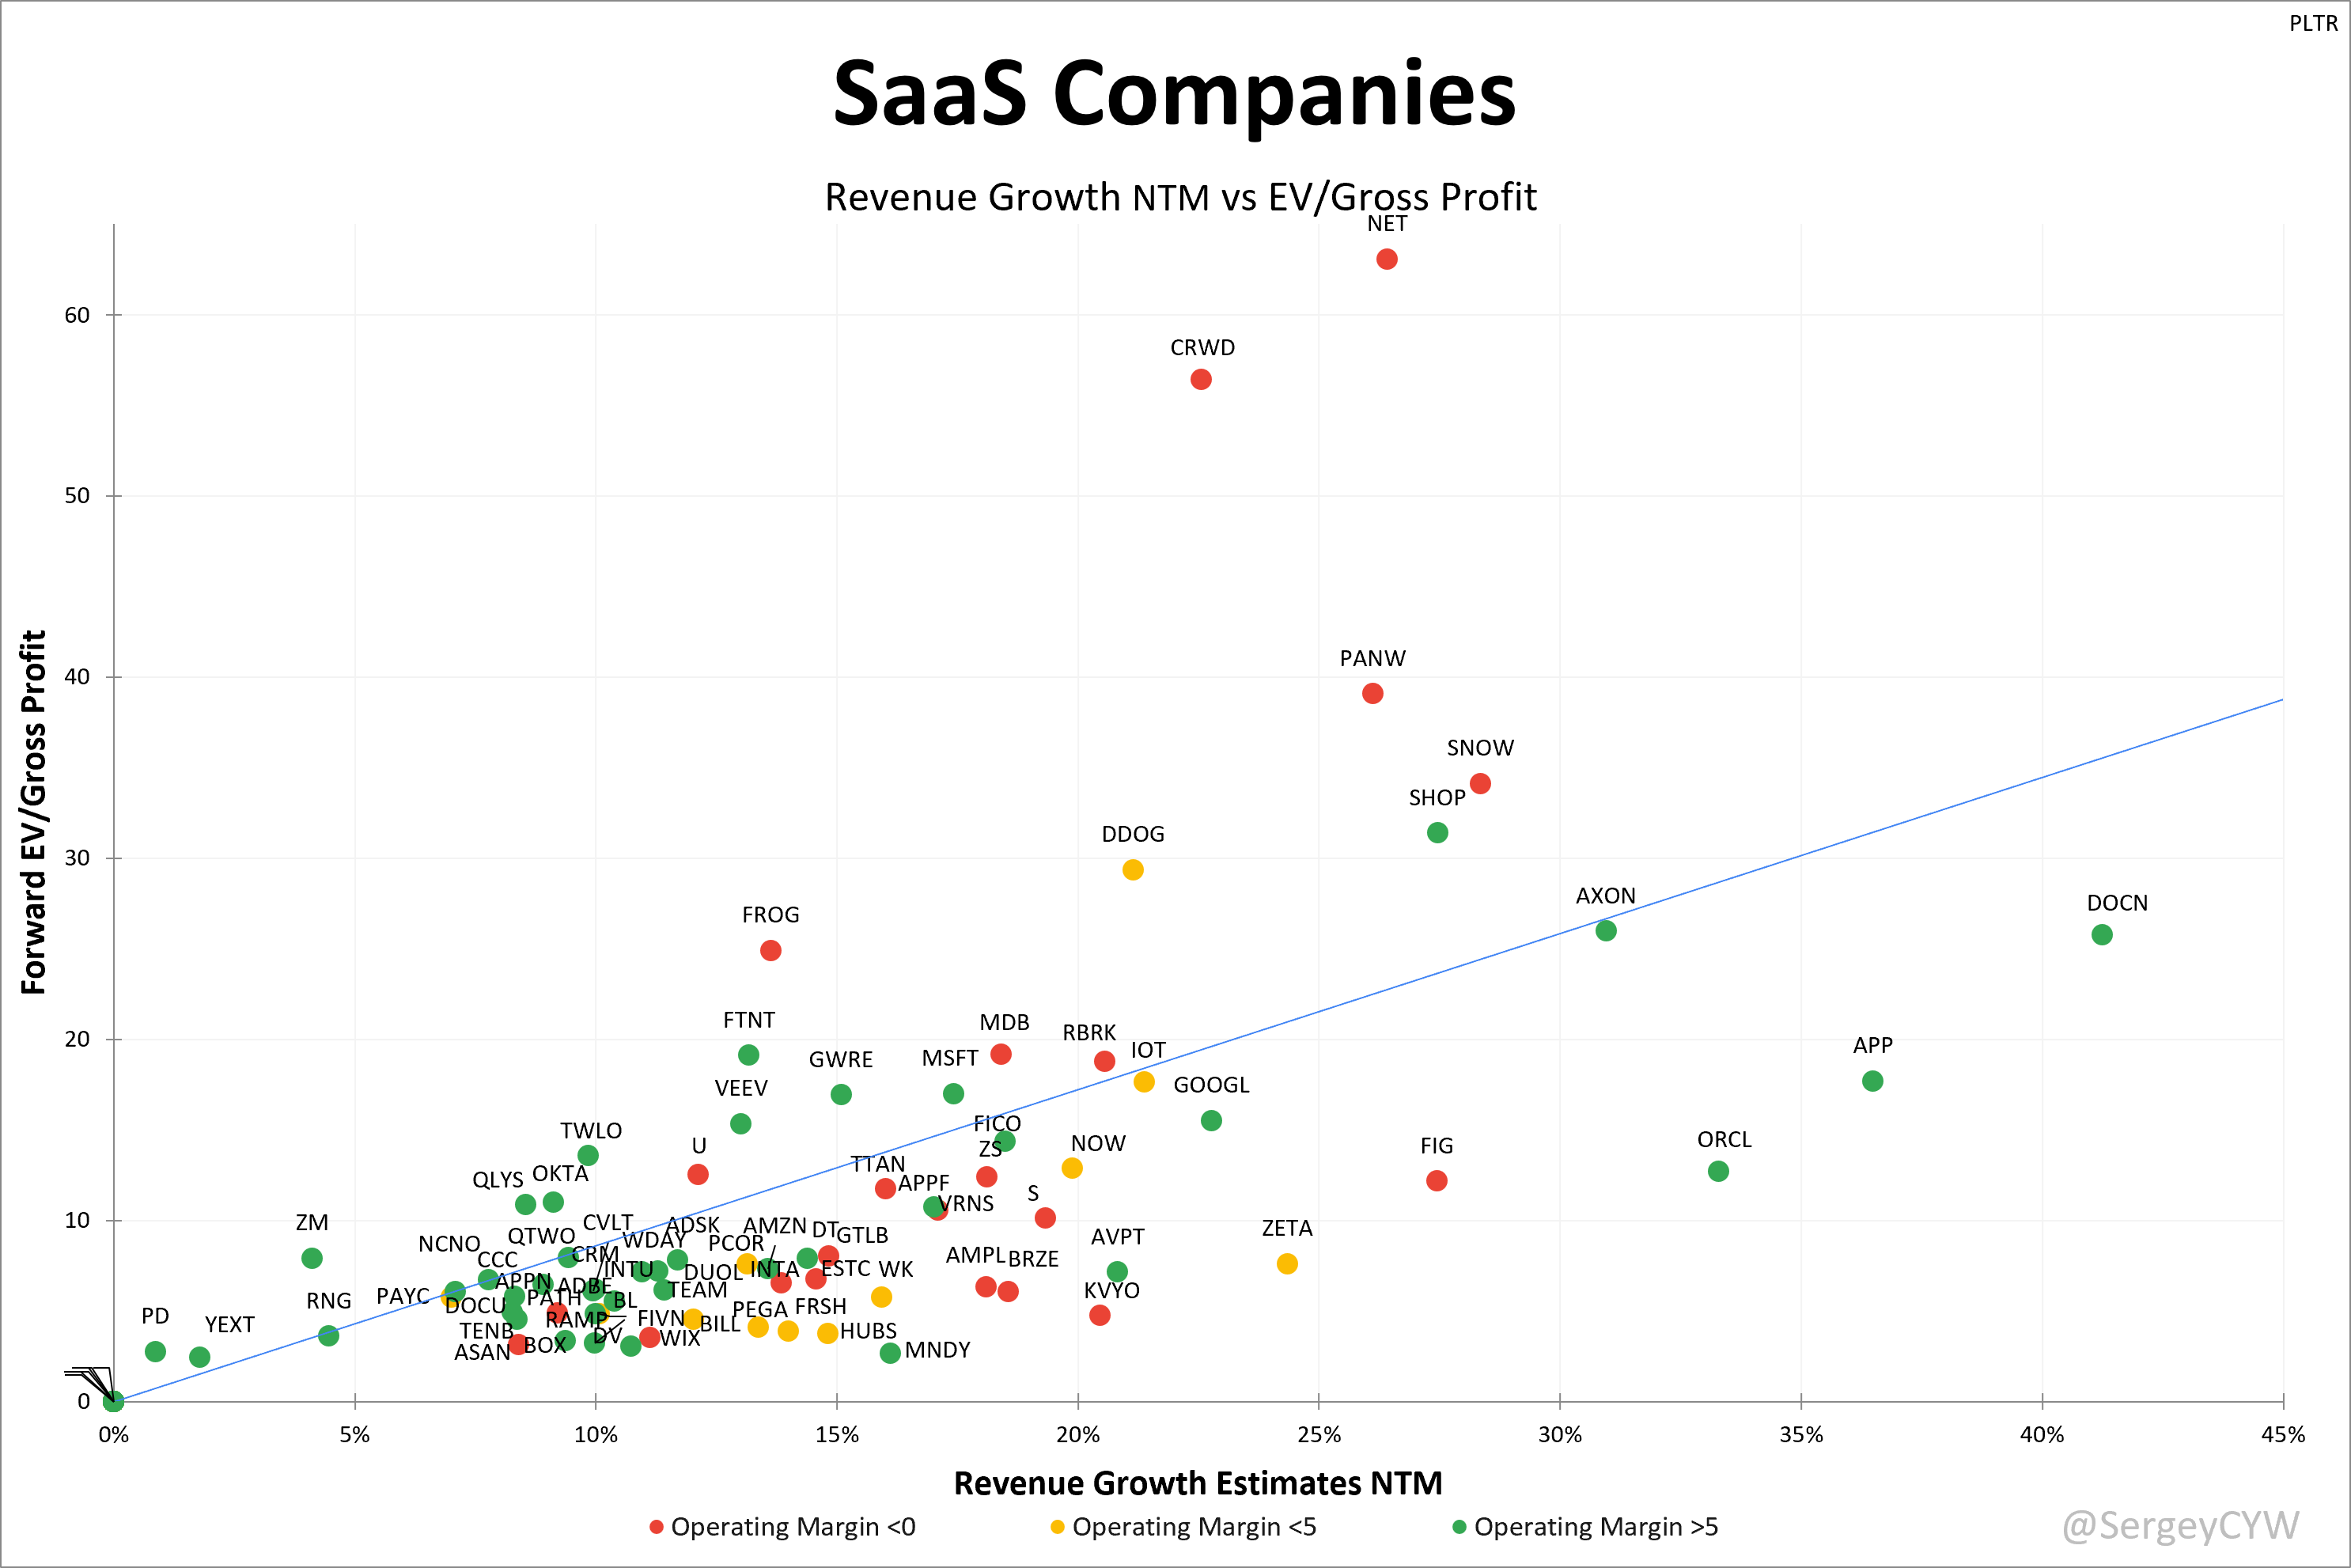
Note: PLTR was removed from this chart as well, given its elevated 79.7 Forward EV/Gross Profit multiple. Only companies with EV > $1B and gross margins above 70% are included.
Price/Sales/Growth (PSG) adds an additional dimension to the P/S ratio by incorporating revenue growth, helping investors evaluate whether a premium P/S multiple is justified by a high revenue growth rate.
This is especially relevant in software, where high P/S multiples usually reflect expectations of sustainably high growth or further revenue acceleration.
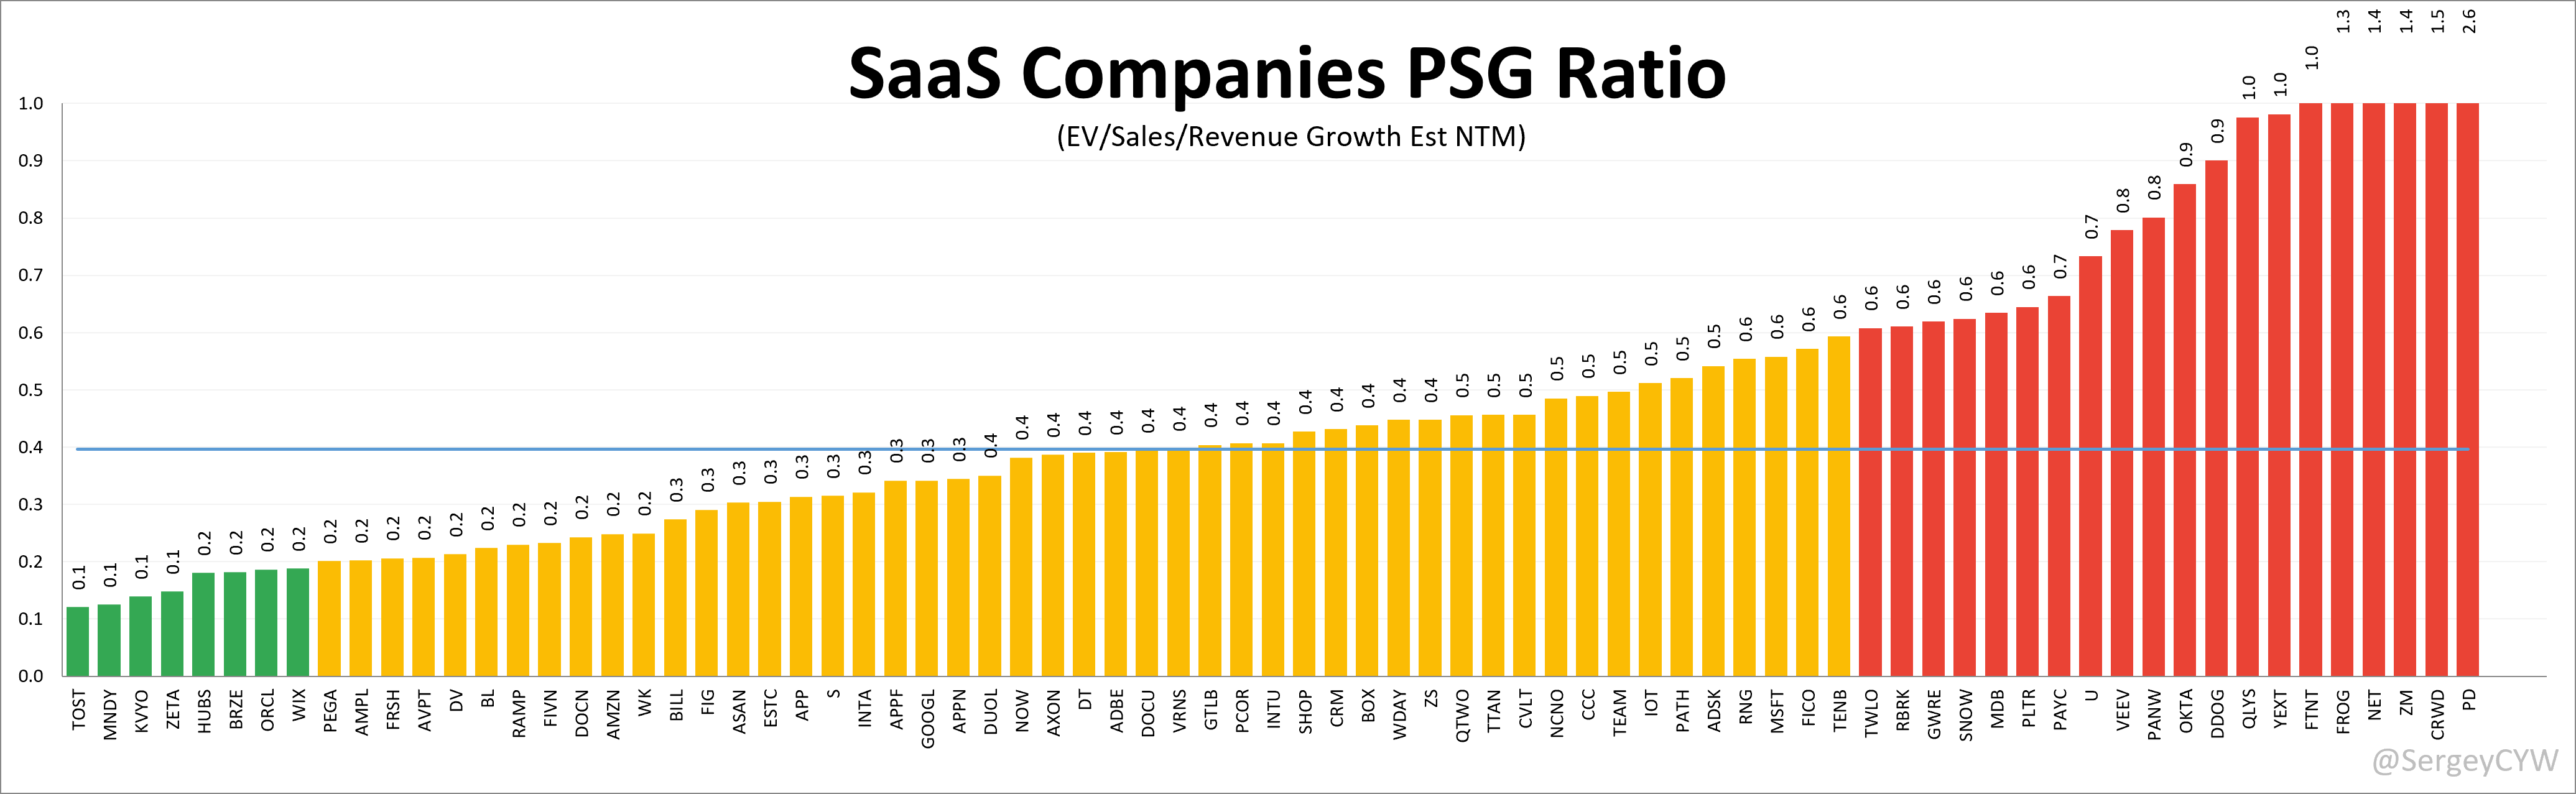
For calculations, I use: EV / NTM Estimated Sales / NTM Revenue Growth
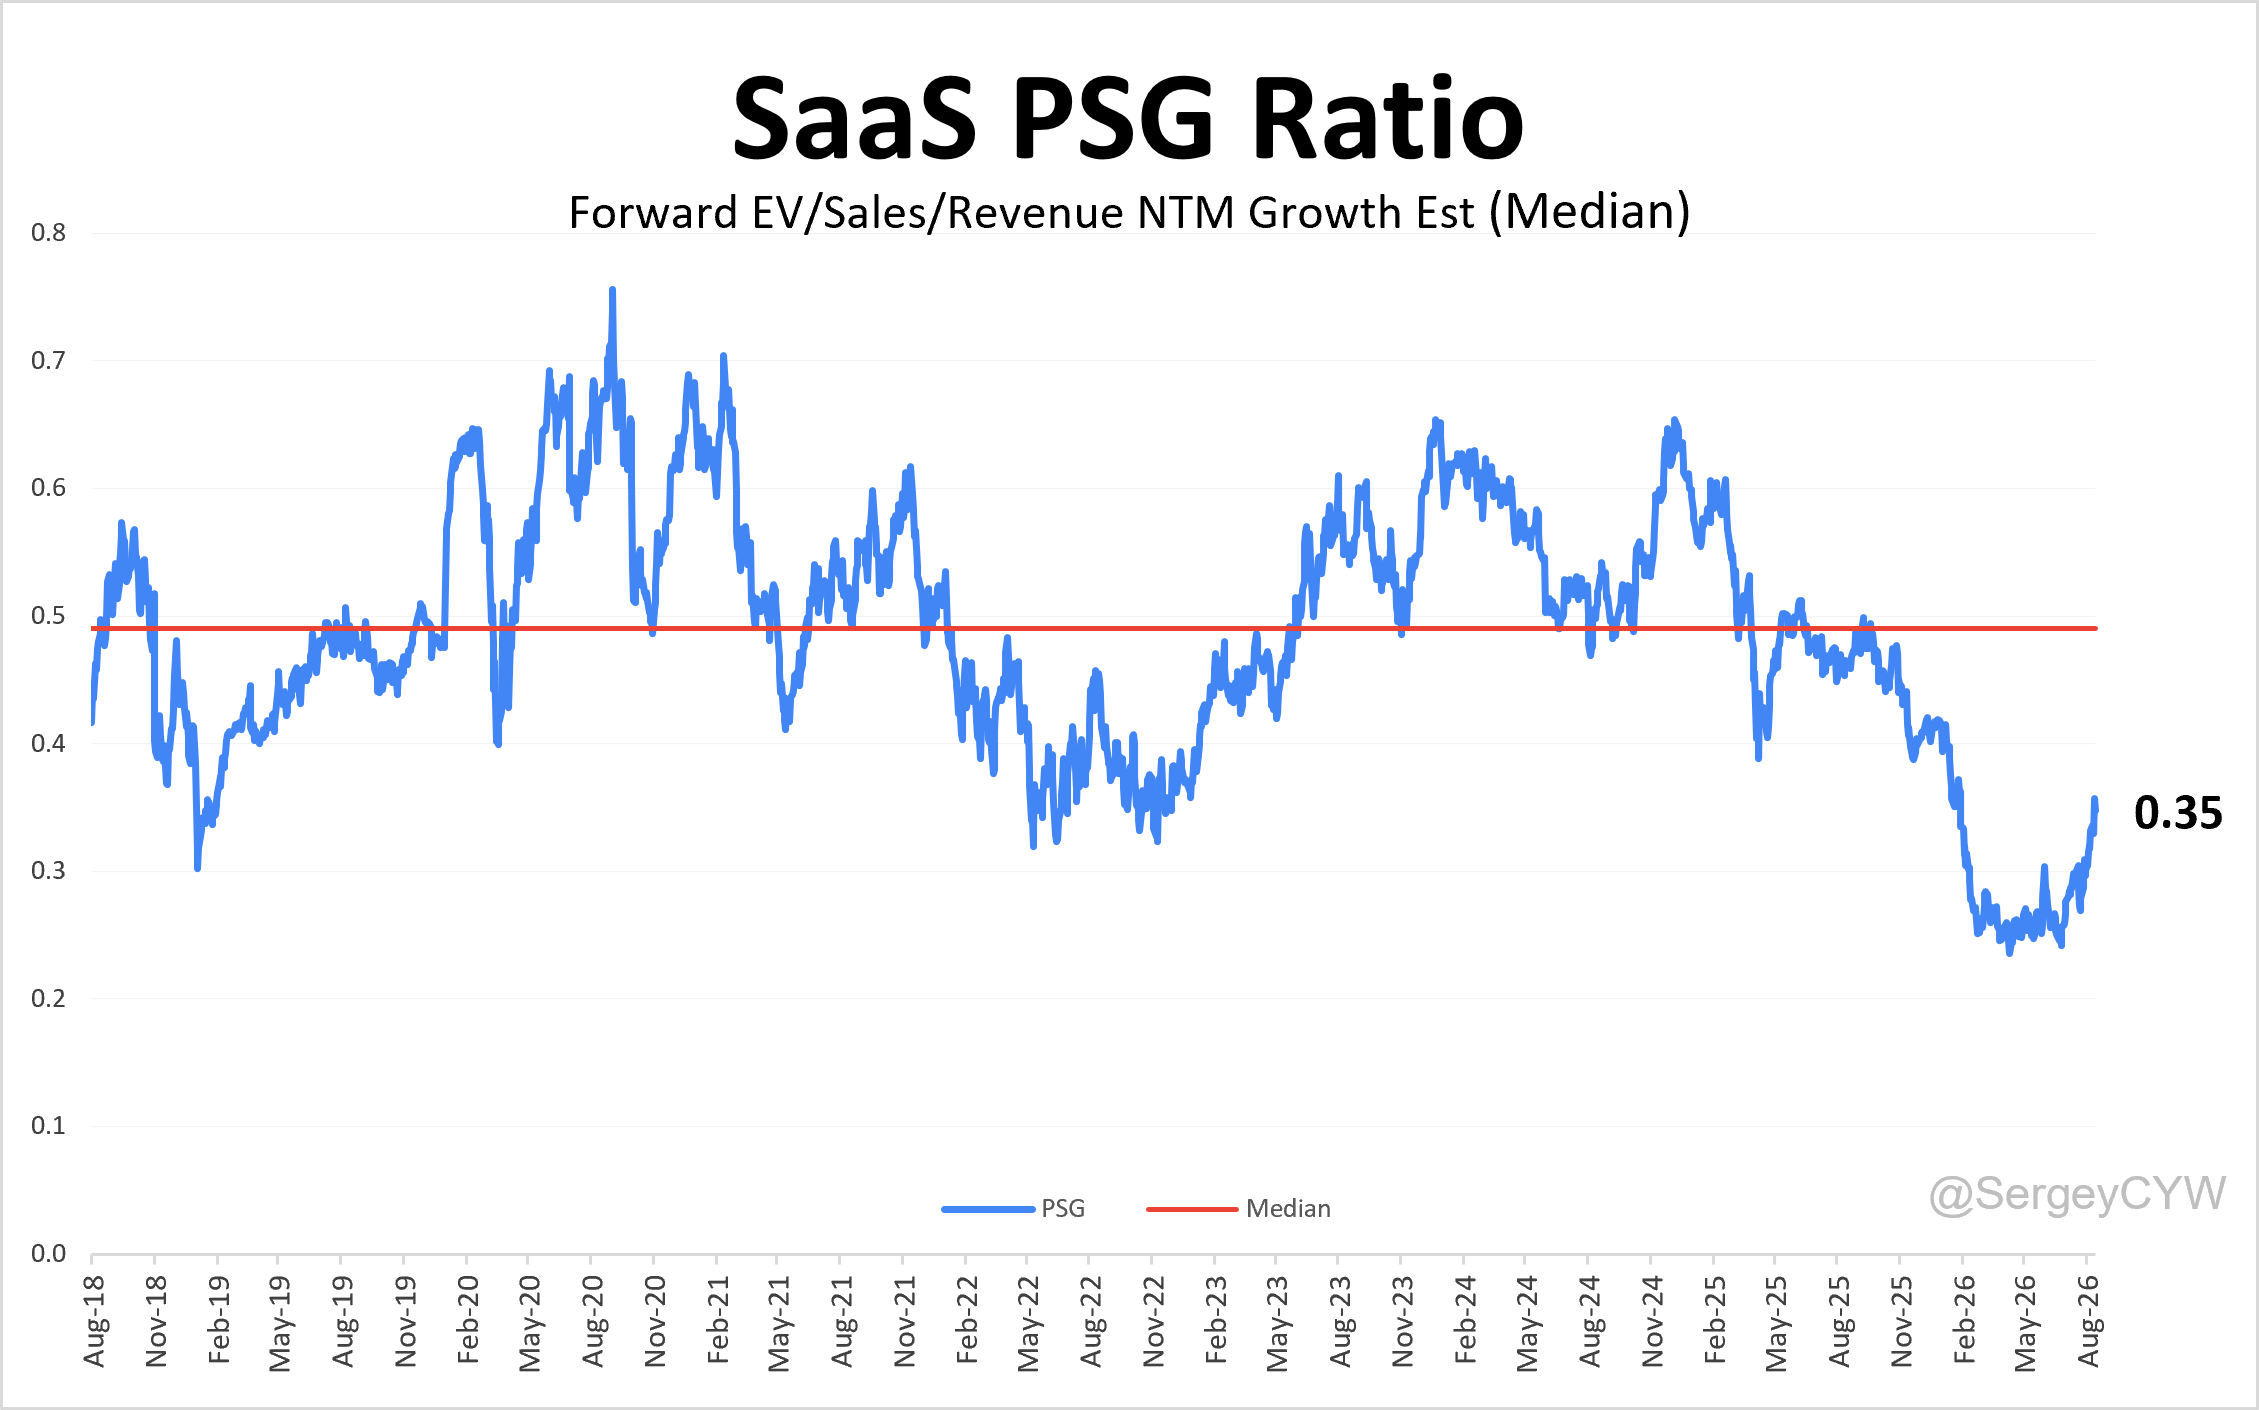
The historical chart for the median PSG multiple among SaaS companies shows a median of 0.35, compared with a long-term historical median of 0.49.
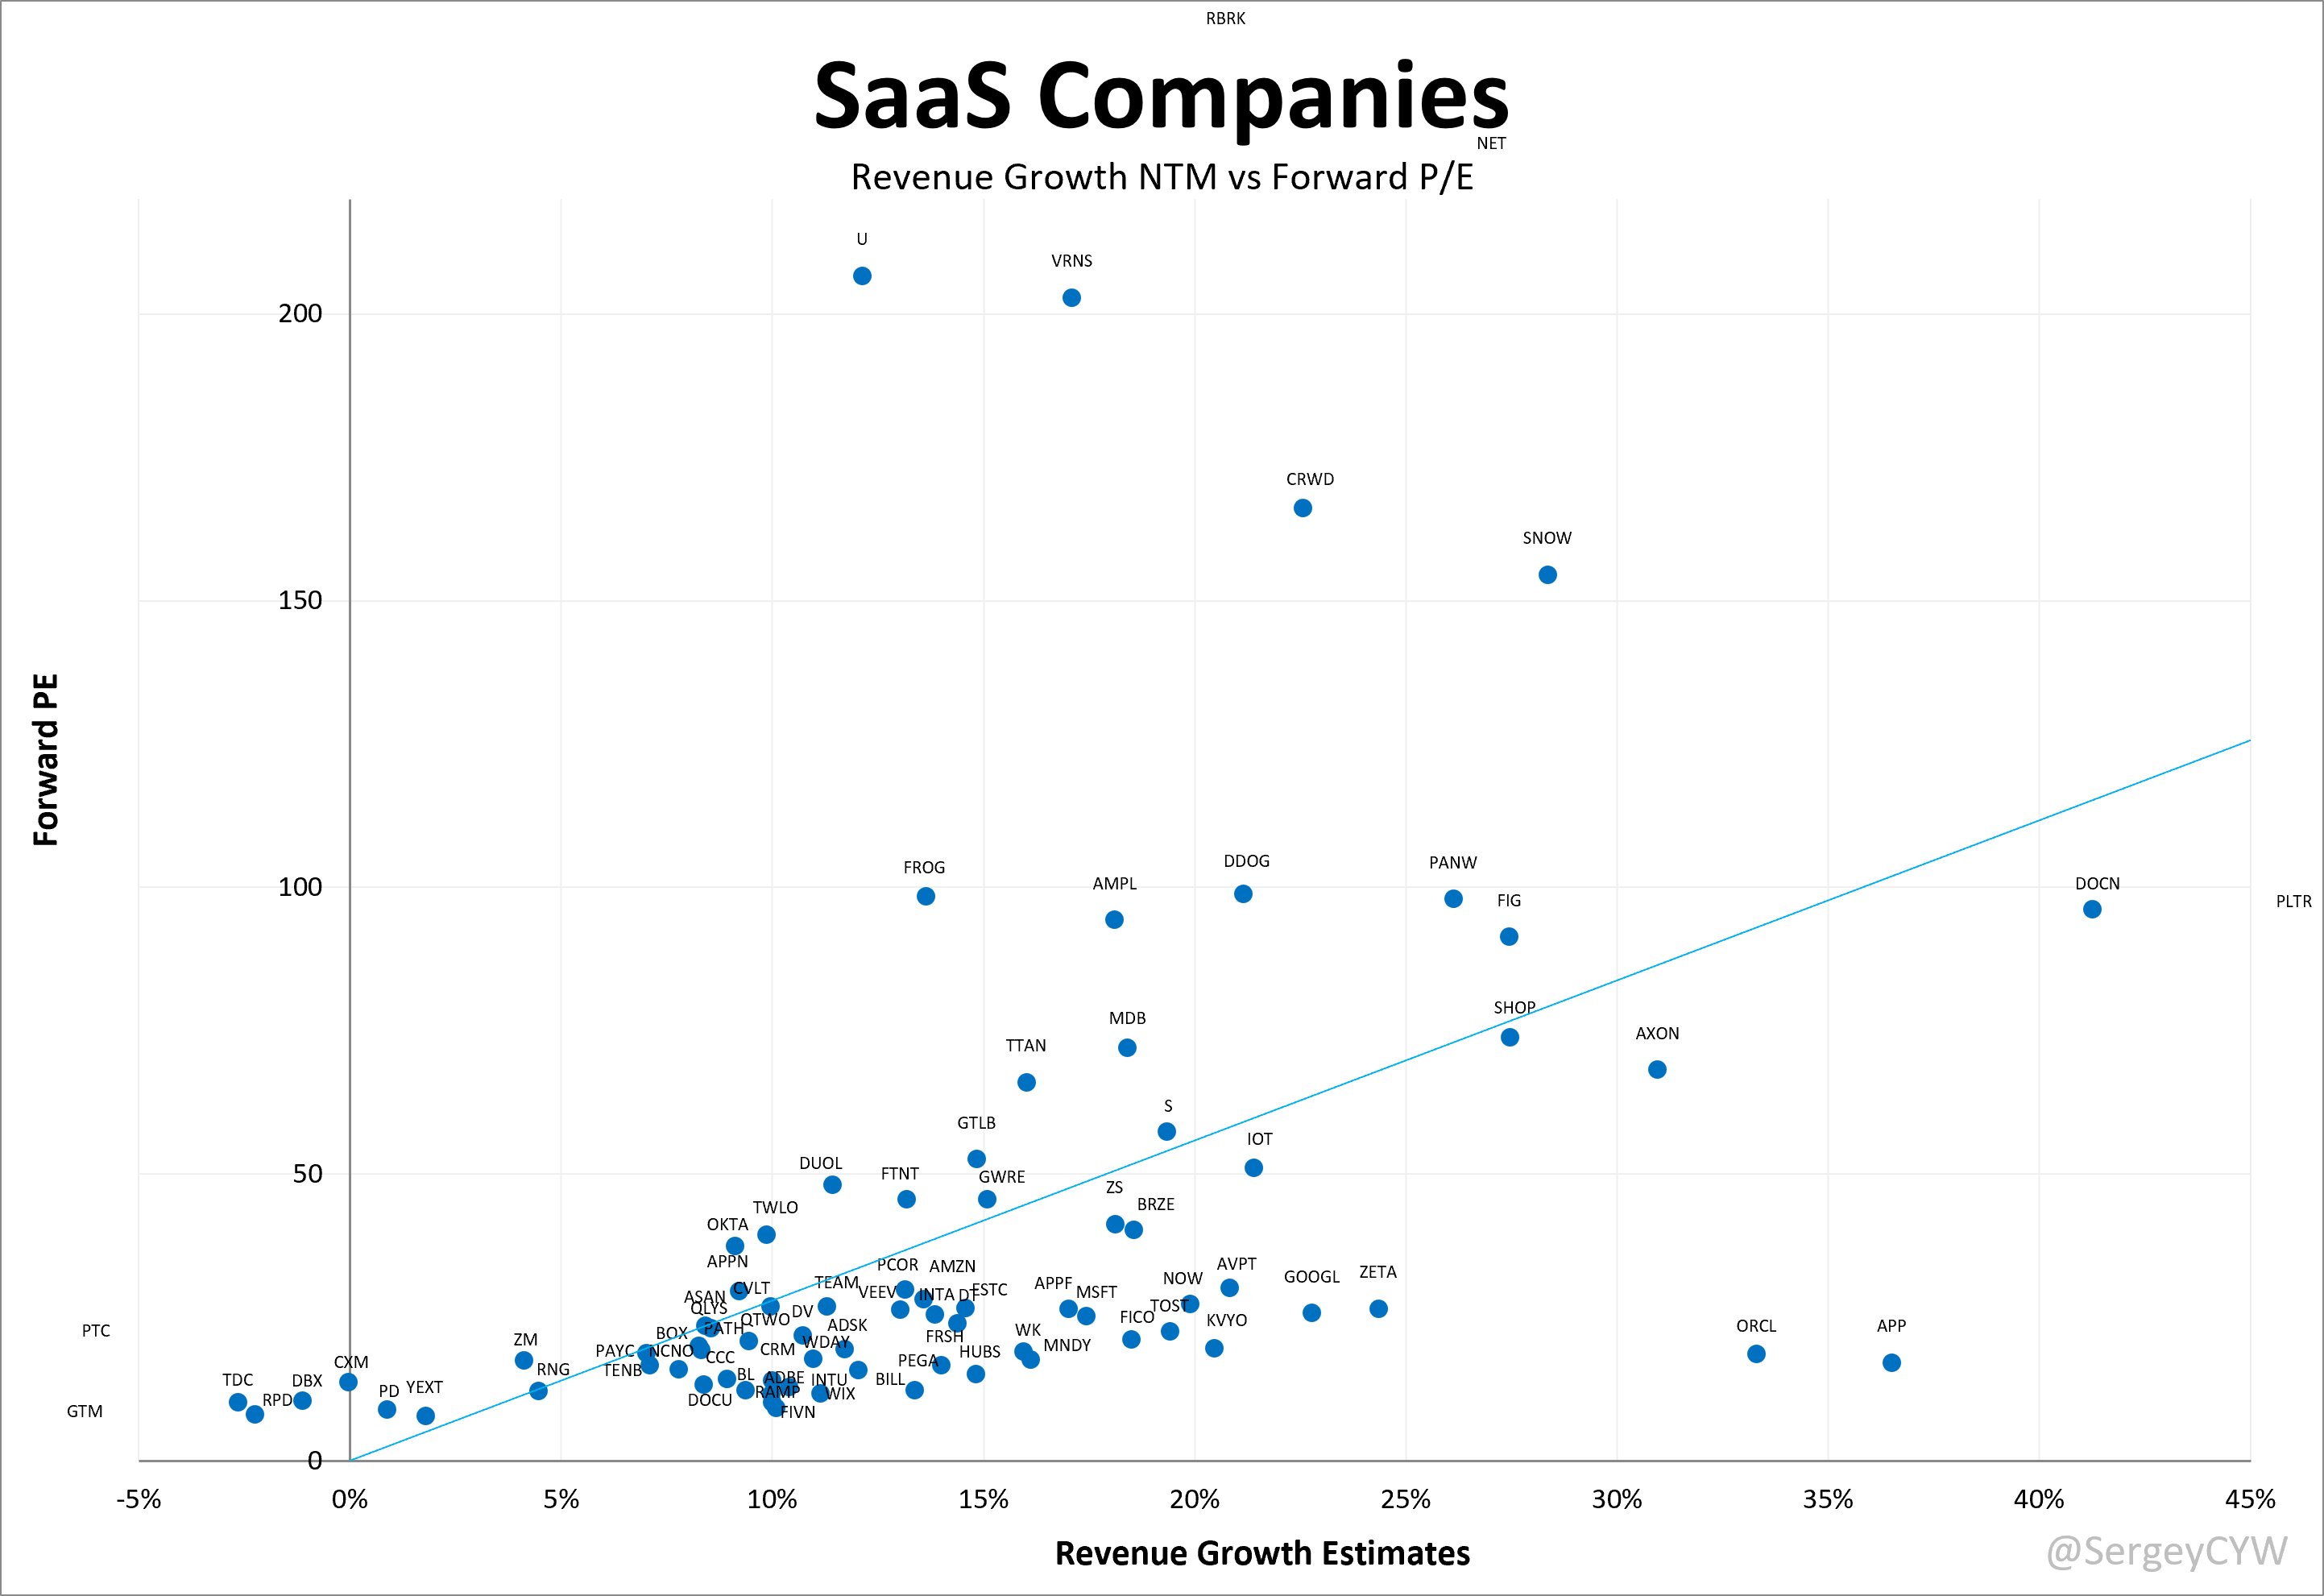
An alternative perspective would be a valuation chart based on the Forward P/E ratio relative to analysts’ revenue growth forecasts.
Rule of 40 helps analyze the balance between growth and profitability in SaaS. A score >40% signals strong operational performance and makes a business more balanced from an operating-discipline perspective.
This balance is important for sustainable long-term growth because focusing too heavily on growth alone can make a business more vulnerable when unexpected negative conditions arise.
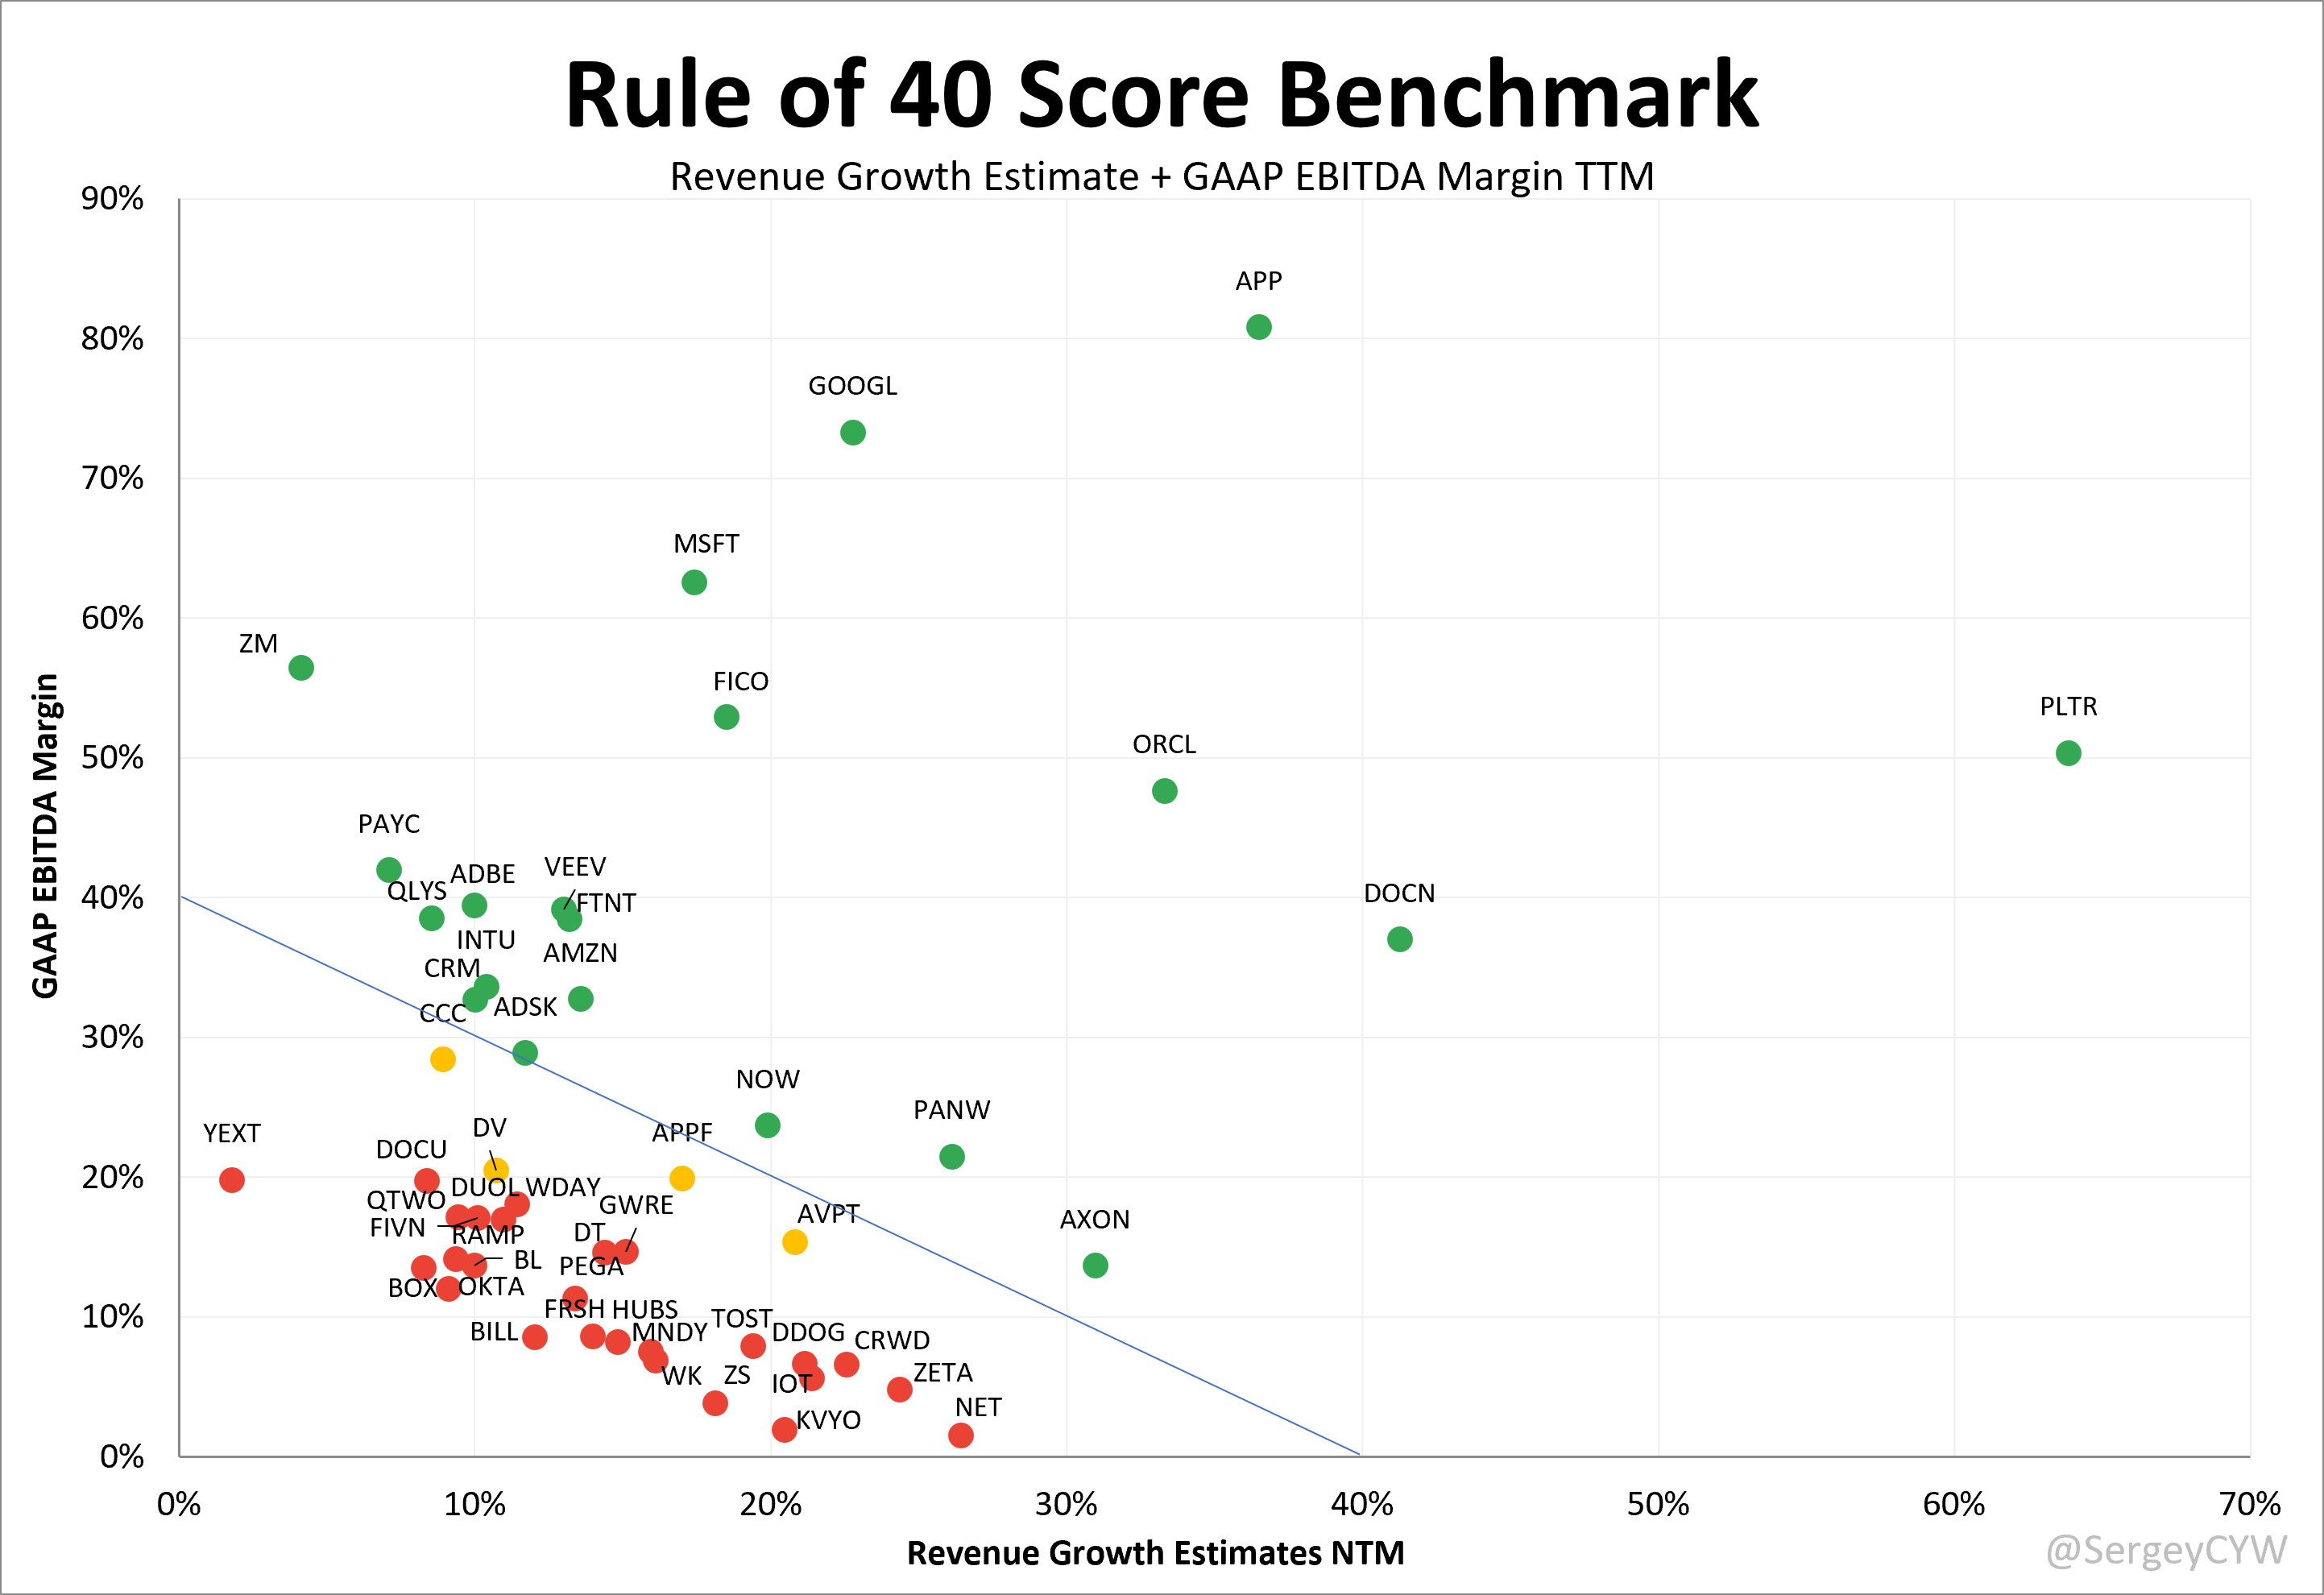
For this chart, I combined GAAP EBITDA Margin (TTM) with revenue growth estimates (NTM).
The Rule of 40 also allows to compare companies at different maturity levels.
Comparing the Rule of 40 with Forward EV/S helps show how the market values operating efficiency, not just expected revenue growth.
Rule of 40 helps evaluate operating efficiency.
EV/S helps evaluate revenue growth alone.
For a more complete view of whether investors are paying a reasonable price for sustainable growth, it makes sense to use both Rule of 40 and EV/S.
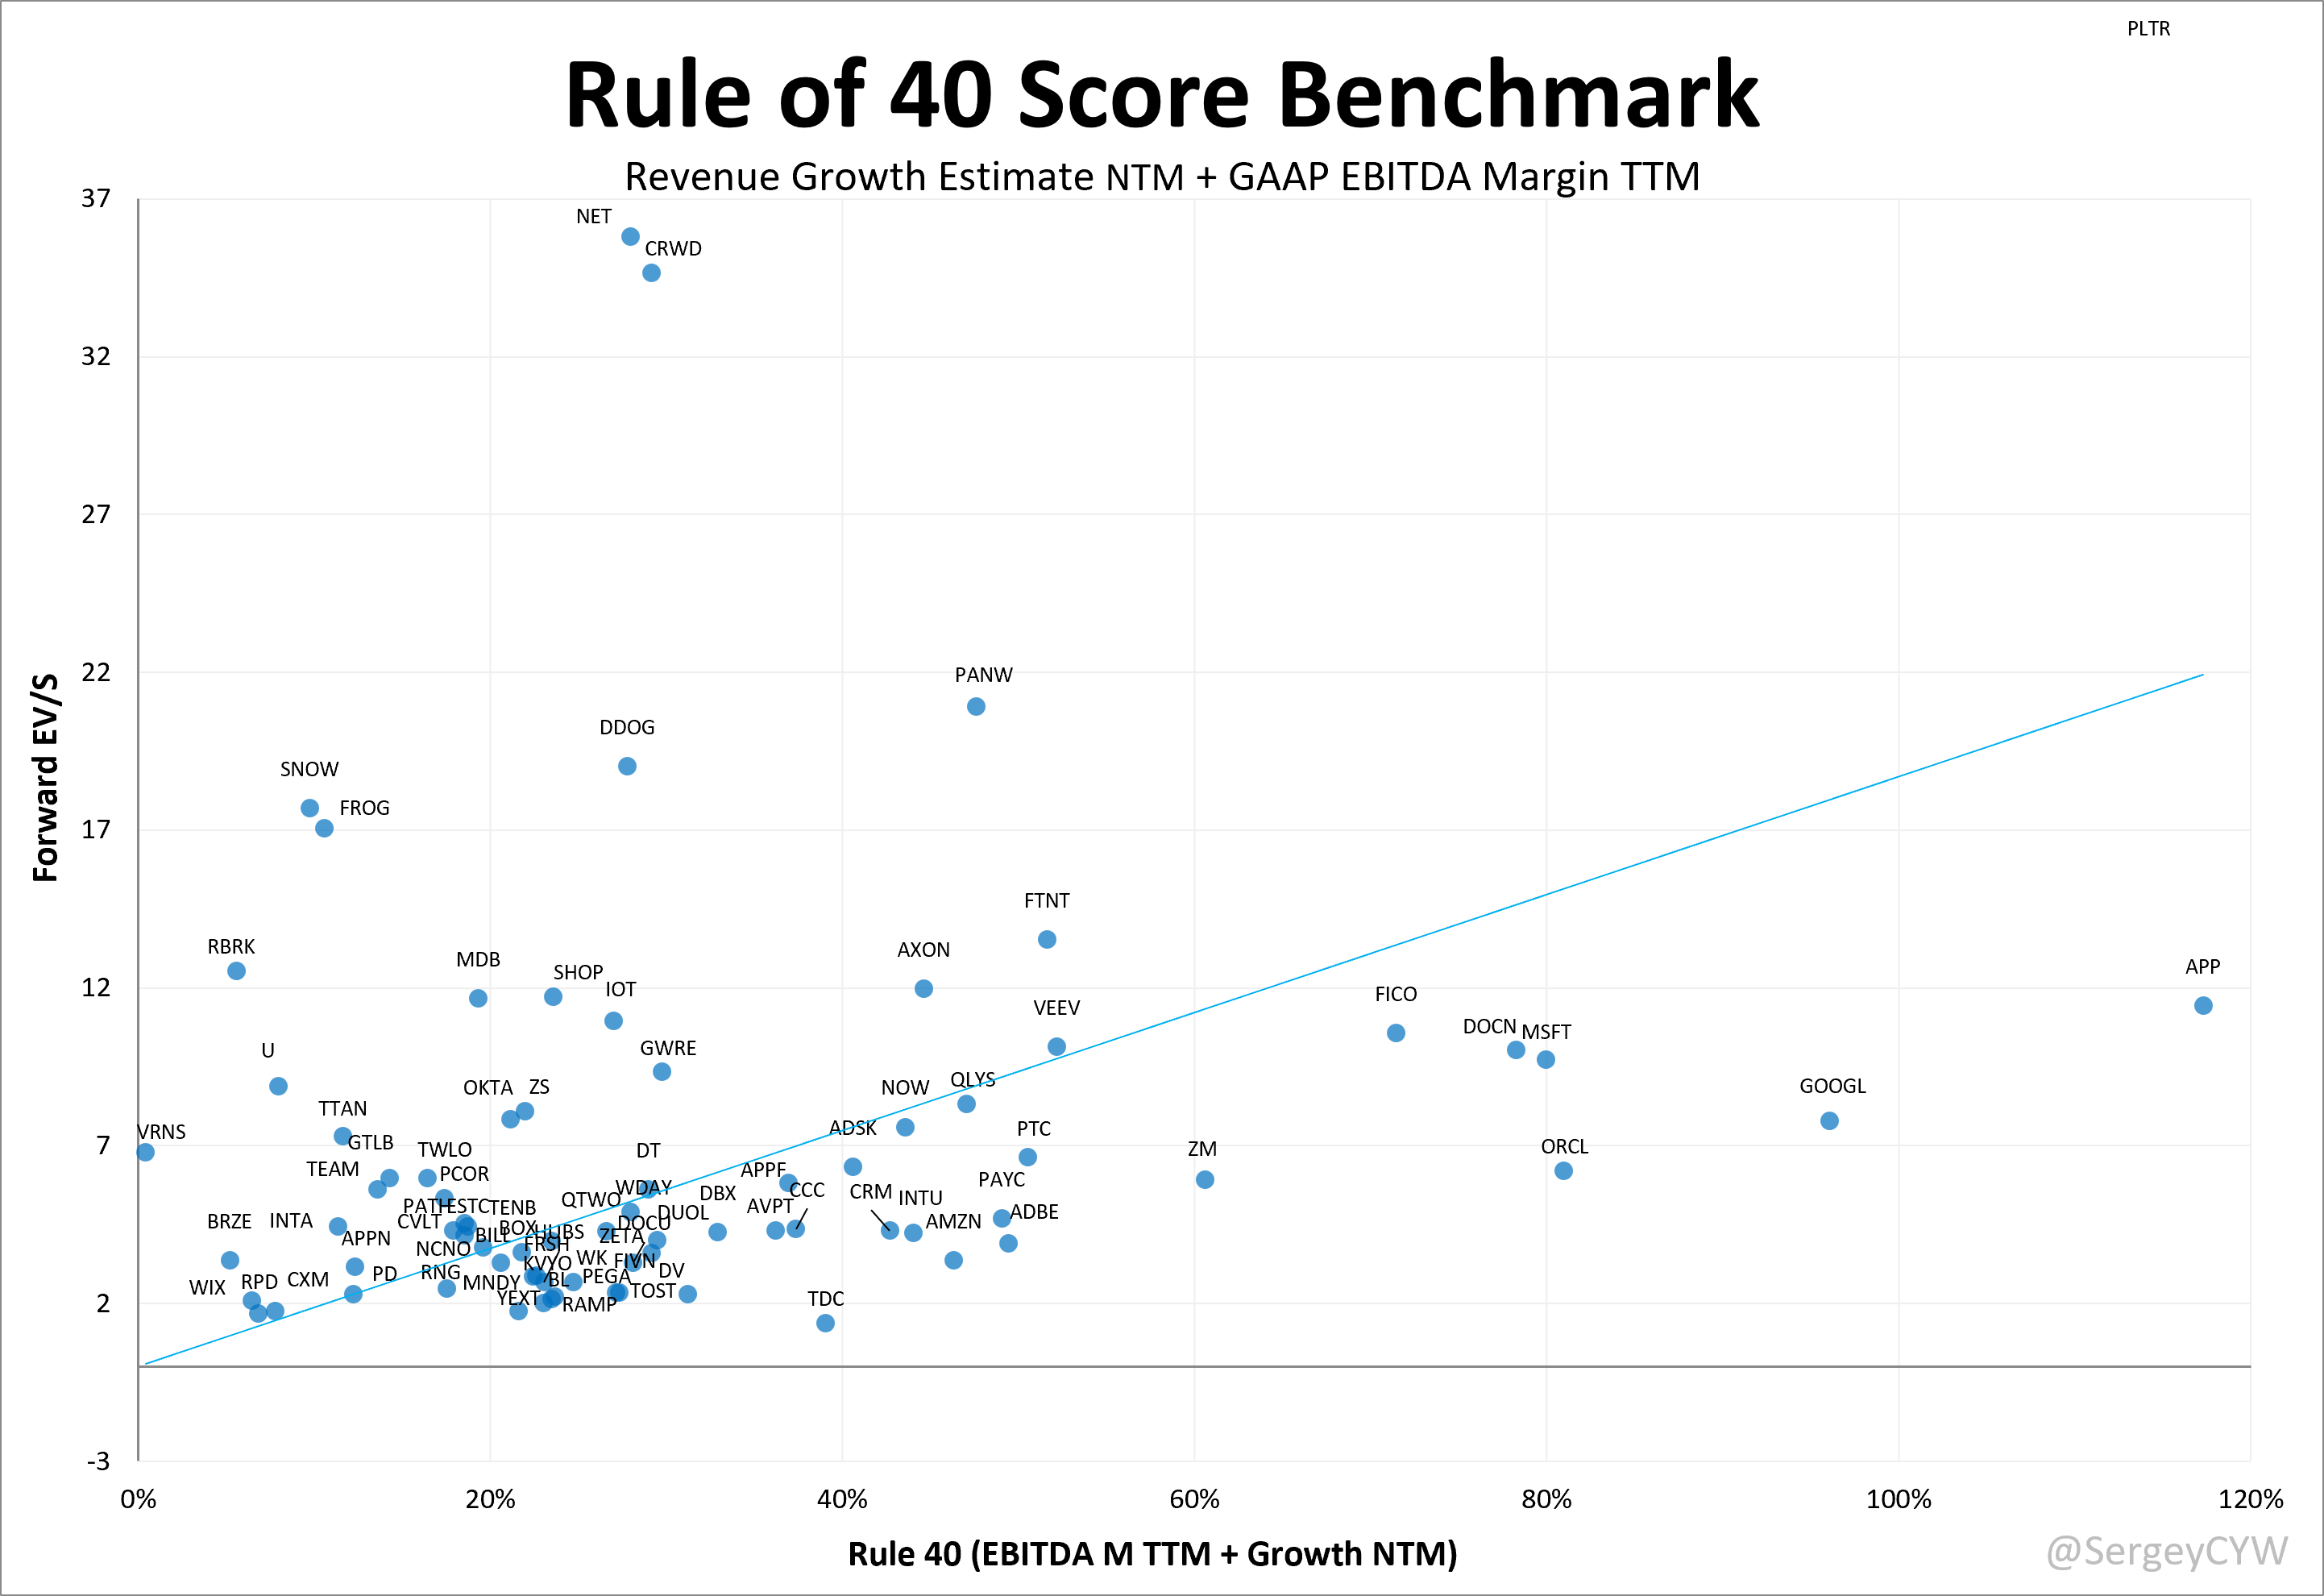
Note: This chart also uses GAAP EBITDA Margin (TTM) and NTM revenue growth estimates.
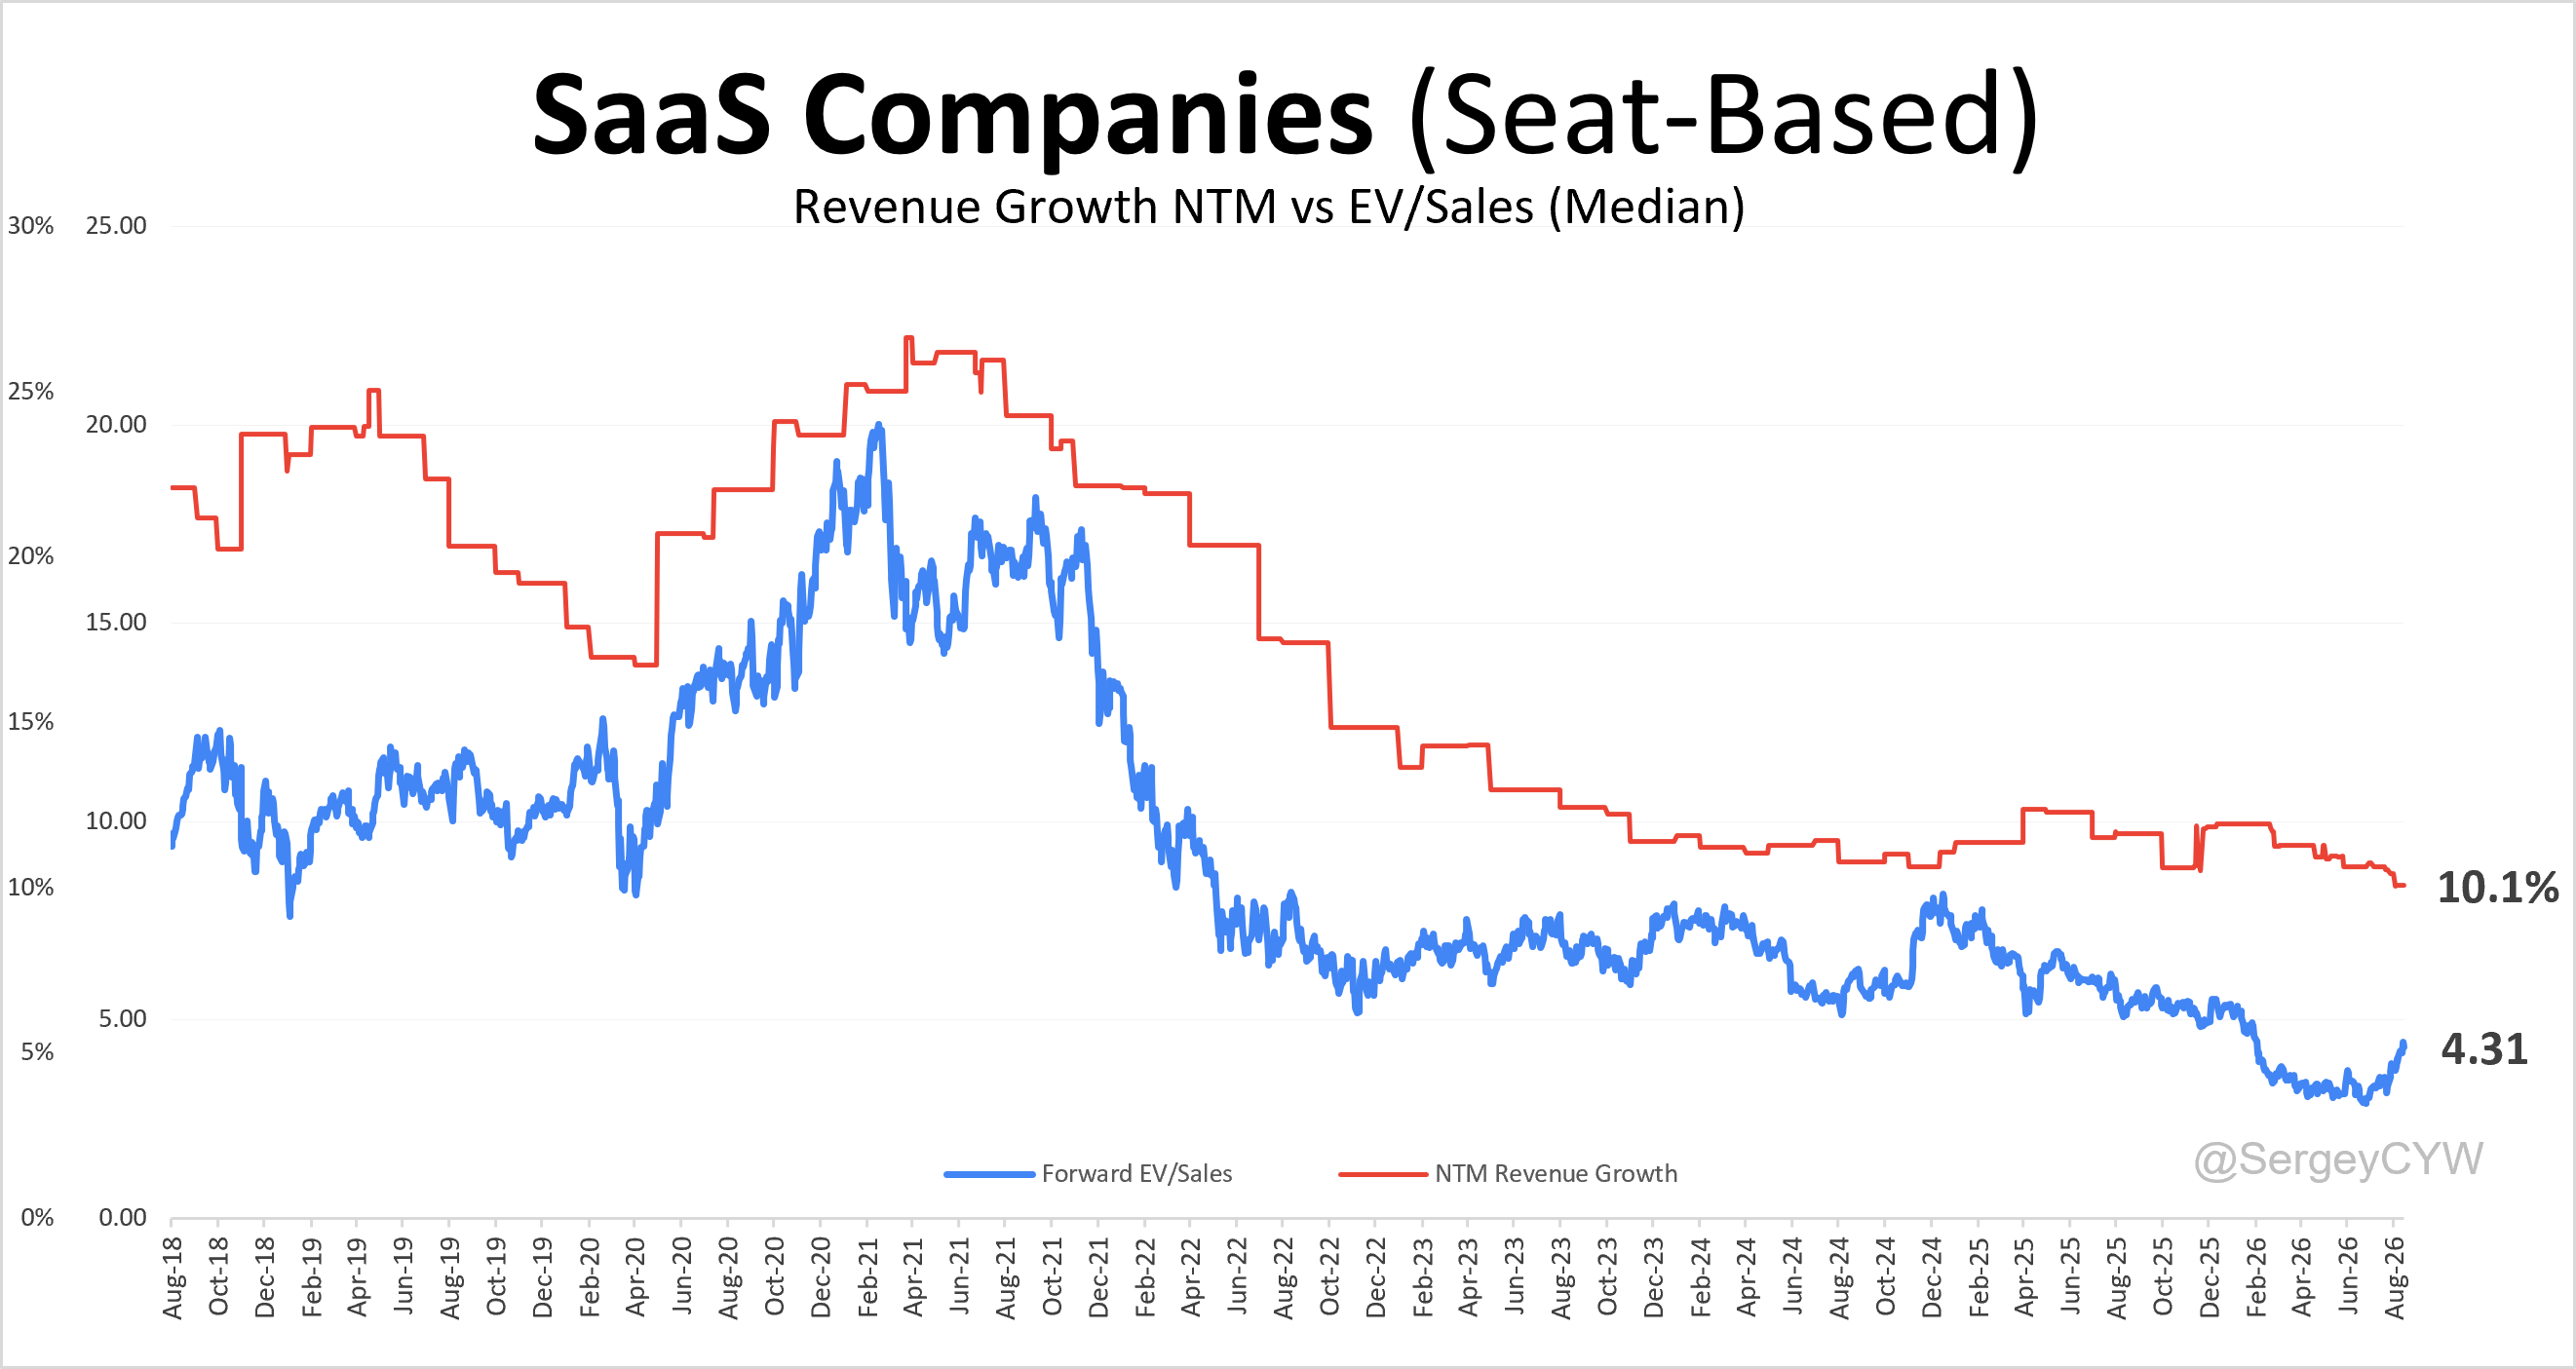
Comparison of median EV/Sales Multiples for subscription-based SaaS companies (including device / fixed-capacity subscriptions and consumption-based models) vs. seat-based subscription SaaS models.
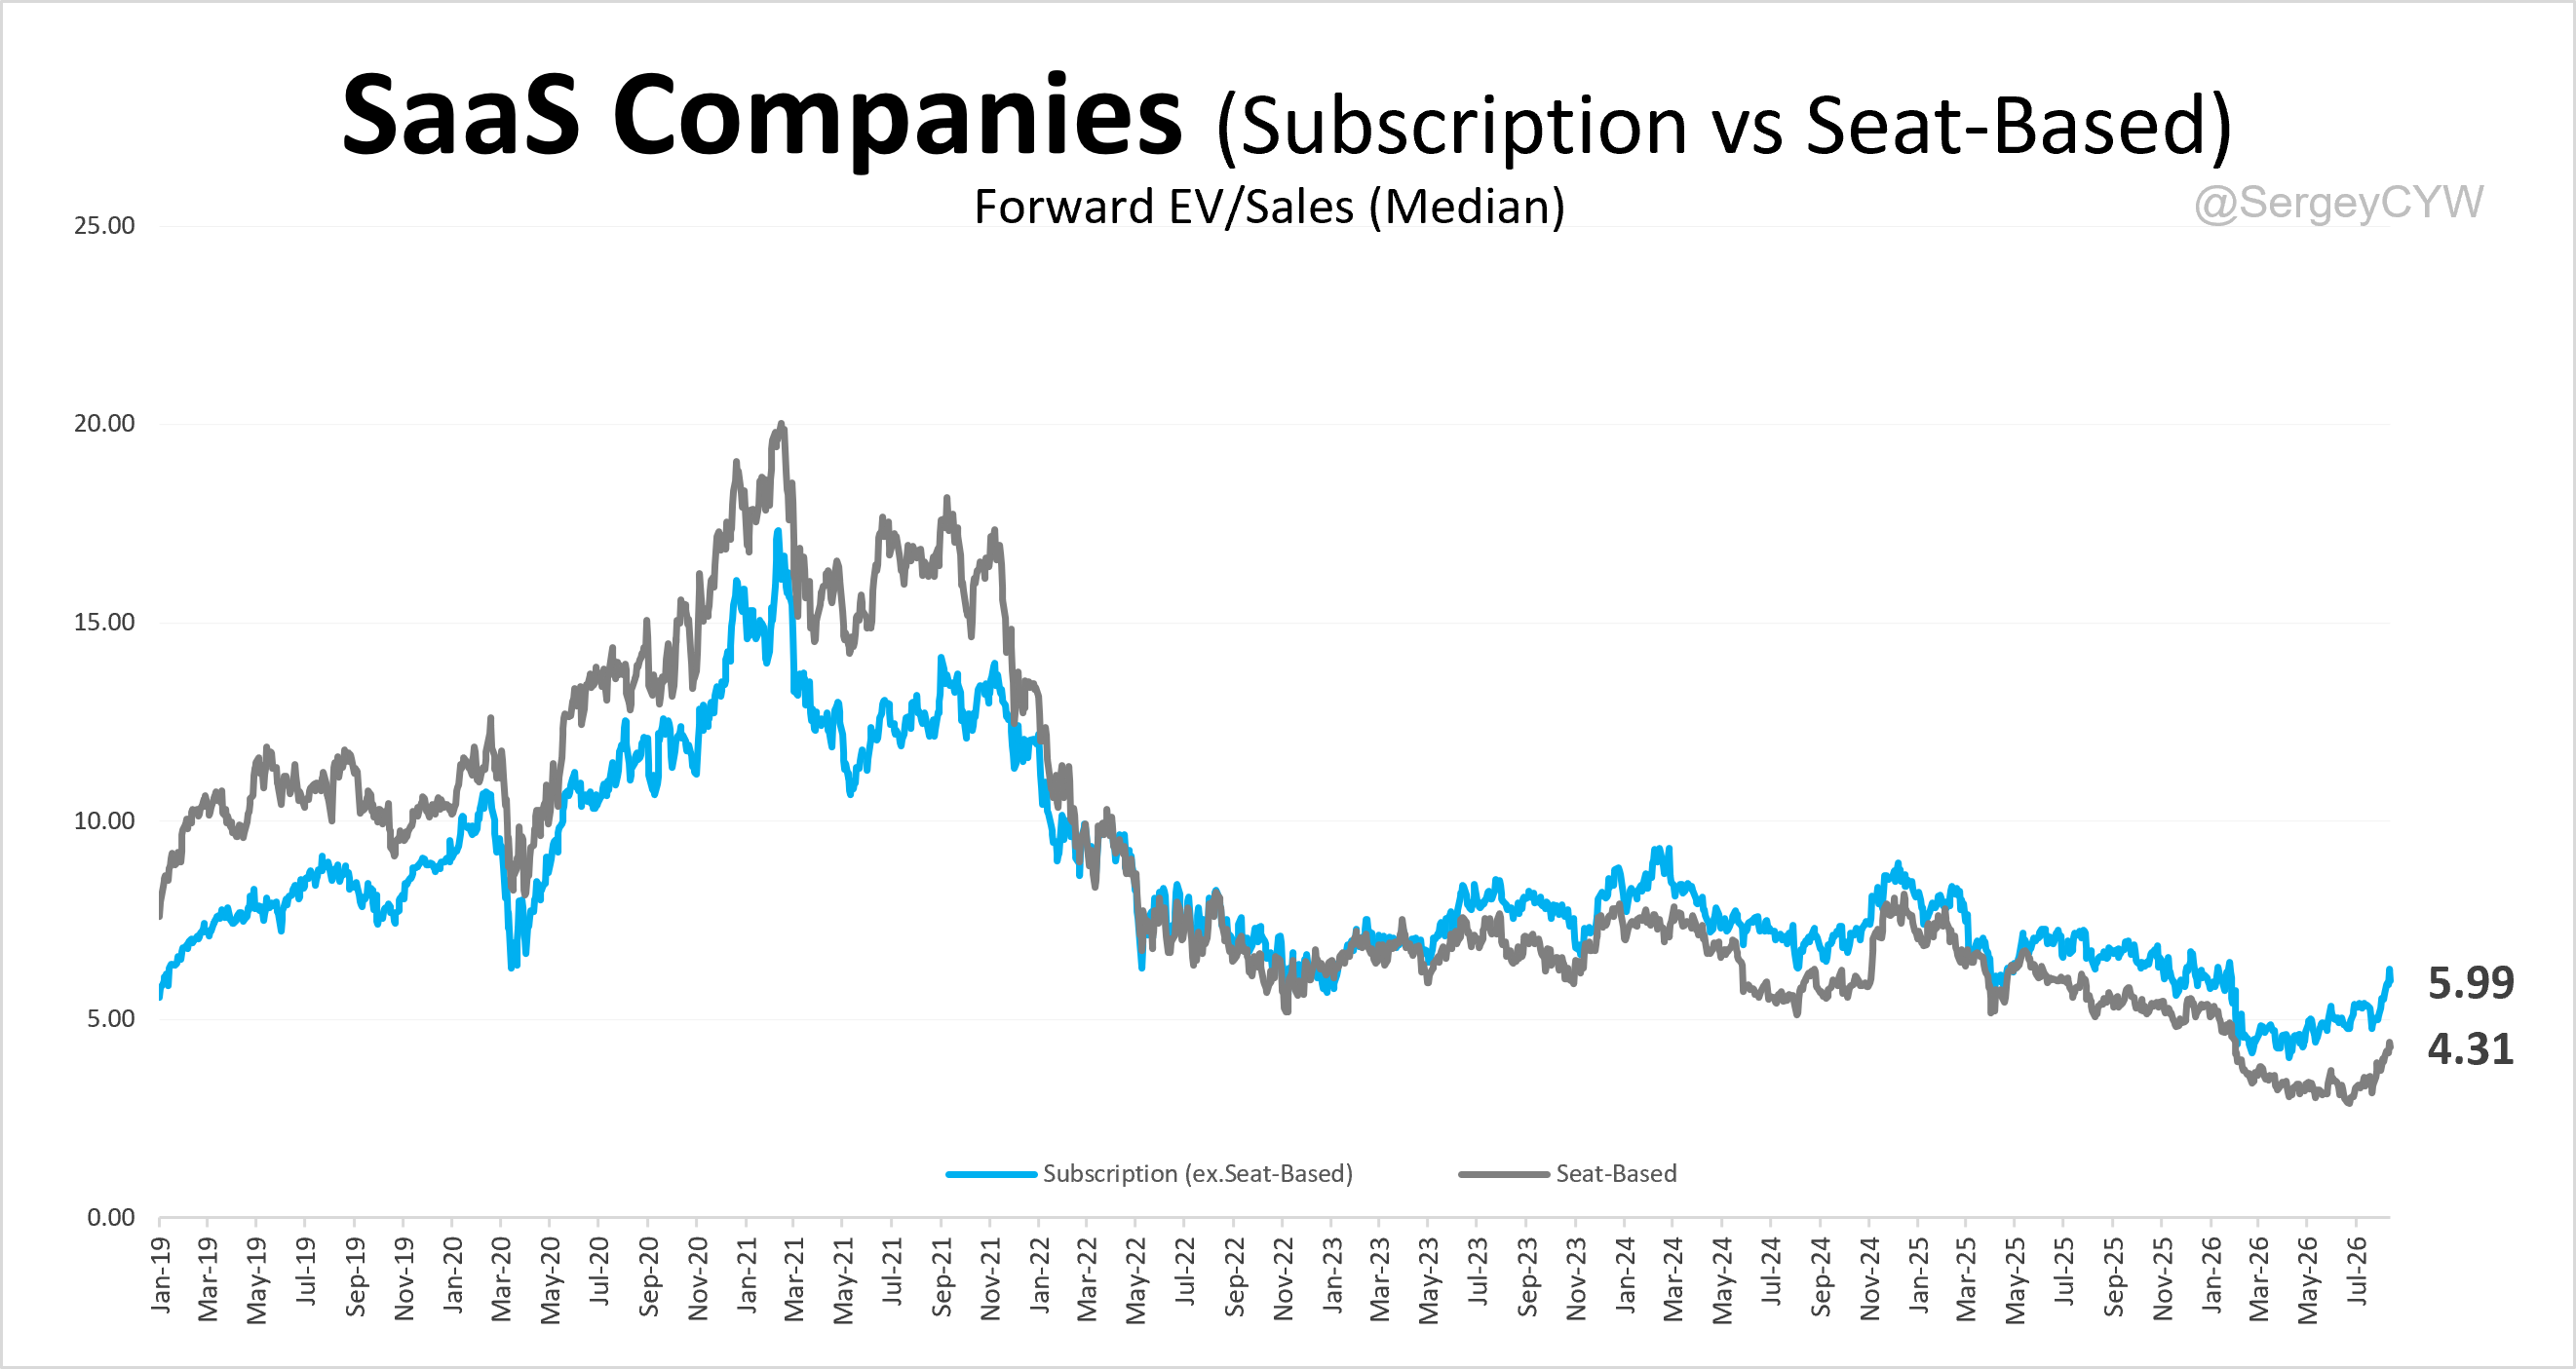
The median EV/Sales multiple for subscription-based SaaS companies (including device / fixed-capacity subscriptions and consumption-based models) is 5.99x, with analyst-estimated NTM revenue growth of 15.1% YoY.
The dataset includes 50 public SaaS companies.
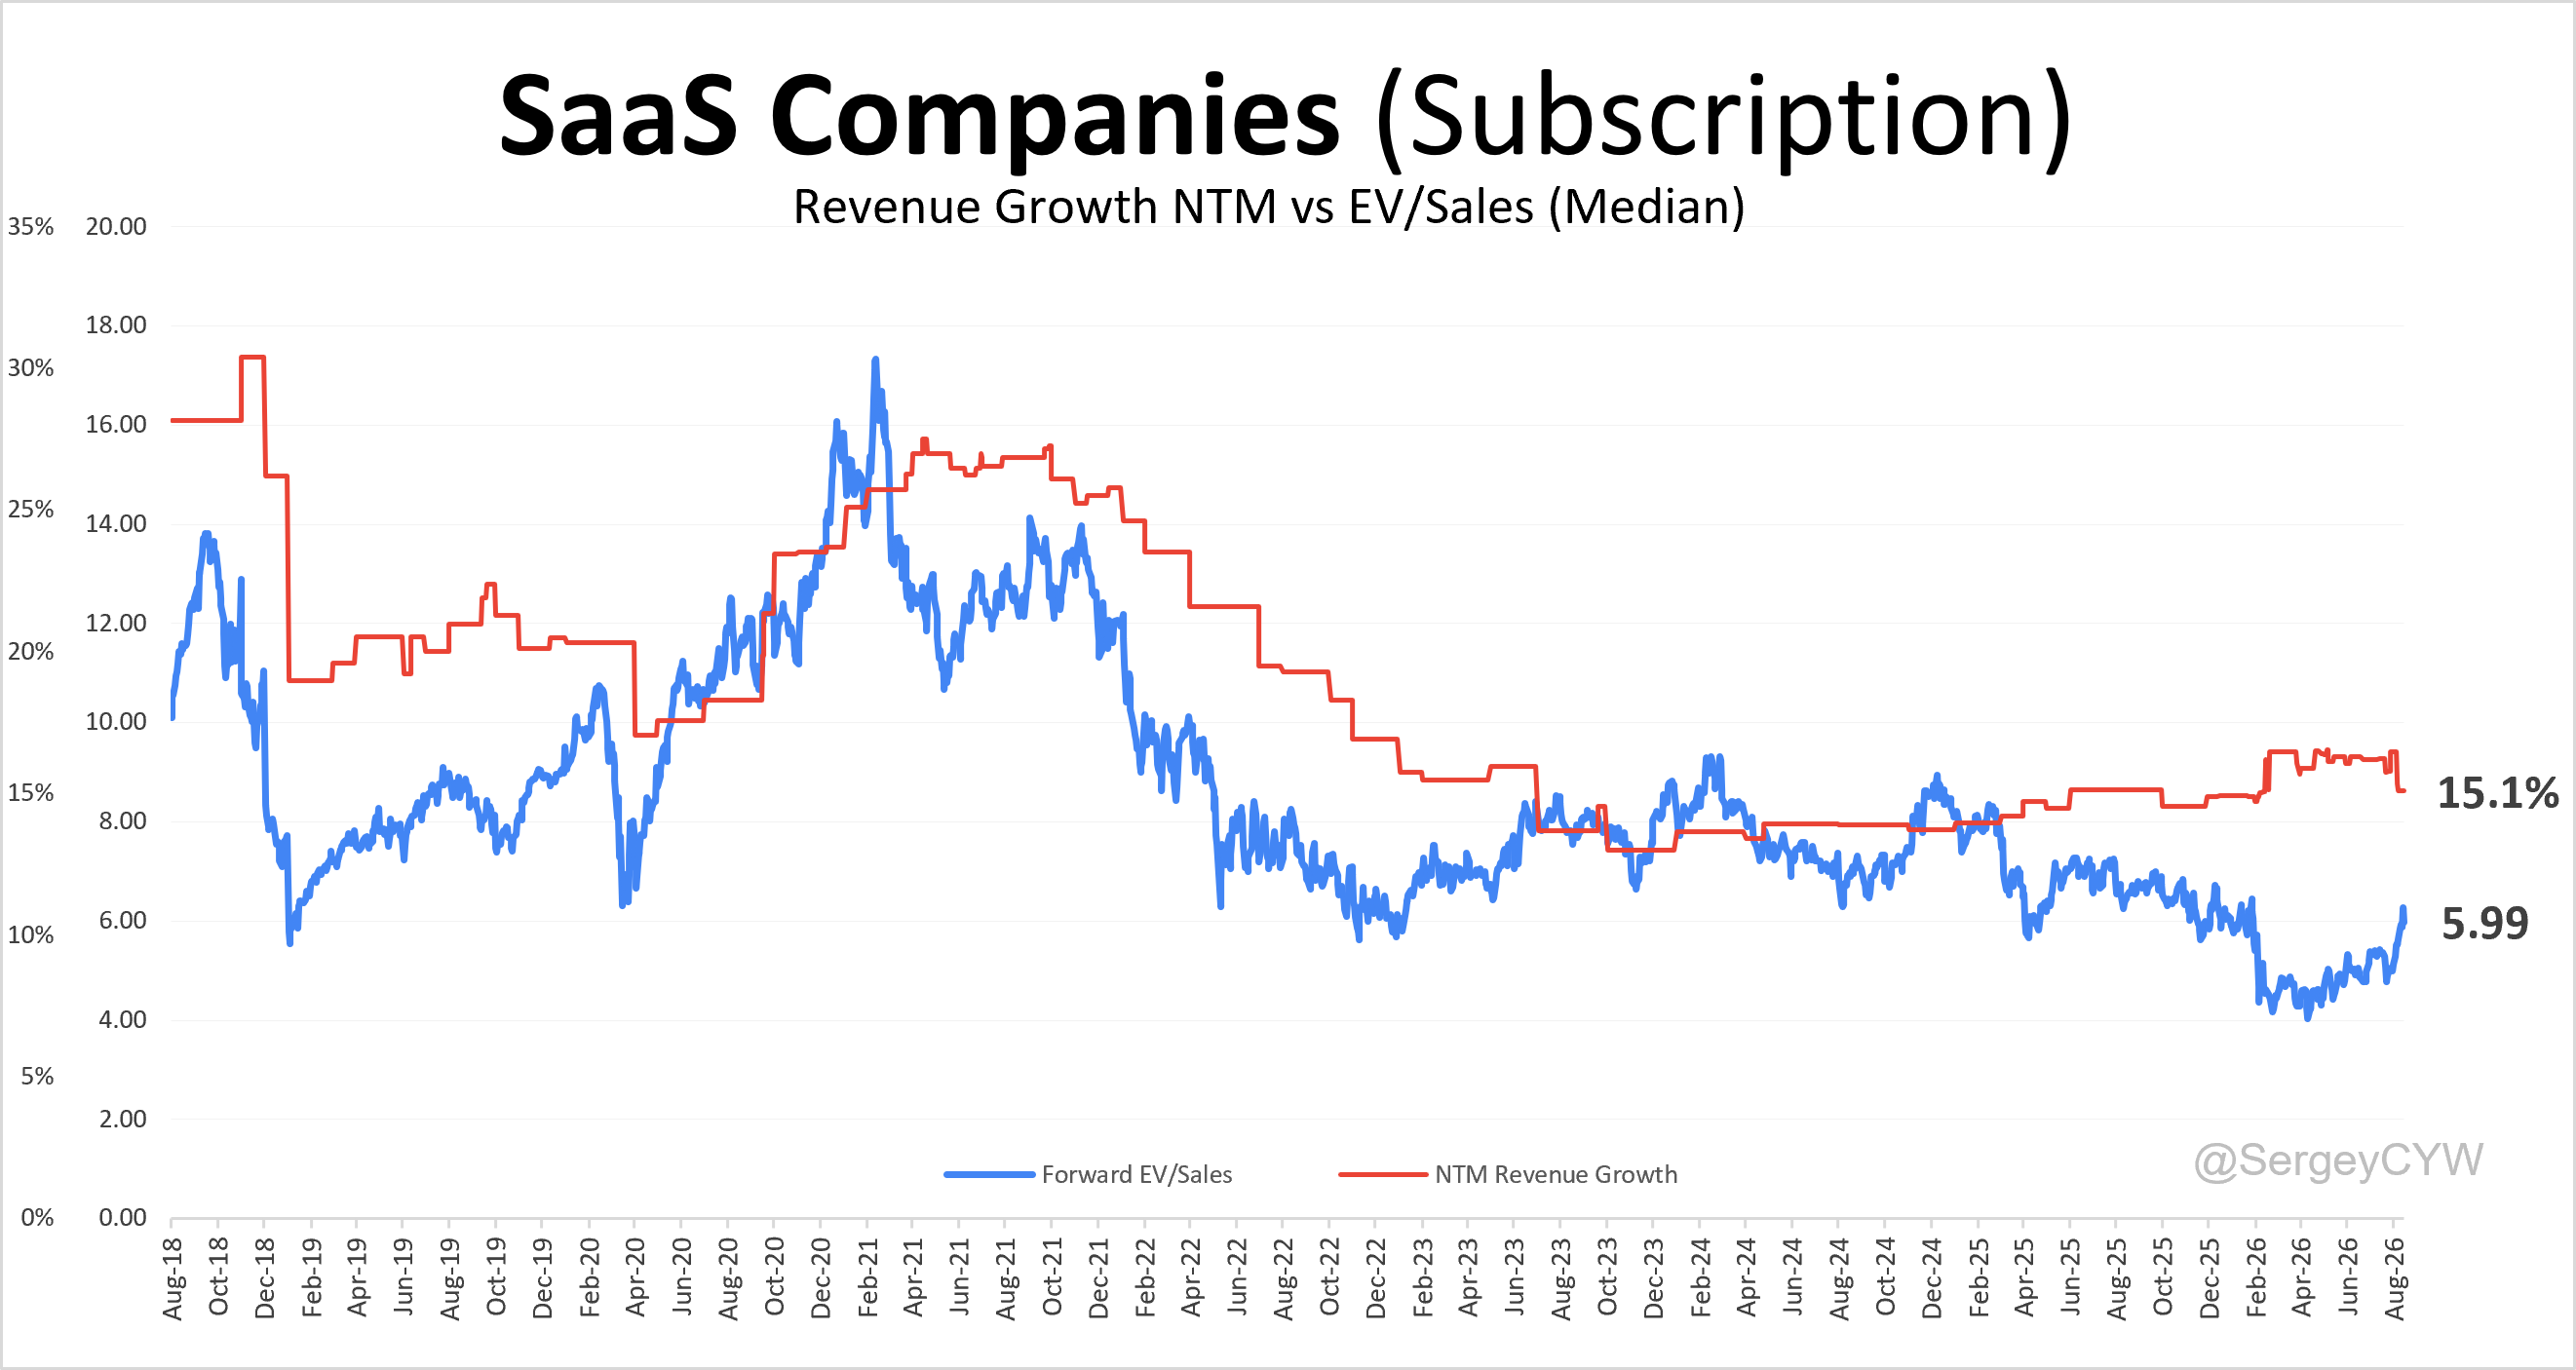
For seat-based subscription SaaS models, the median EV/Sales multiple is 4.31x, paired with 10.1% expected NTM revenue growth.
The dataset includes 36 public SaaS companies.
Stock-Based Compensation (SBC) relative to estimated revenue growth is a key metric for assessing SaaS company efficiency and shareholder dilution.
SBC allows companies to attract top talent and make employees more aligned with long-term performance, since employees become part owners of the company through stock compensation.
But, SBC/Revenue must be managed with discipline. Excessive SBC can significantly dilute shareholders and reduce earnings per share, so maintaining the right balance is important.
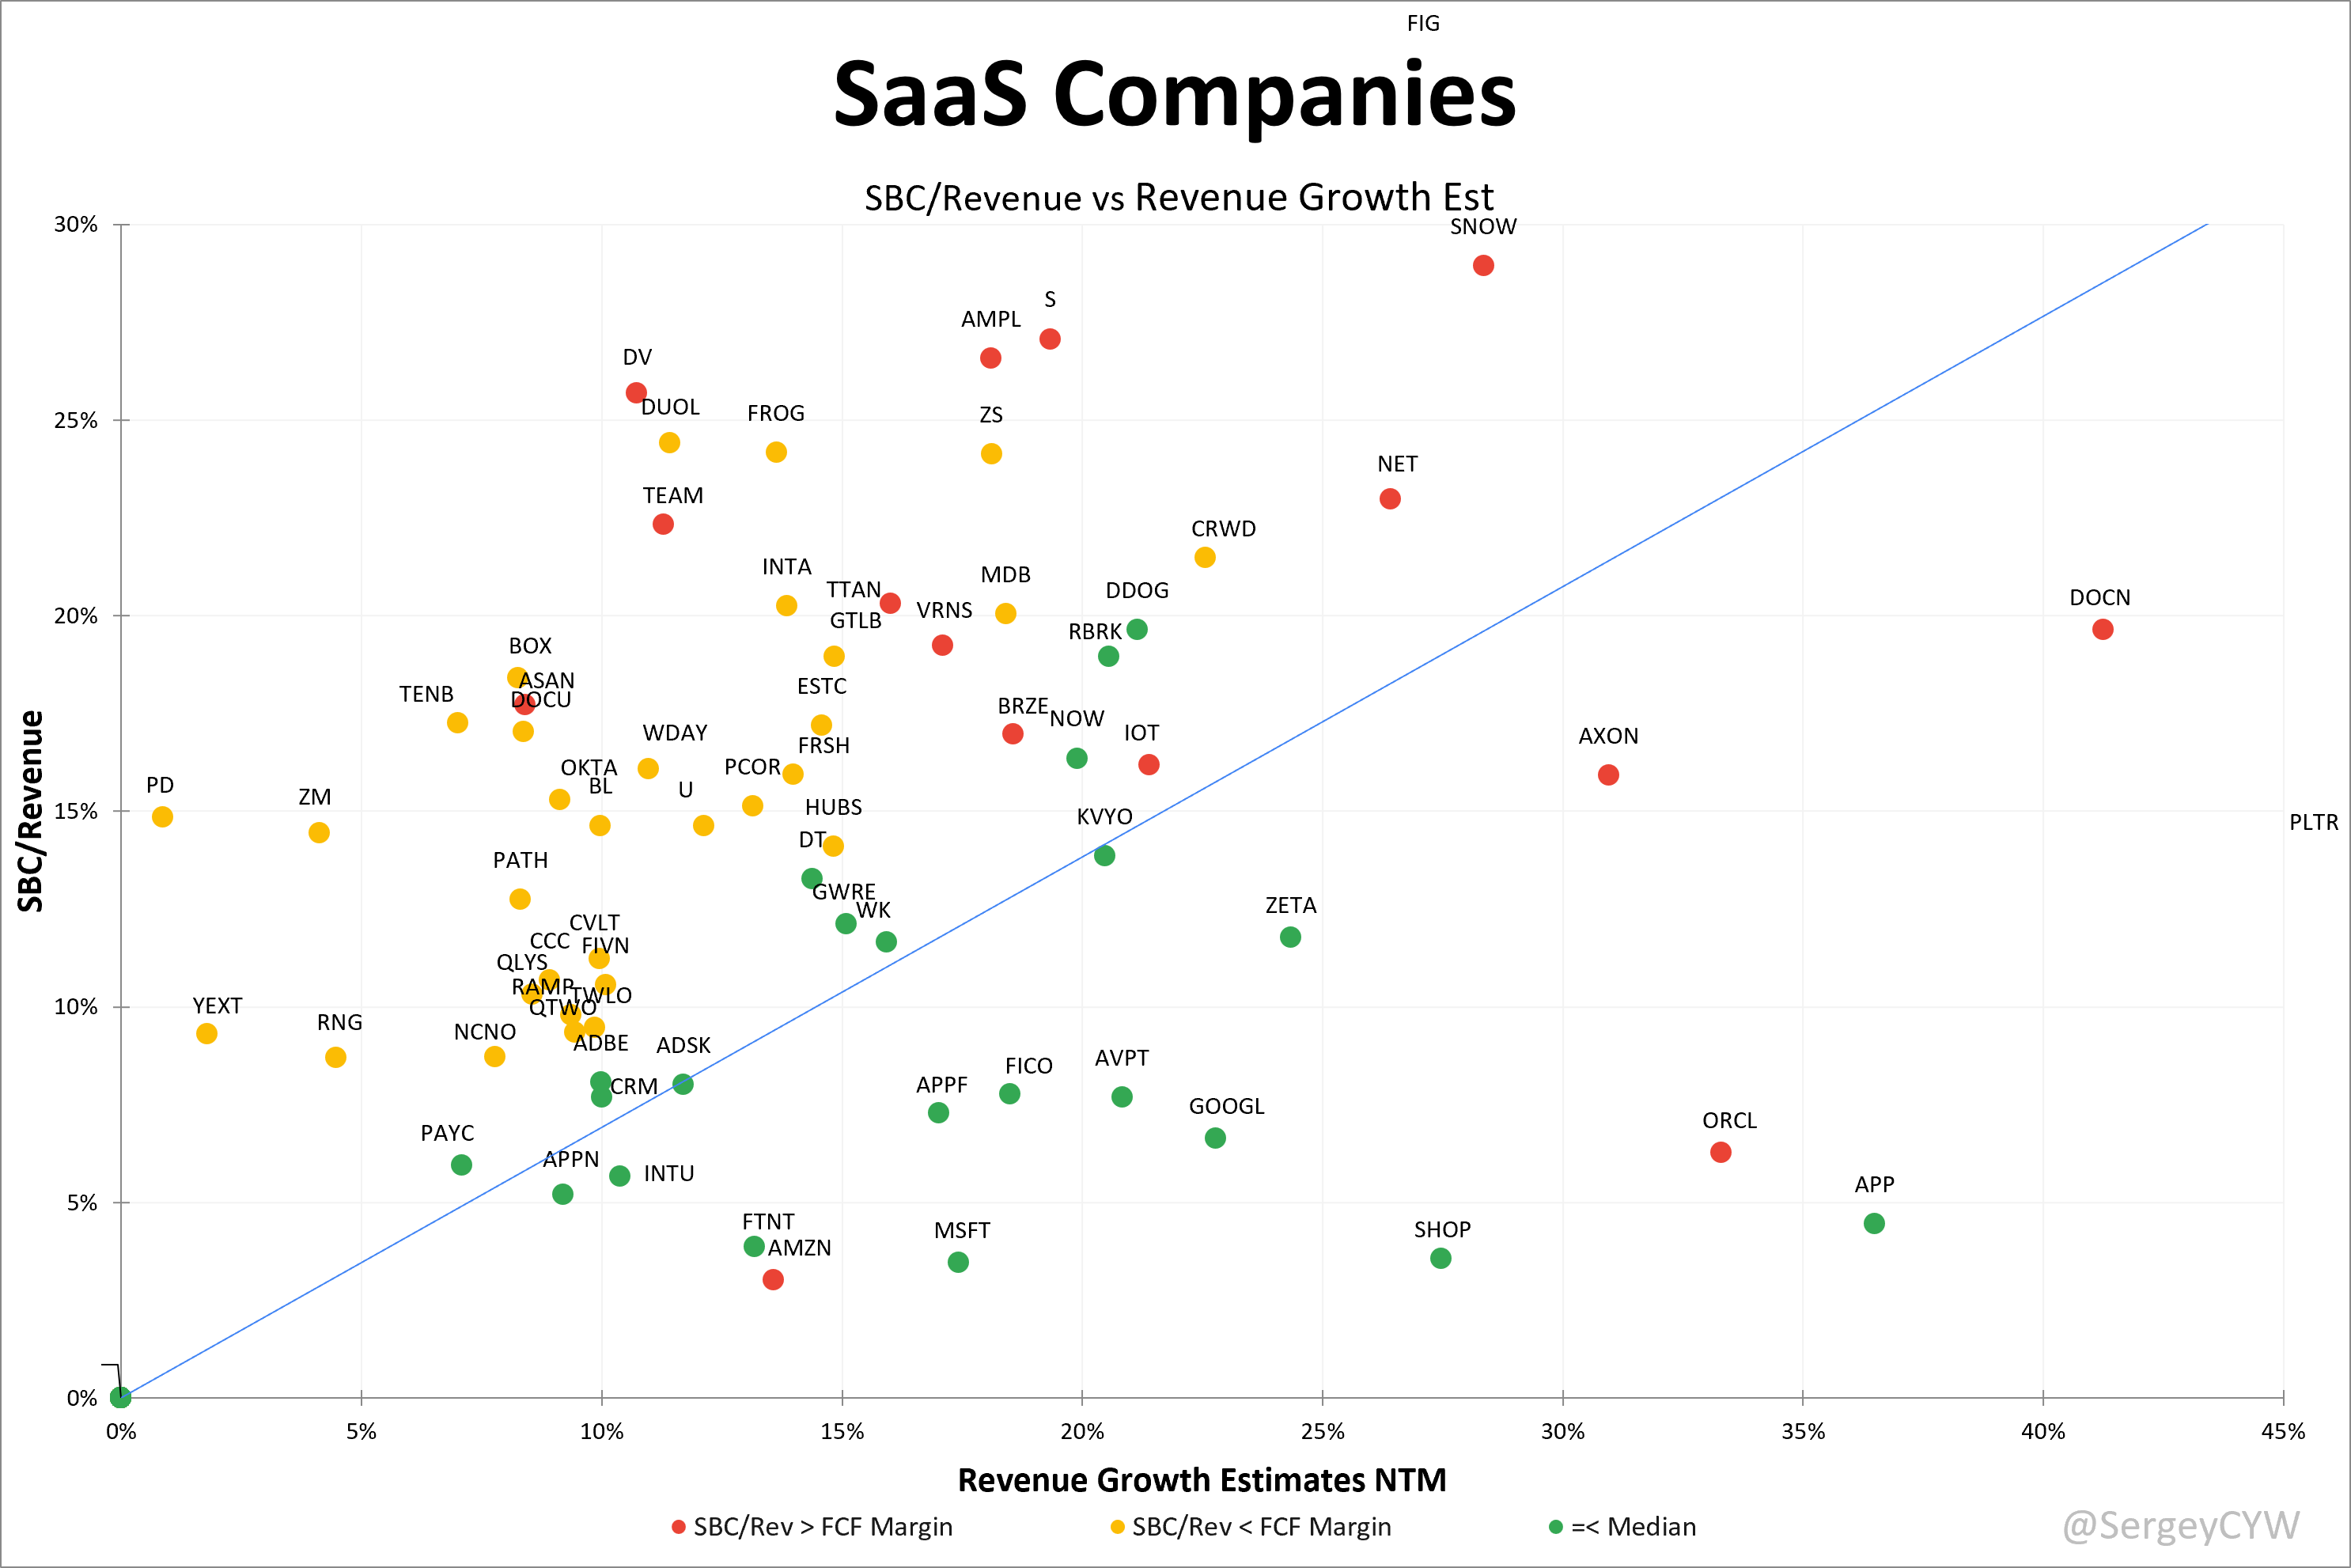
On the chart:
Red: SBC/Revenue > Free Cash Flow (FCF) margin
Yellow: SBC/Revenue < FCF margin
Green: SBC/Revenue =< Median
Outstanding share growth matters more than the absolute SBC expense because it directly reflects the erosion of shareholder ownership.
By comparing outstanding share count growth directly against estimated revenue growth, we can clearly see what portion of expected revenue expansion will be absorbed by dilution.
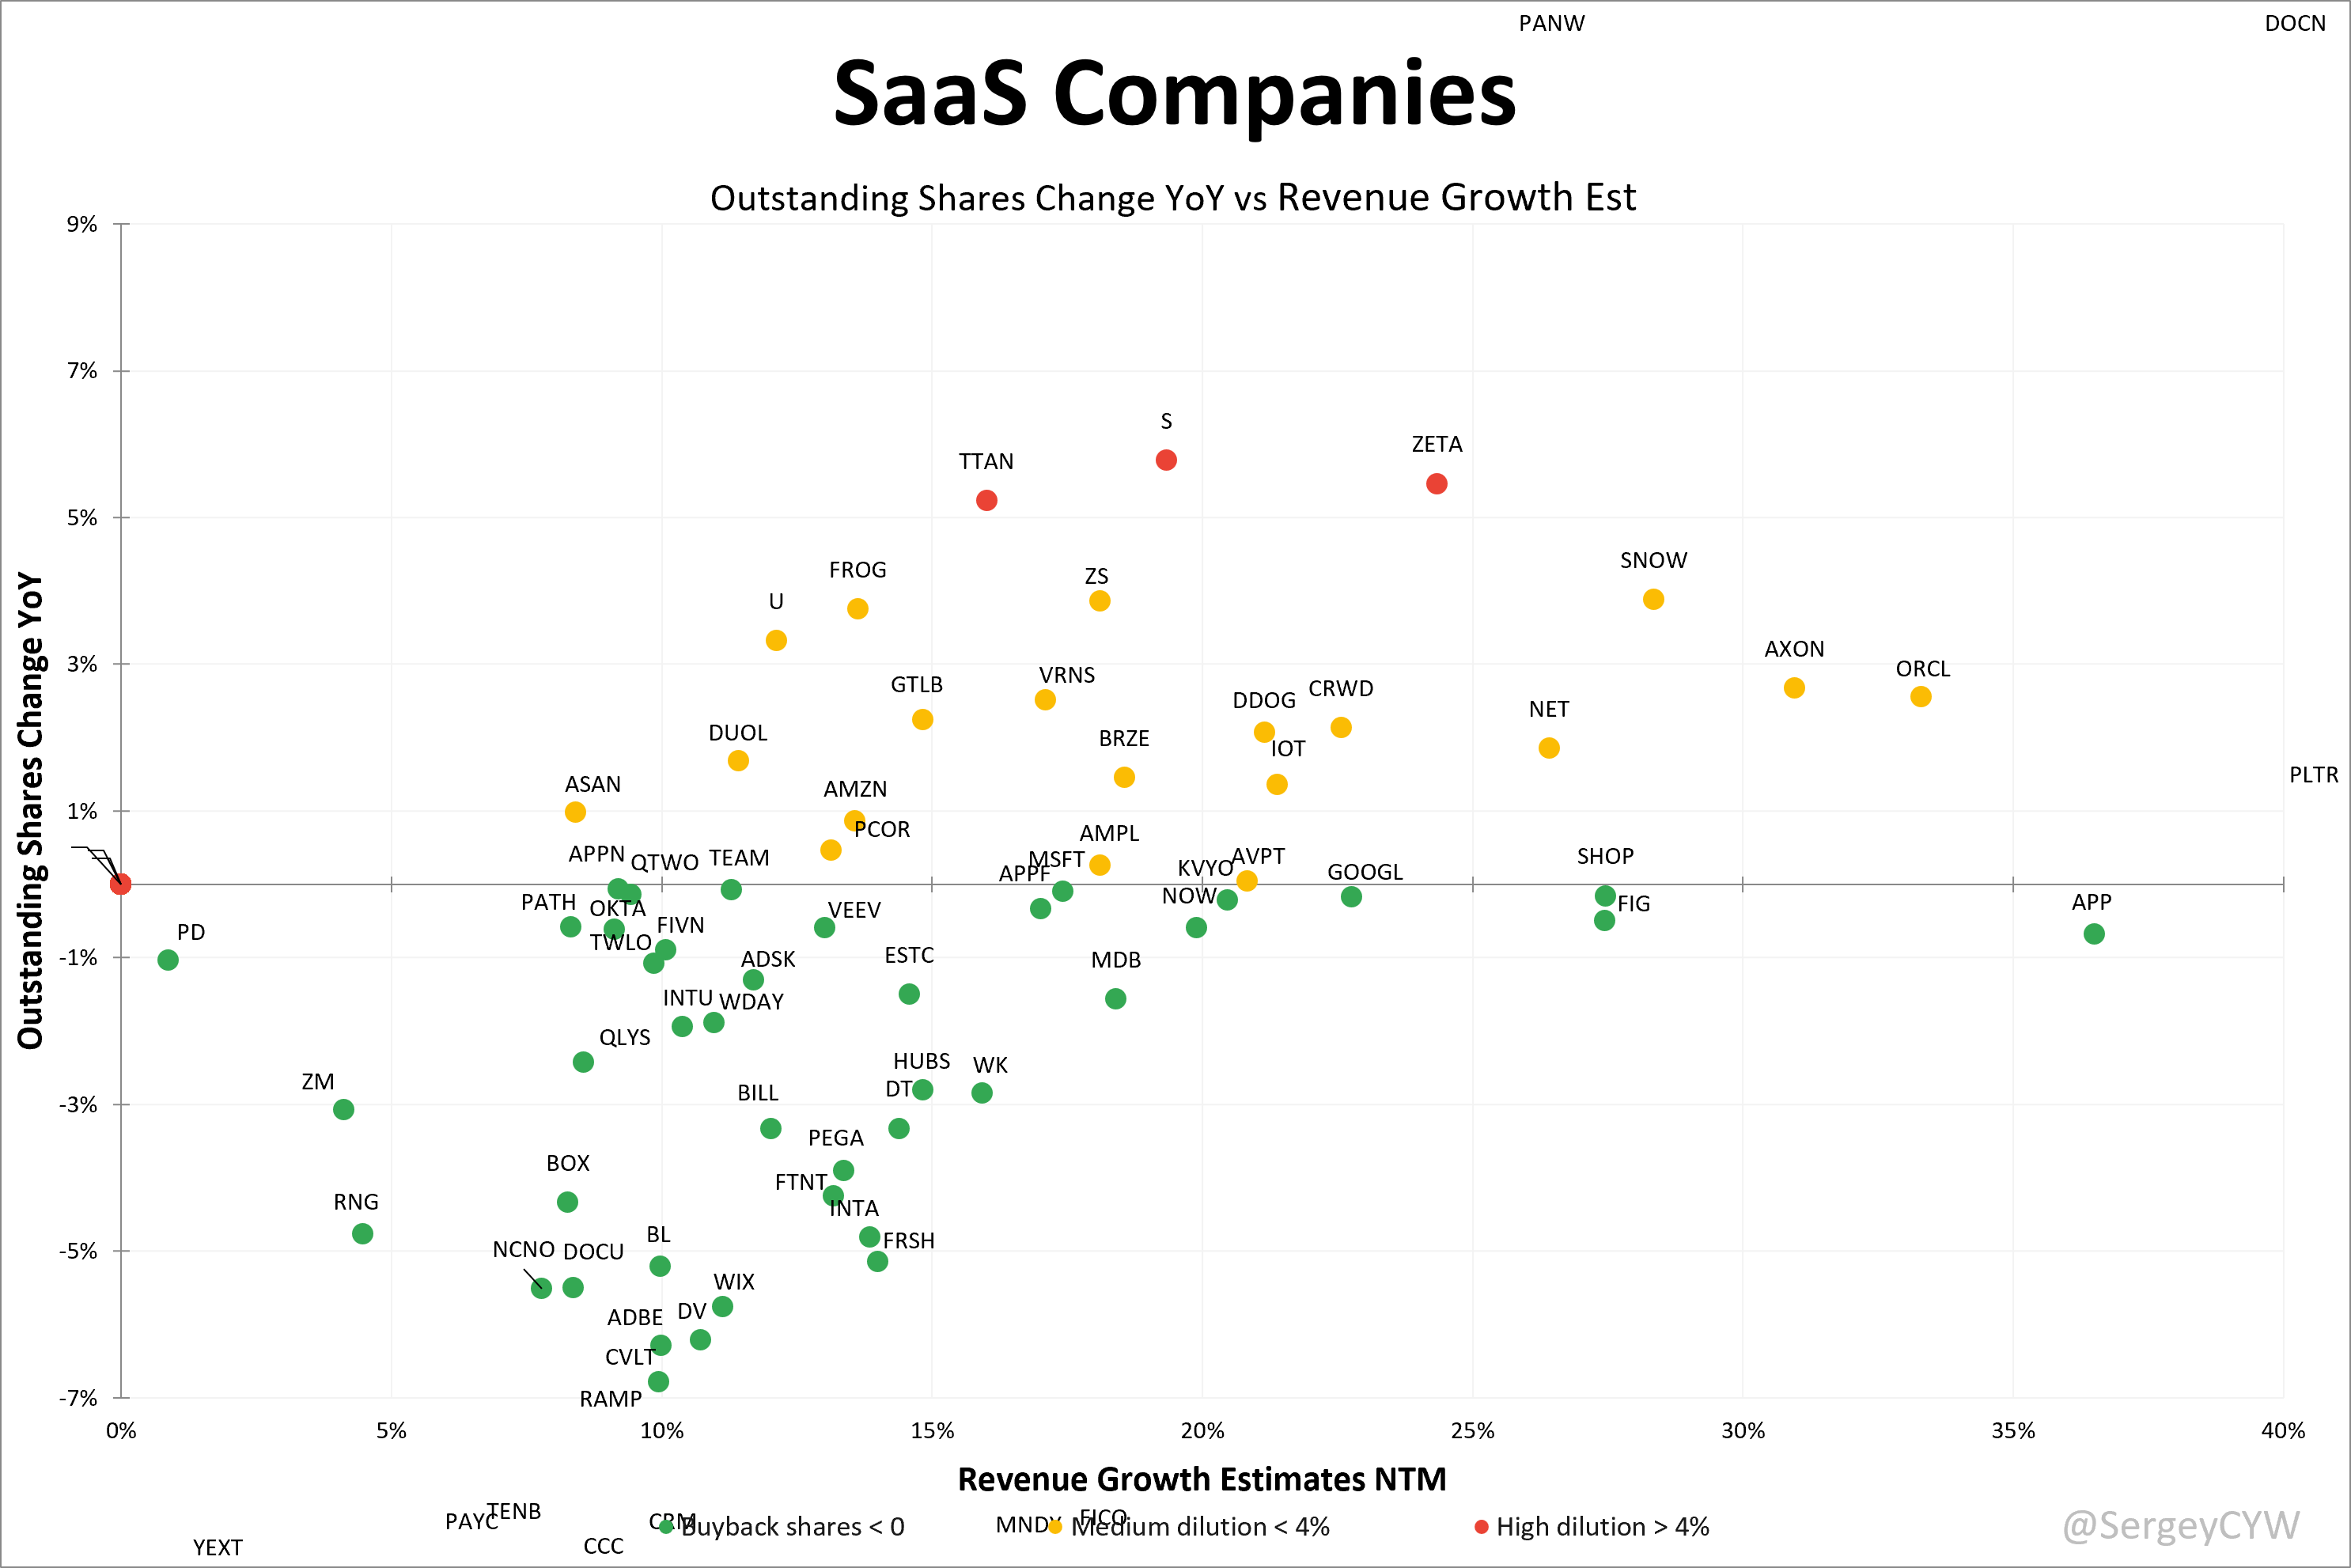
On the chart:
• Companies that buy back shares are marked in green
• Moderate dilution under 4% YoY is marked in yellow
• High dilution above 4% YoY is marked in red
Thank you for reading!
Follow me for more frequent updates on X/Twitter and Threads, and on LinkedIn. For visual infographics, check out Instagram, and for portfolio changes, follow me on SavvyTrader.
Disclaimer: This earnings review is for informational purposes only and does not constitute financial, investment, or trading advice.
Comments
Nothing yet. Say the first thing.
Sign in to join the conversation.