
Detailed Earnings Analysis:
Palantir PLTR 0.00%↑ .
Earnings Snapshot:
Grab GRAB 0.00%↑ .
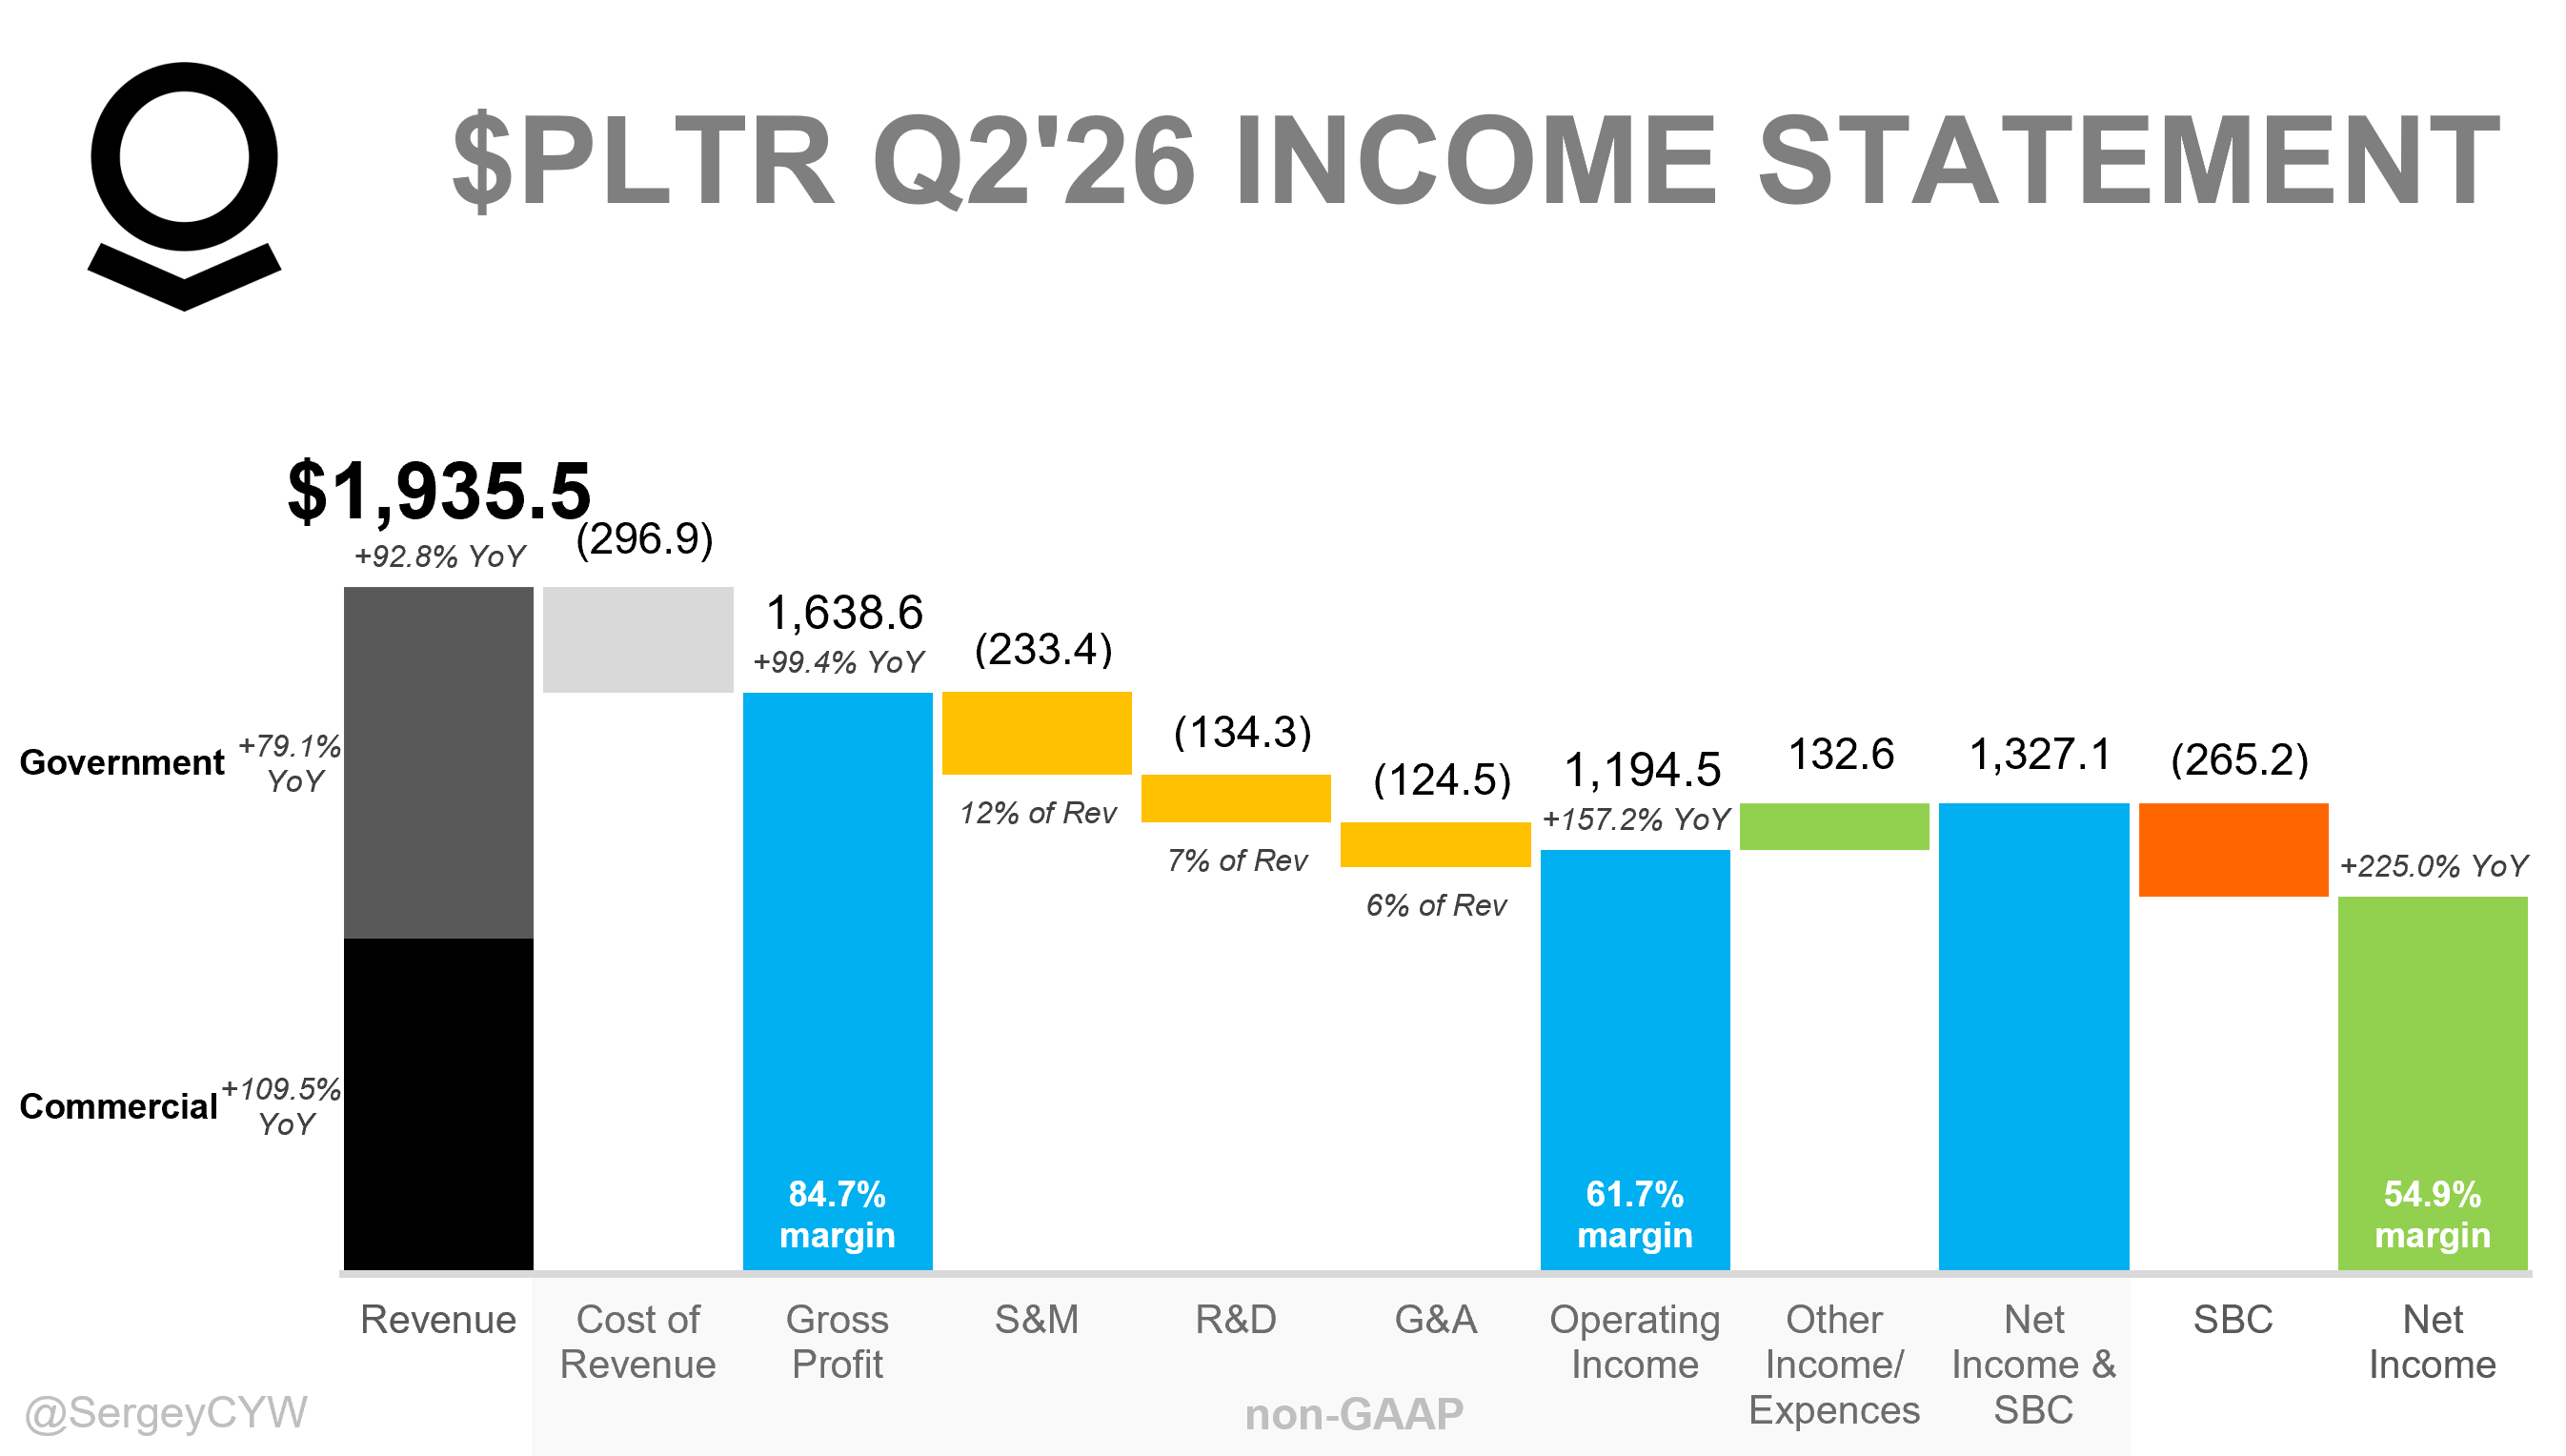
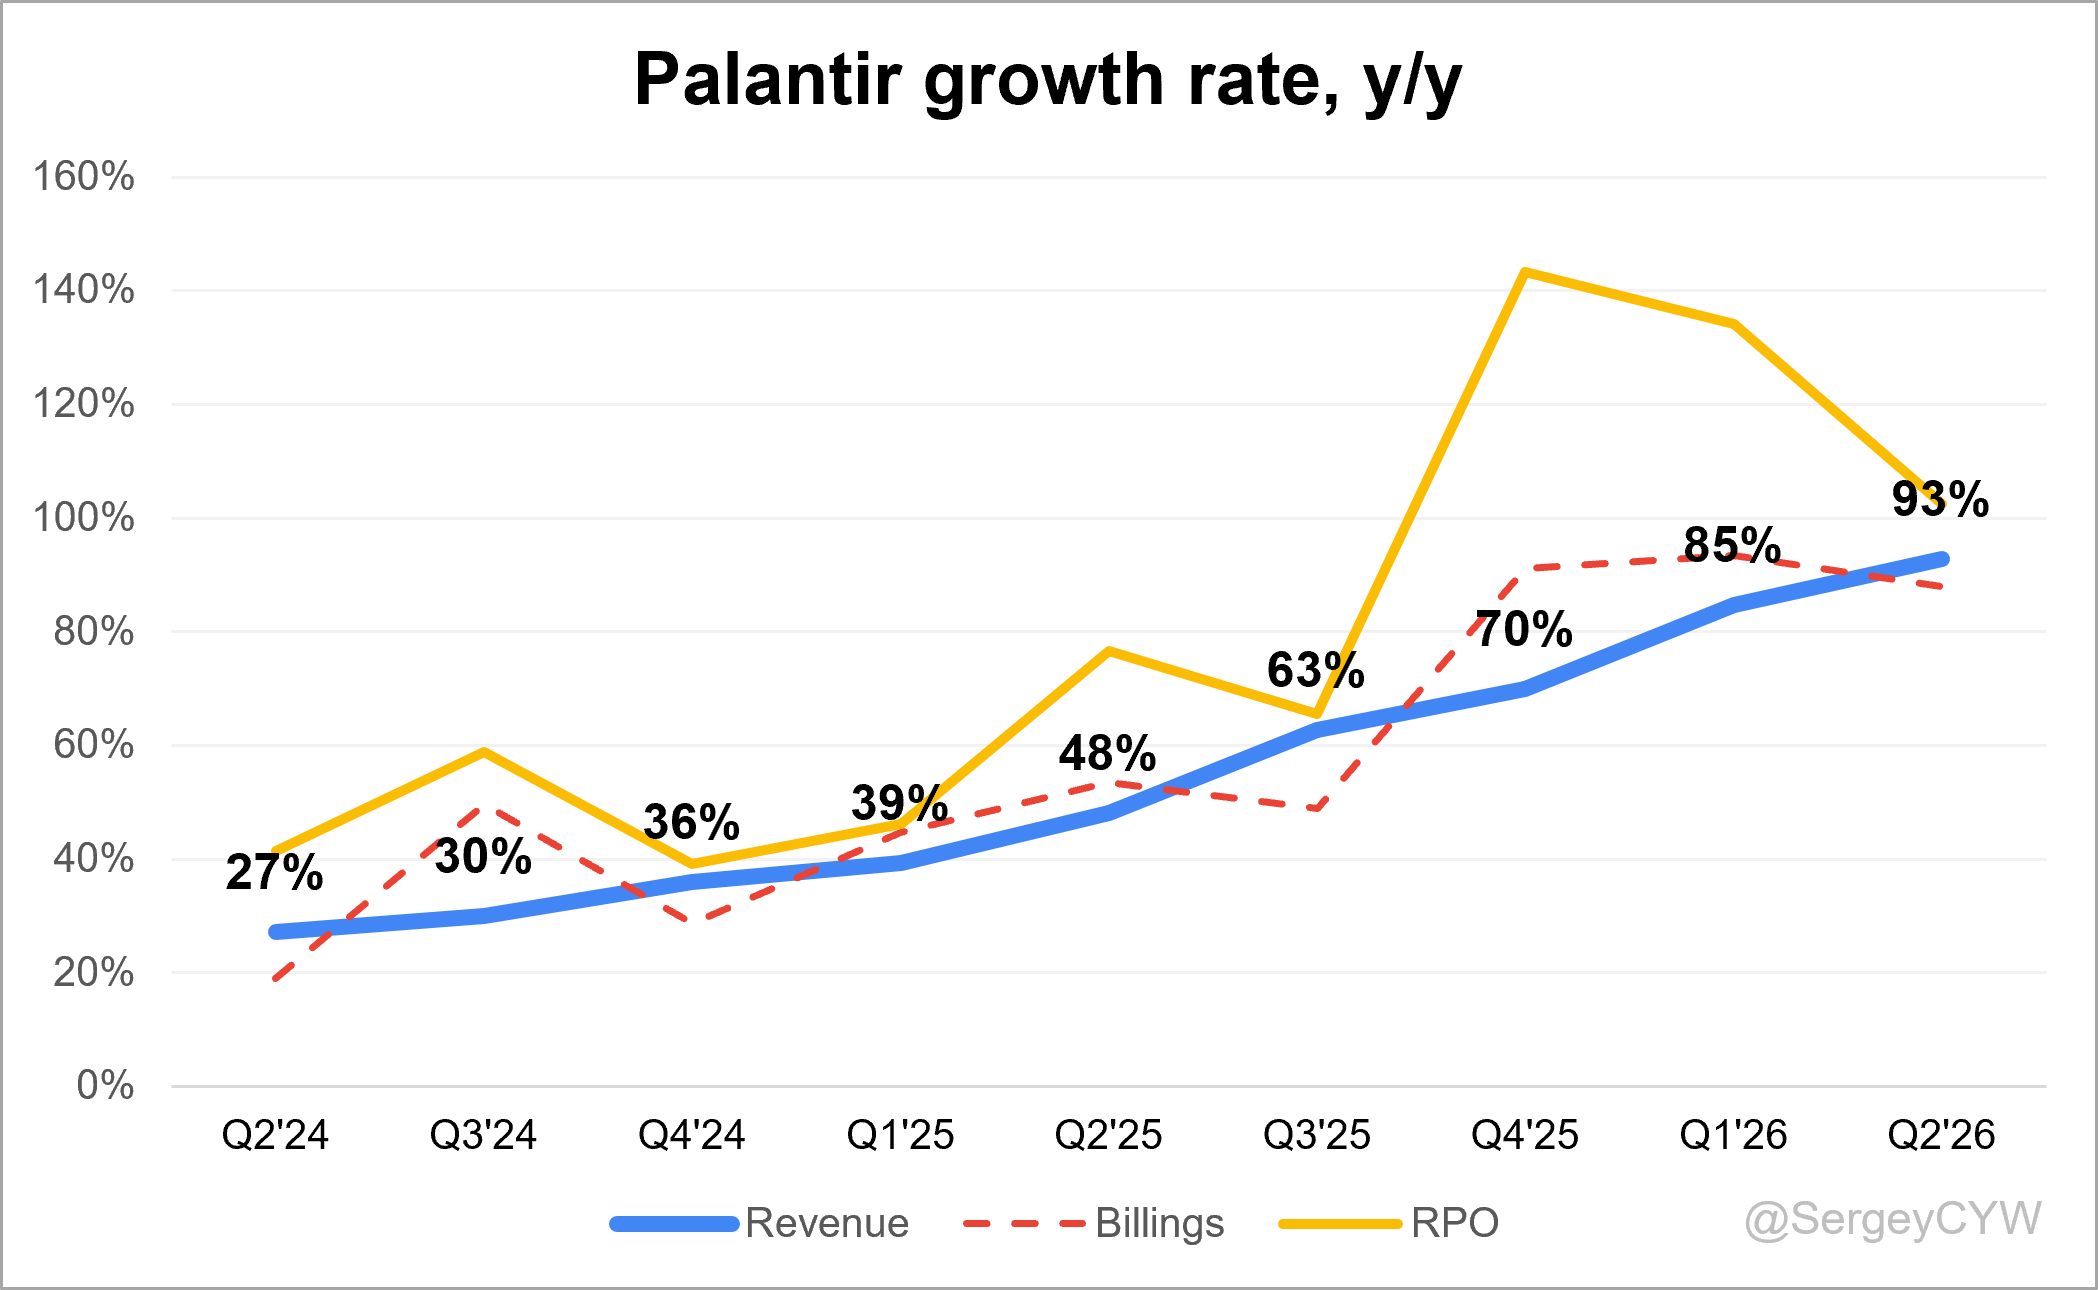
↗️$1,936M rev2+92.8% YoY, +18.6% QoQ) beat est by 7.5%
↗️Gross Margin* (84.7%, +2.8 PPs YoY)
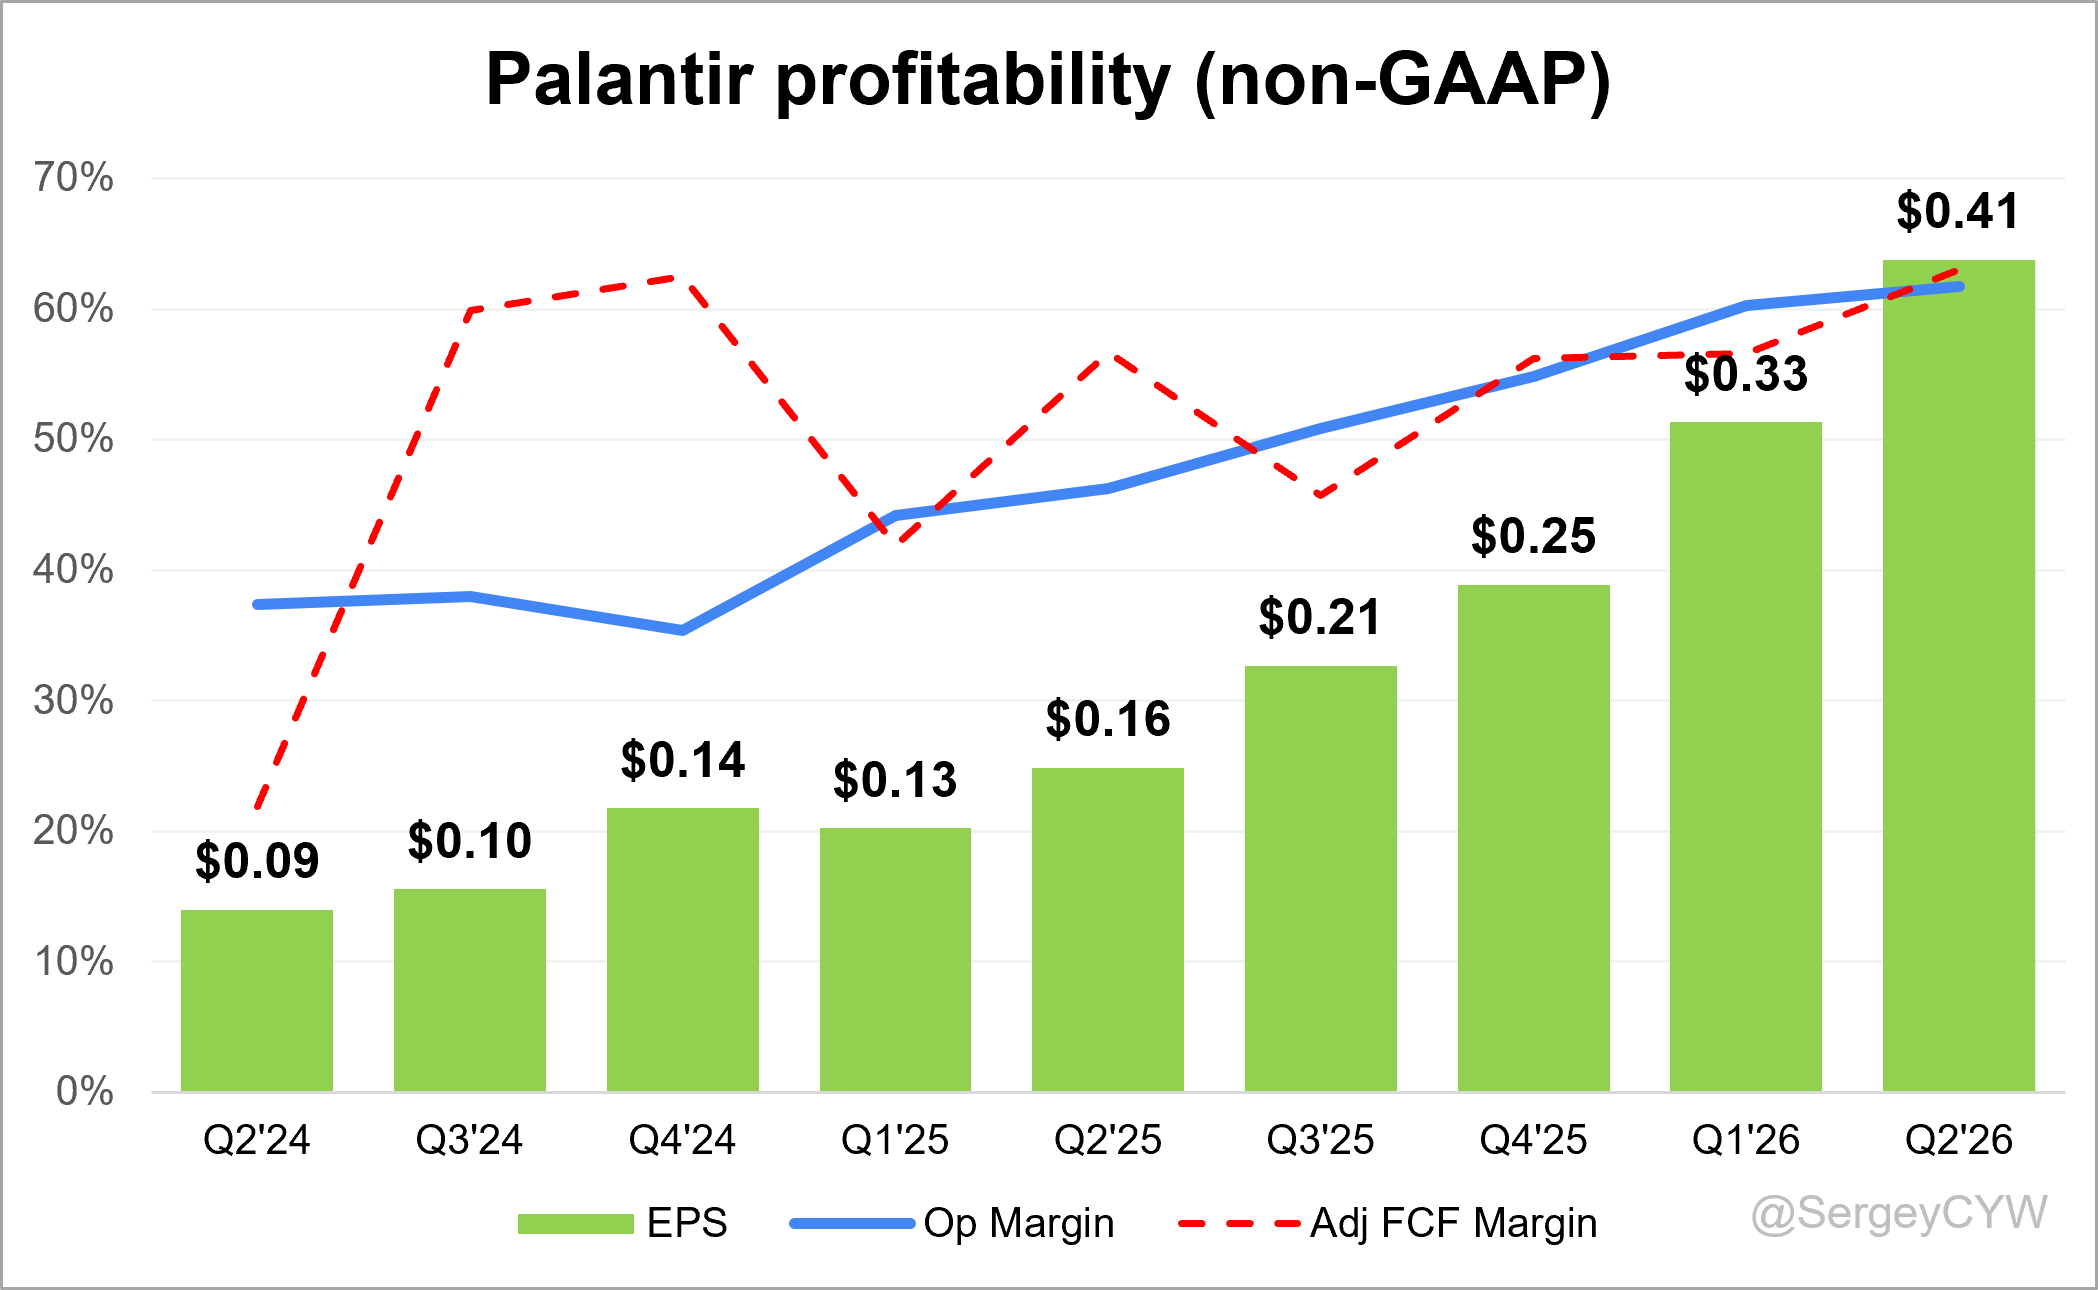
↗️Operating Margin* (61.7%, +15.5 PPs YoY)🟢
↗️Adj FCF Margin (63.1%, +6.4 PPs YoY)🟢
↗️Net Margin (54.9%, +22.3 PPs YoY)🟢
↗️EPS* $0.41 beat est by 20.6%🟢
*non-GAAP
Revenue By Type
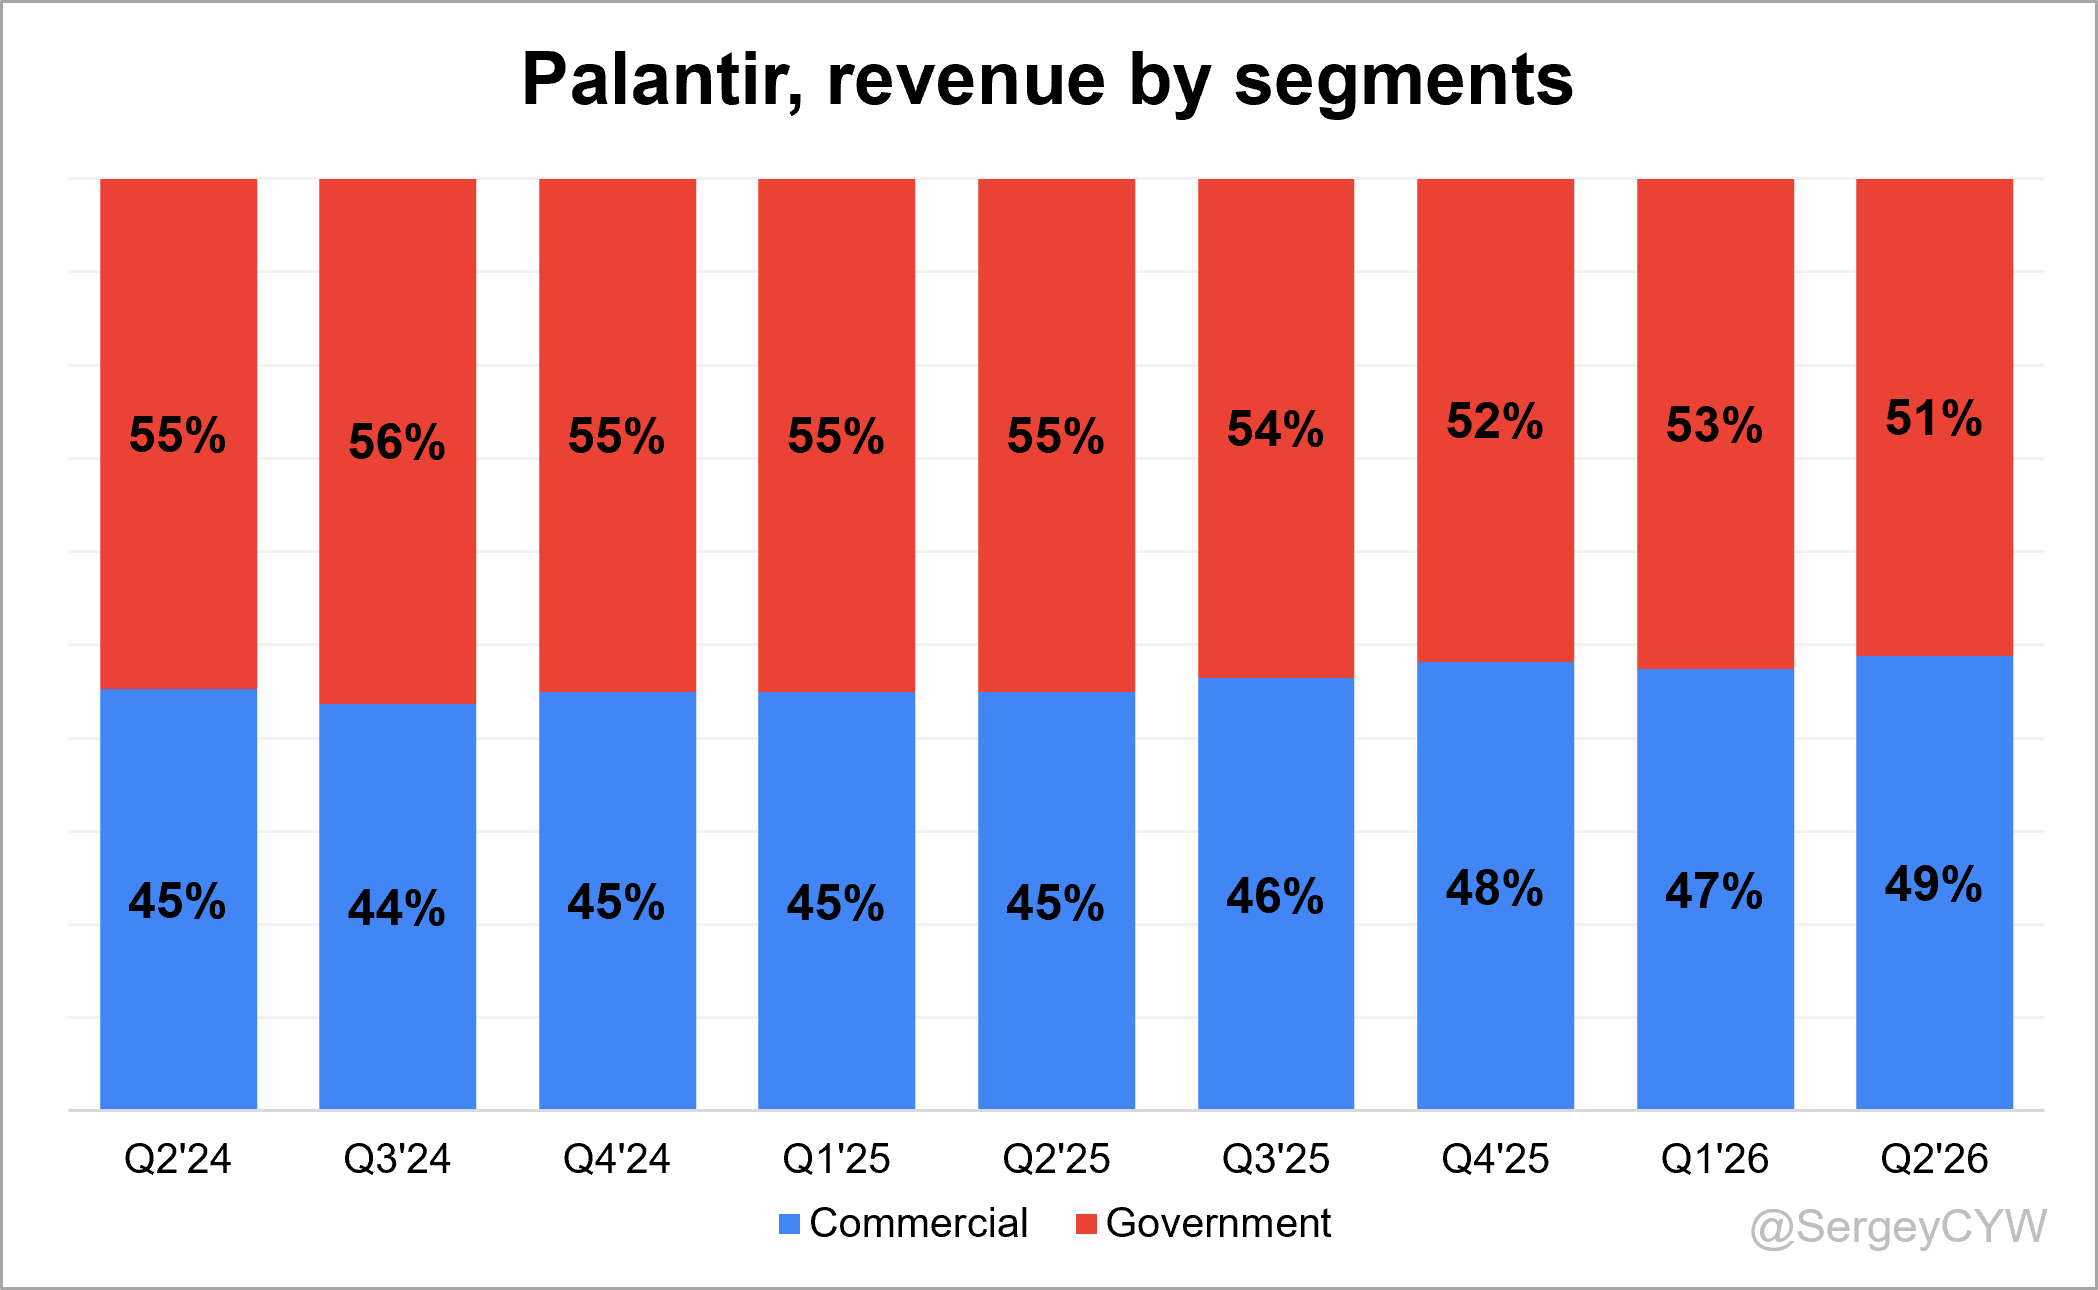
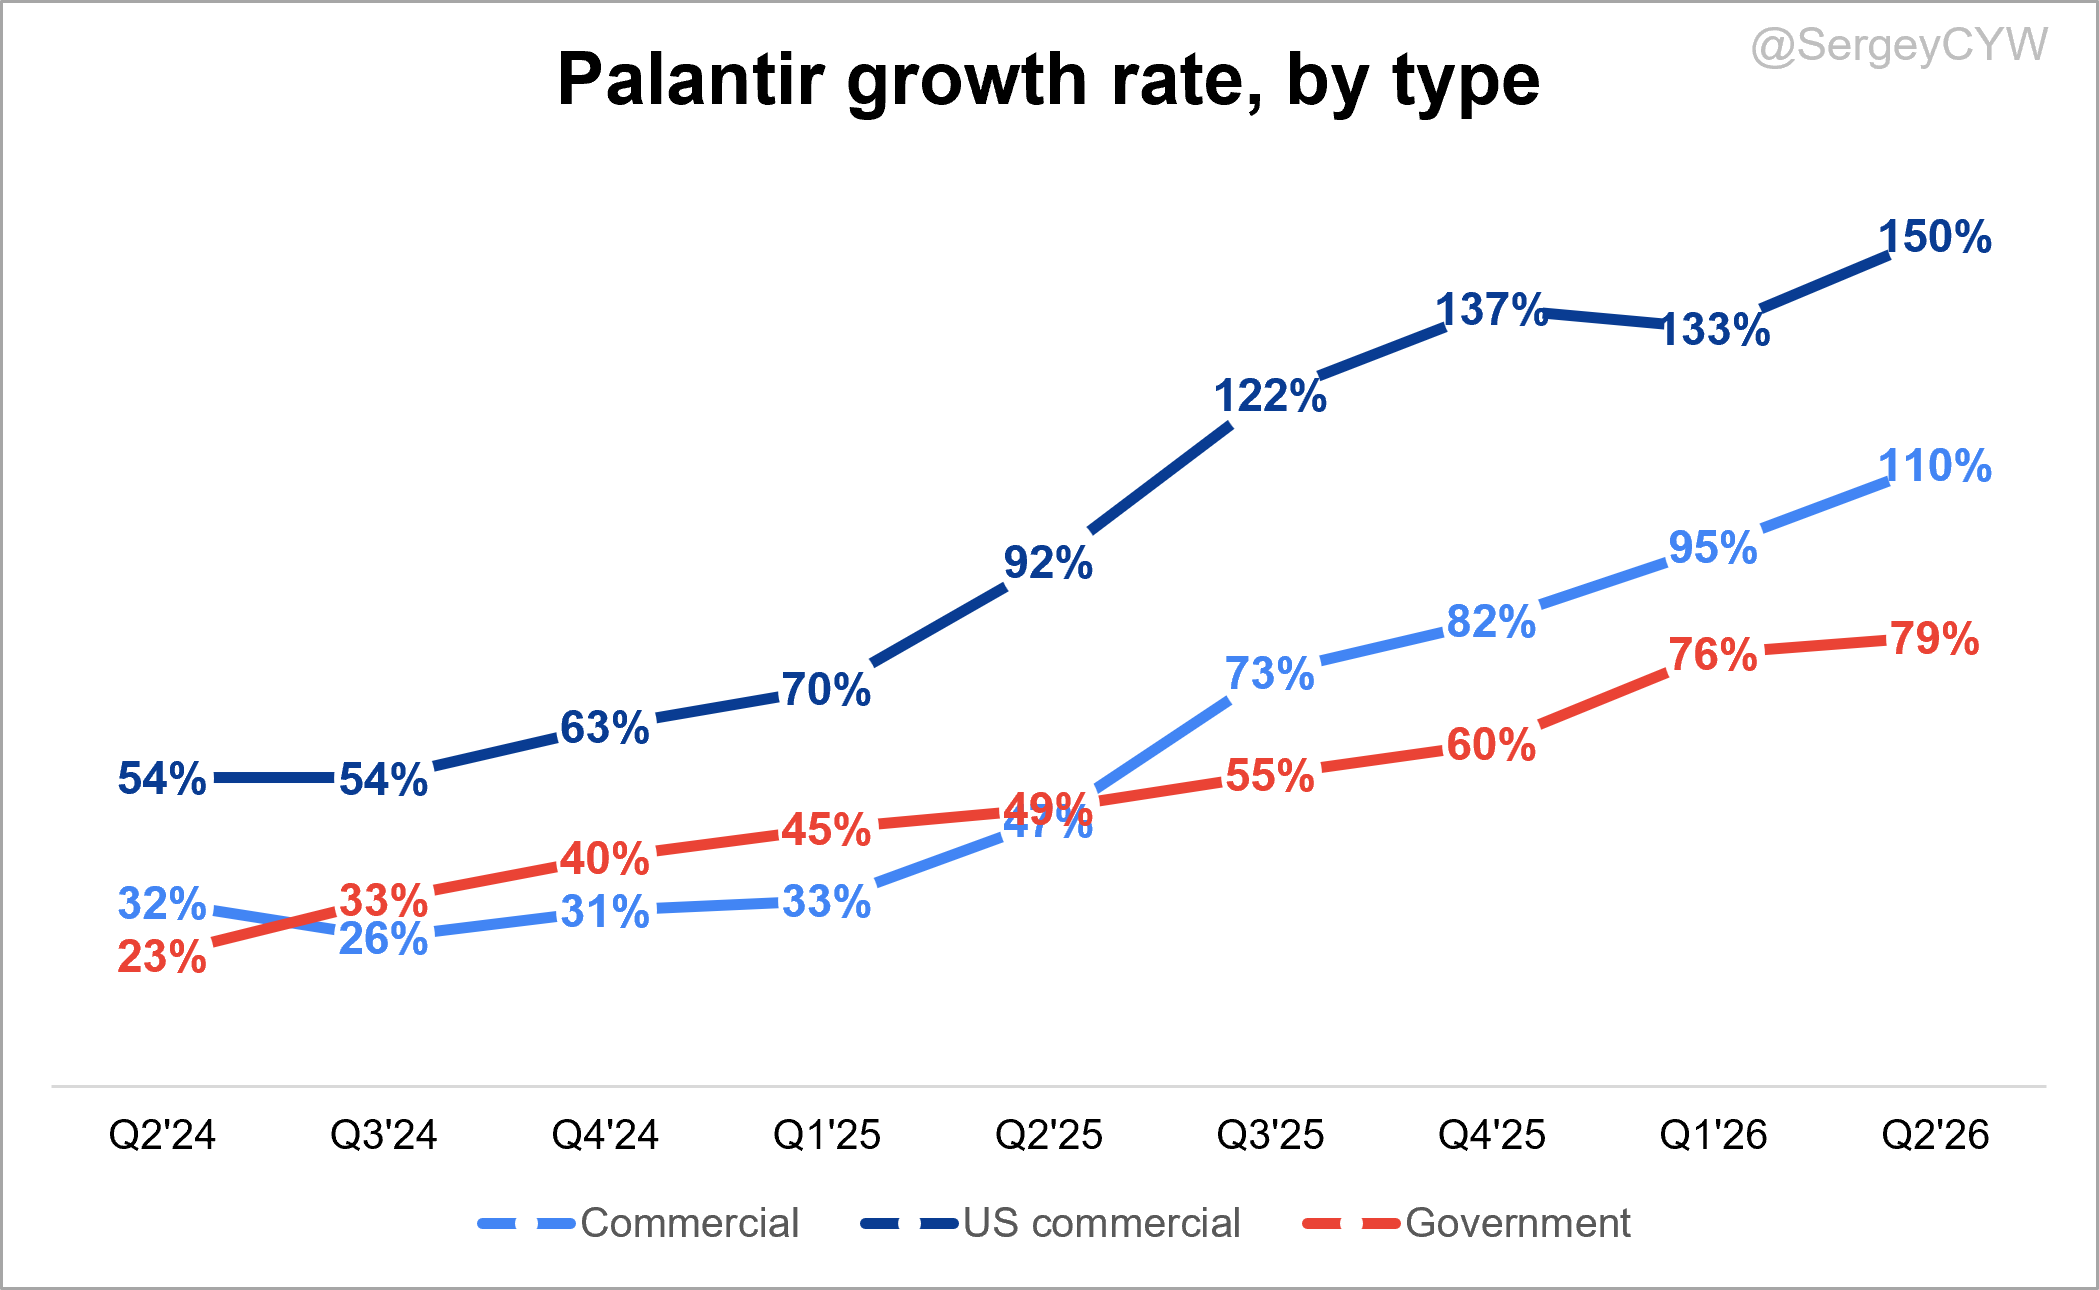
↗️Commercial $945M rev (+109.5% YoY, 48.8% Total rev)🟢
↗️US commercial $764M rev (+149.7% YoY)🟢
➡️Government $991M rev (+79.1% YoY, 51.2% Total rev)🟡
Key Metrics
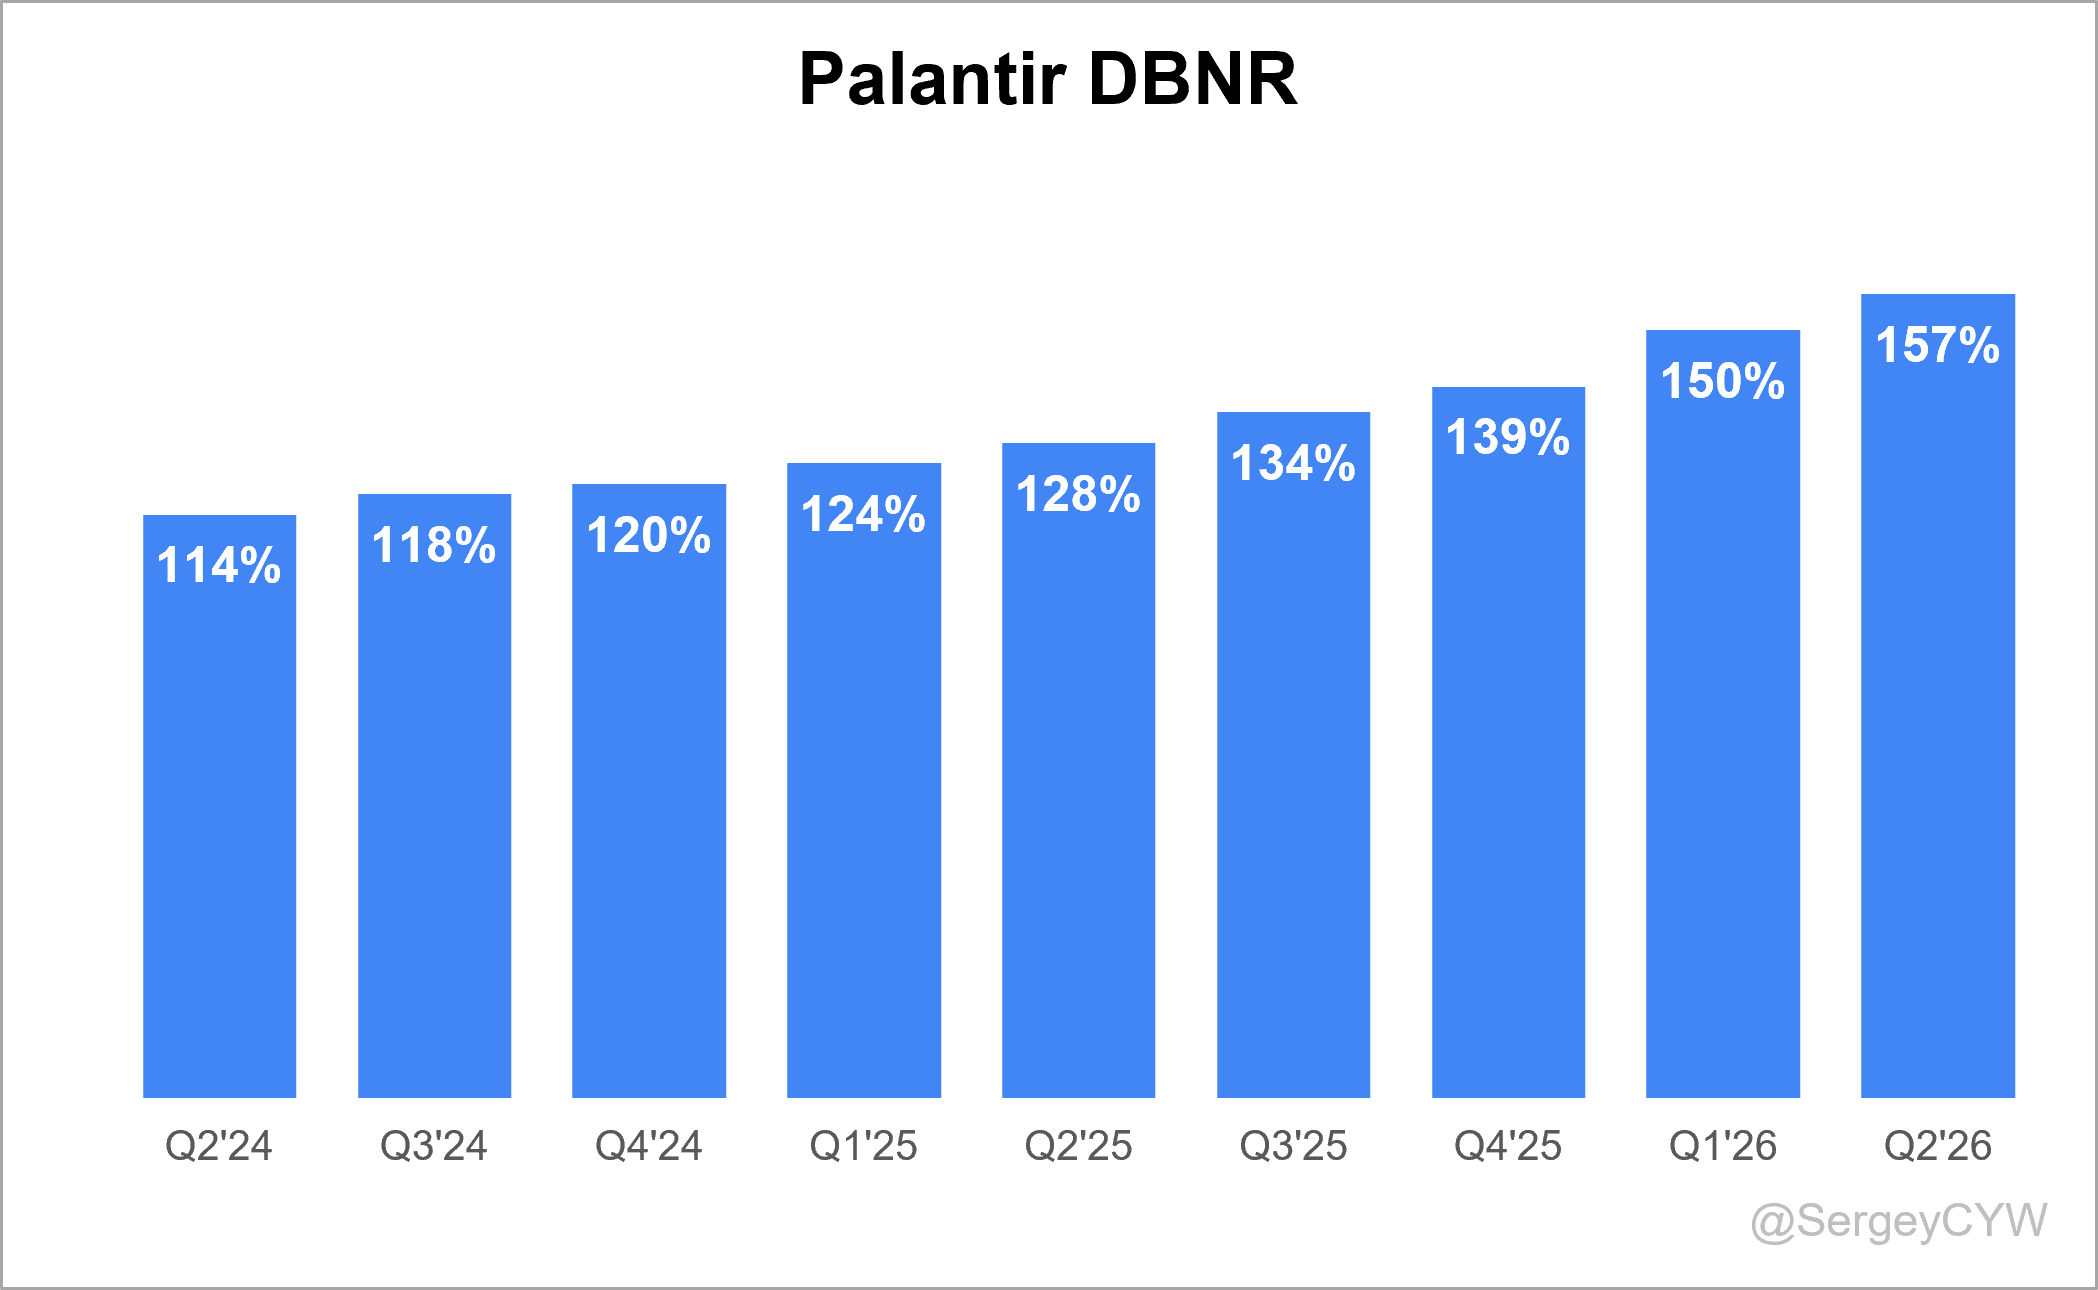
↗️DBNR 157% (150% LQ)
↗️RPO $4.90B (+102.5% YoY)
➡️Billings $2,072M (+88.0% YoY)🟡
Customers
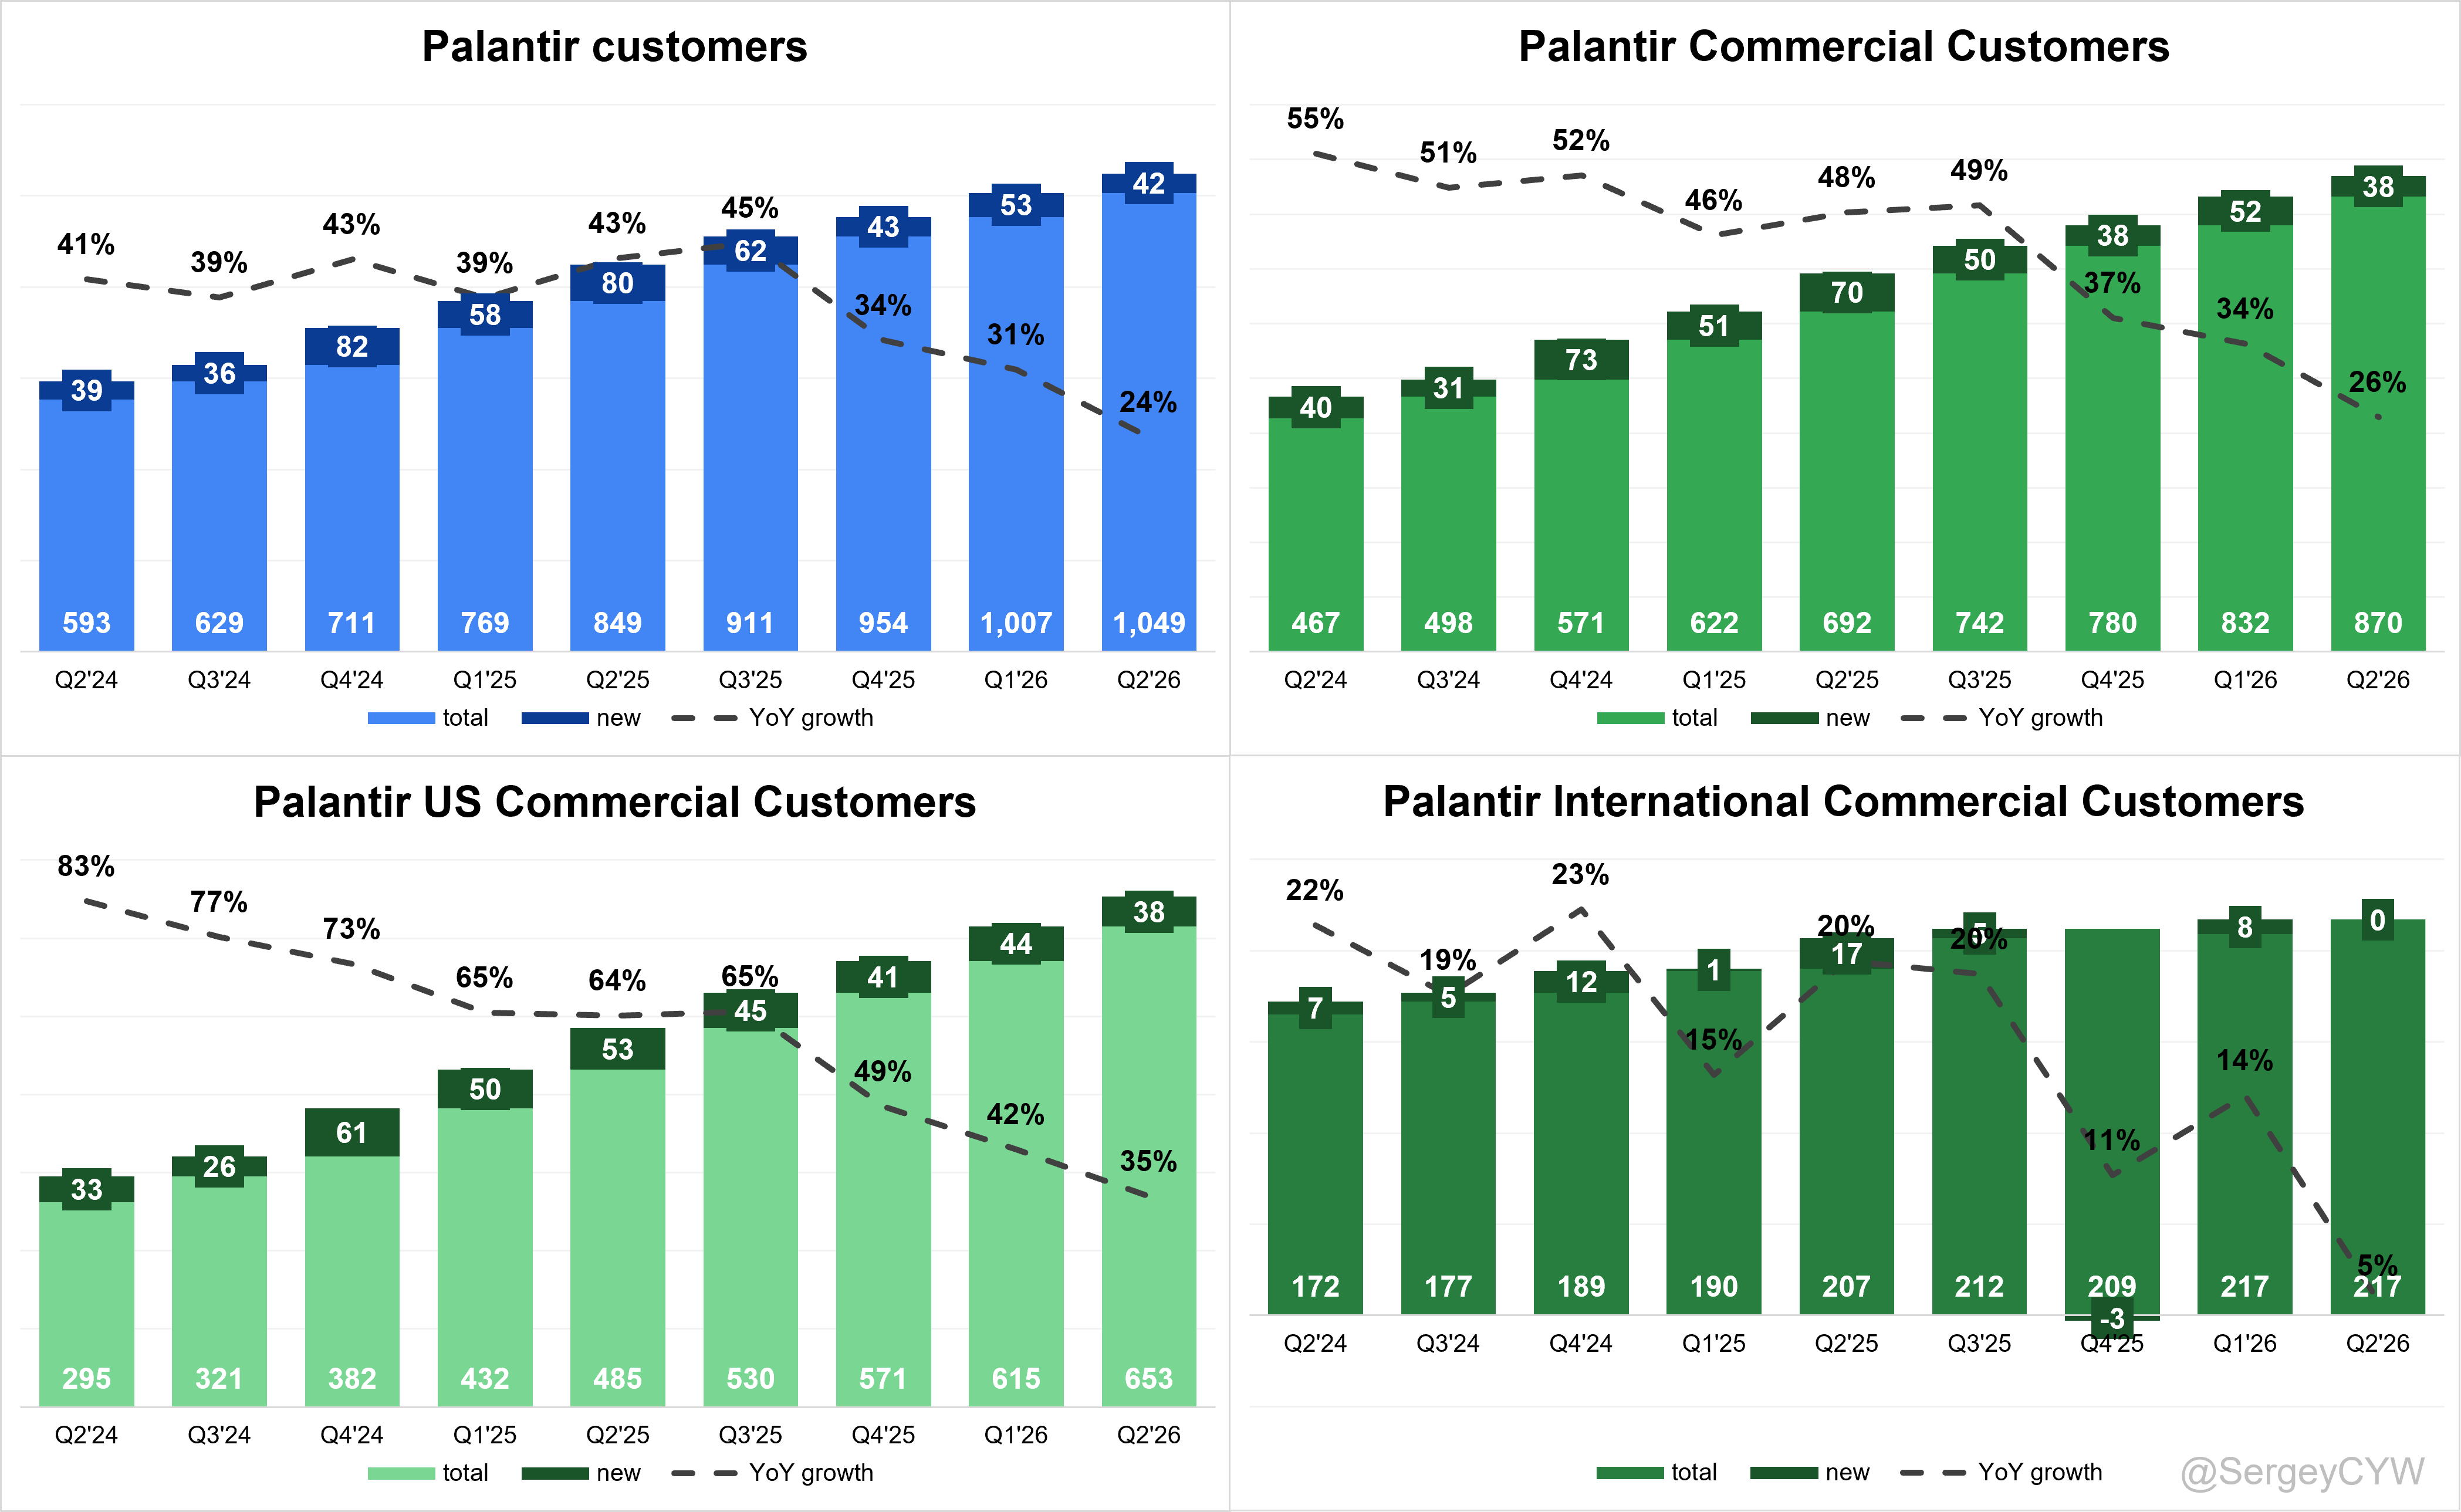
➡️1,049 Customers (+23.6% YoY, +42)
➡️870 Commercial Customers (+25.7% YoY, +38)
➡️653 US Commercial Customers (+34.6% YoY, +38)
↘️217 International Commercial Customers (+4.8% YoY, +0)🟡
Operating expenses
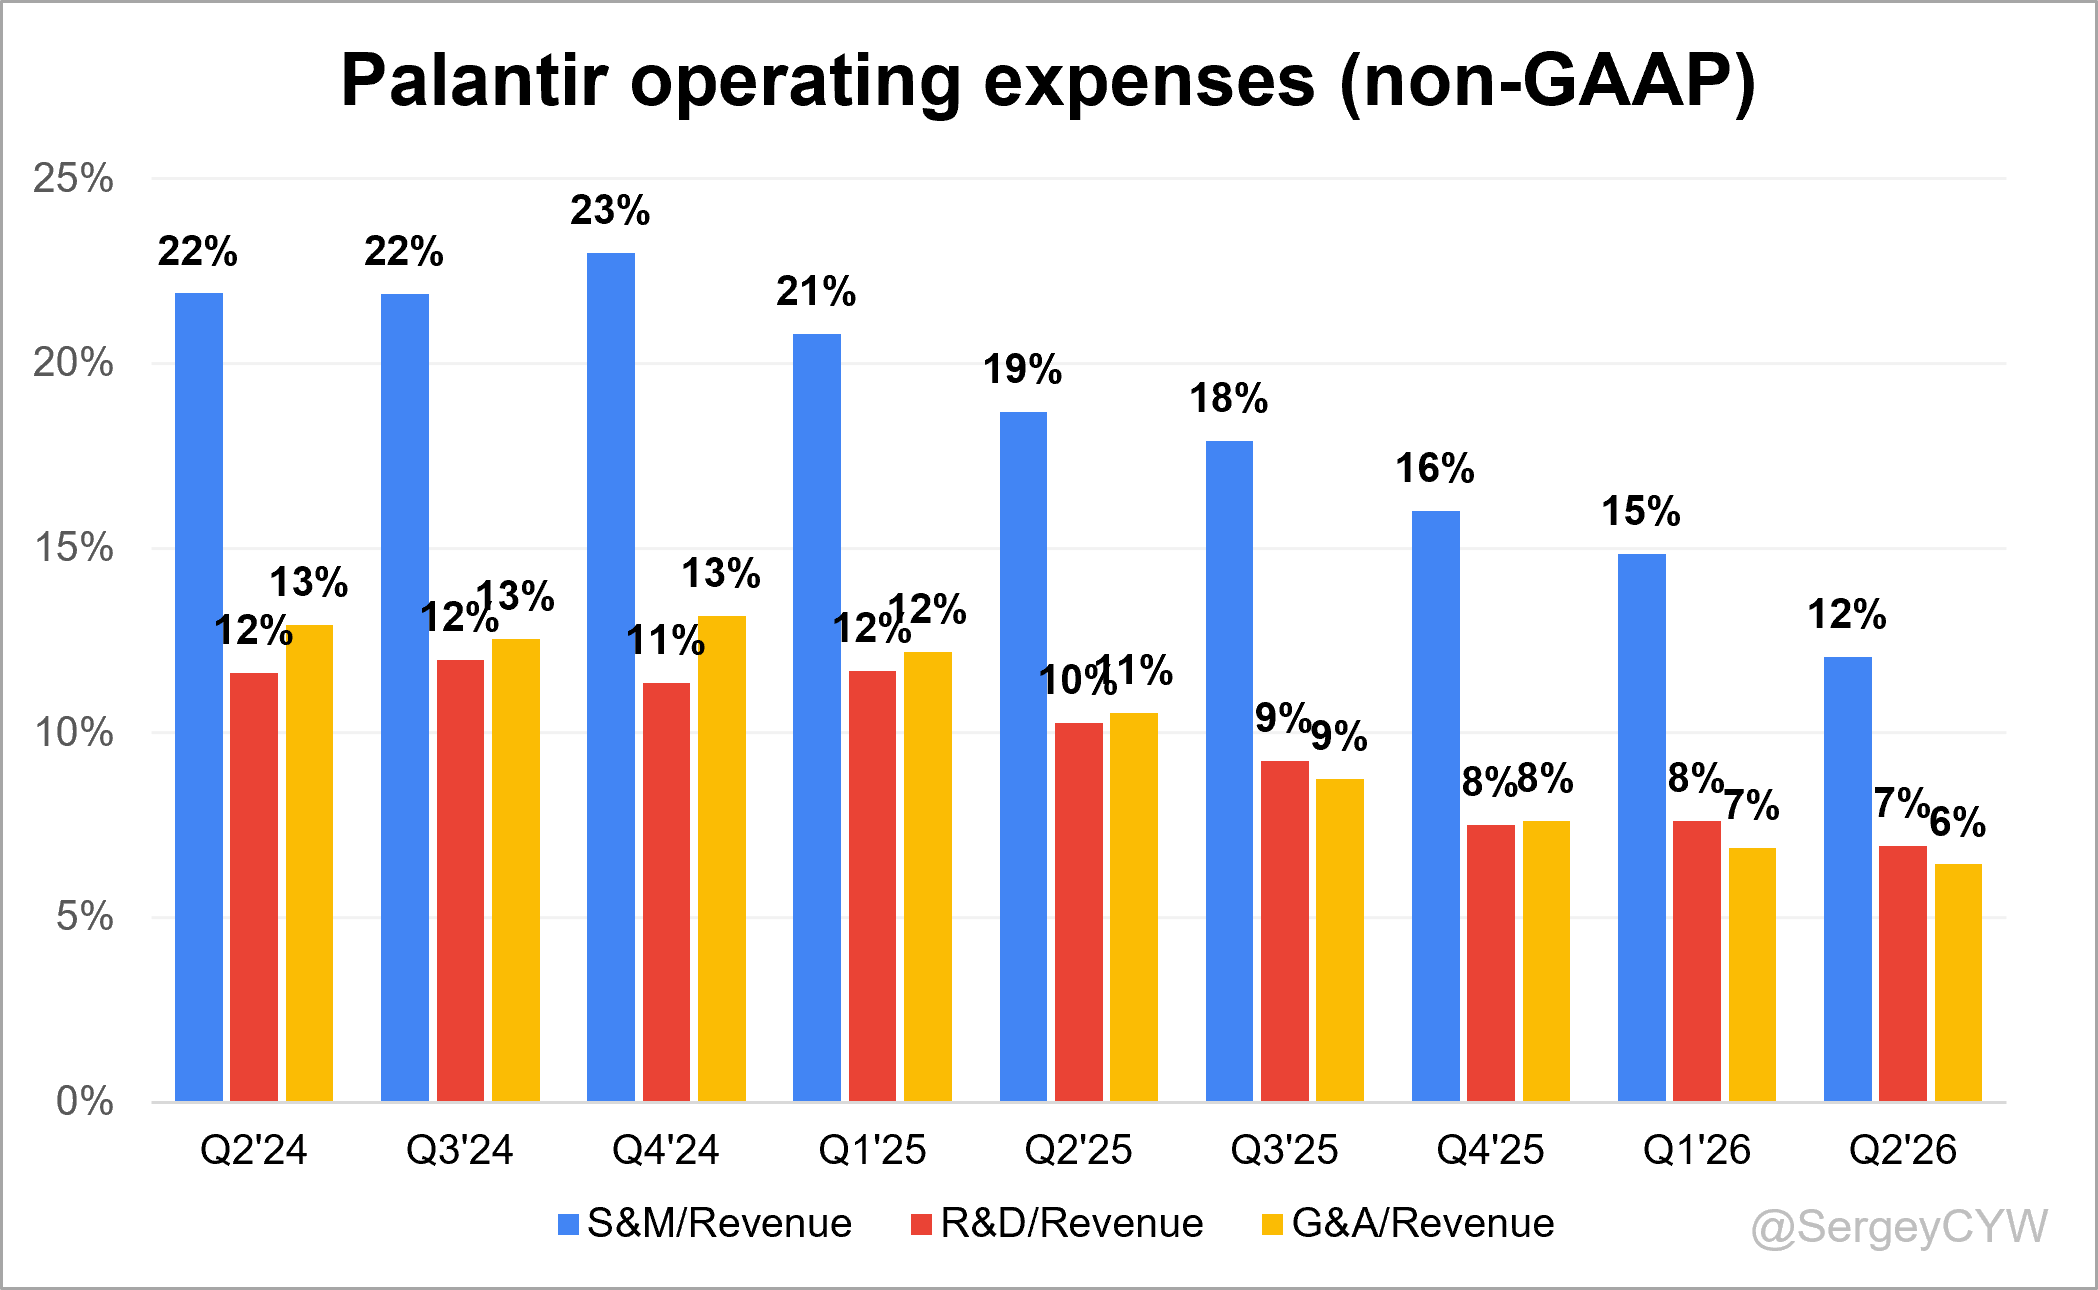
↘️S&M*/Revenue 12.1% (-6.6 PPs YoY)
↘️R&D*/Revenue 6.9% (-3.3 PPs YoY)
↘️G&A*/Revenue 6.4% (-4.1 PPs YoY)
Quarterly Performance Highlights
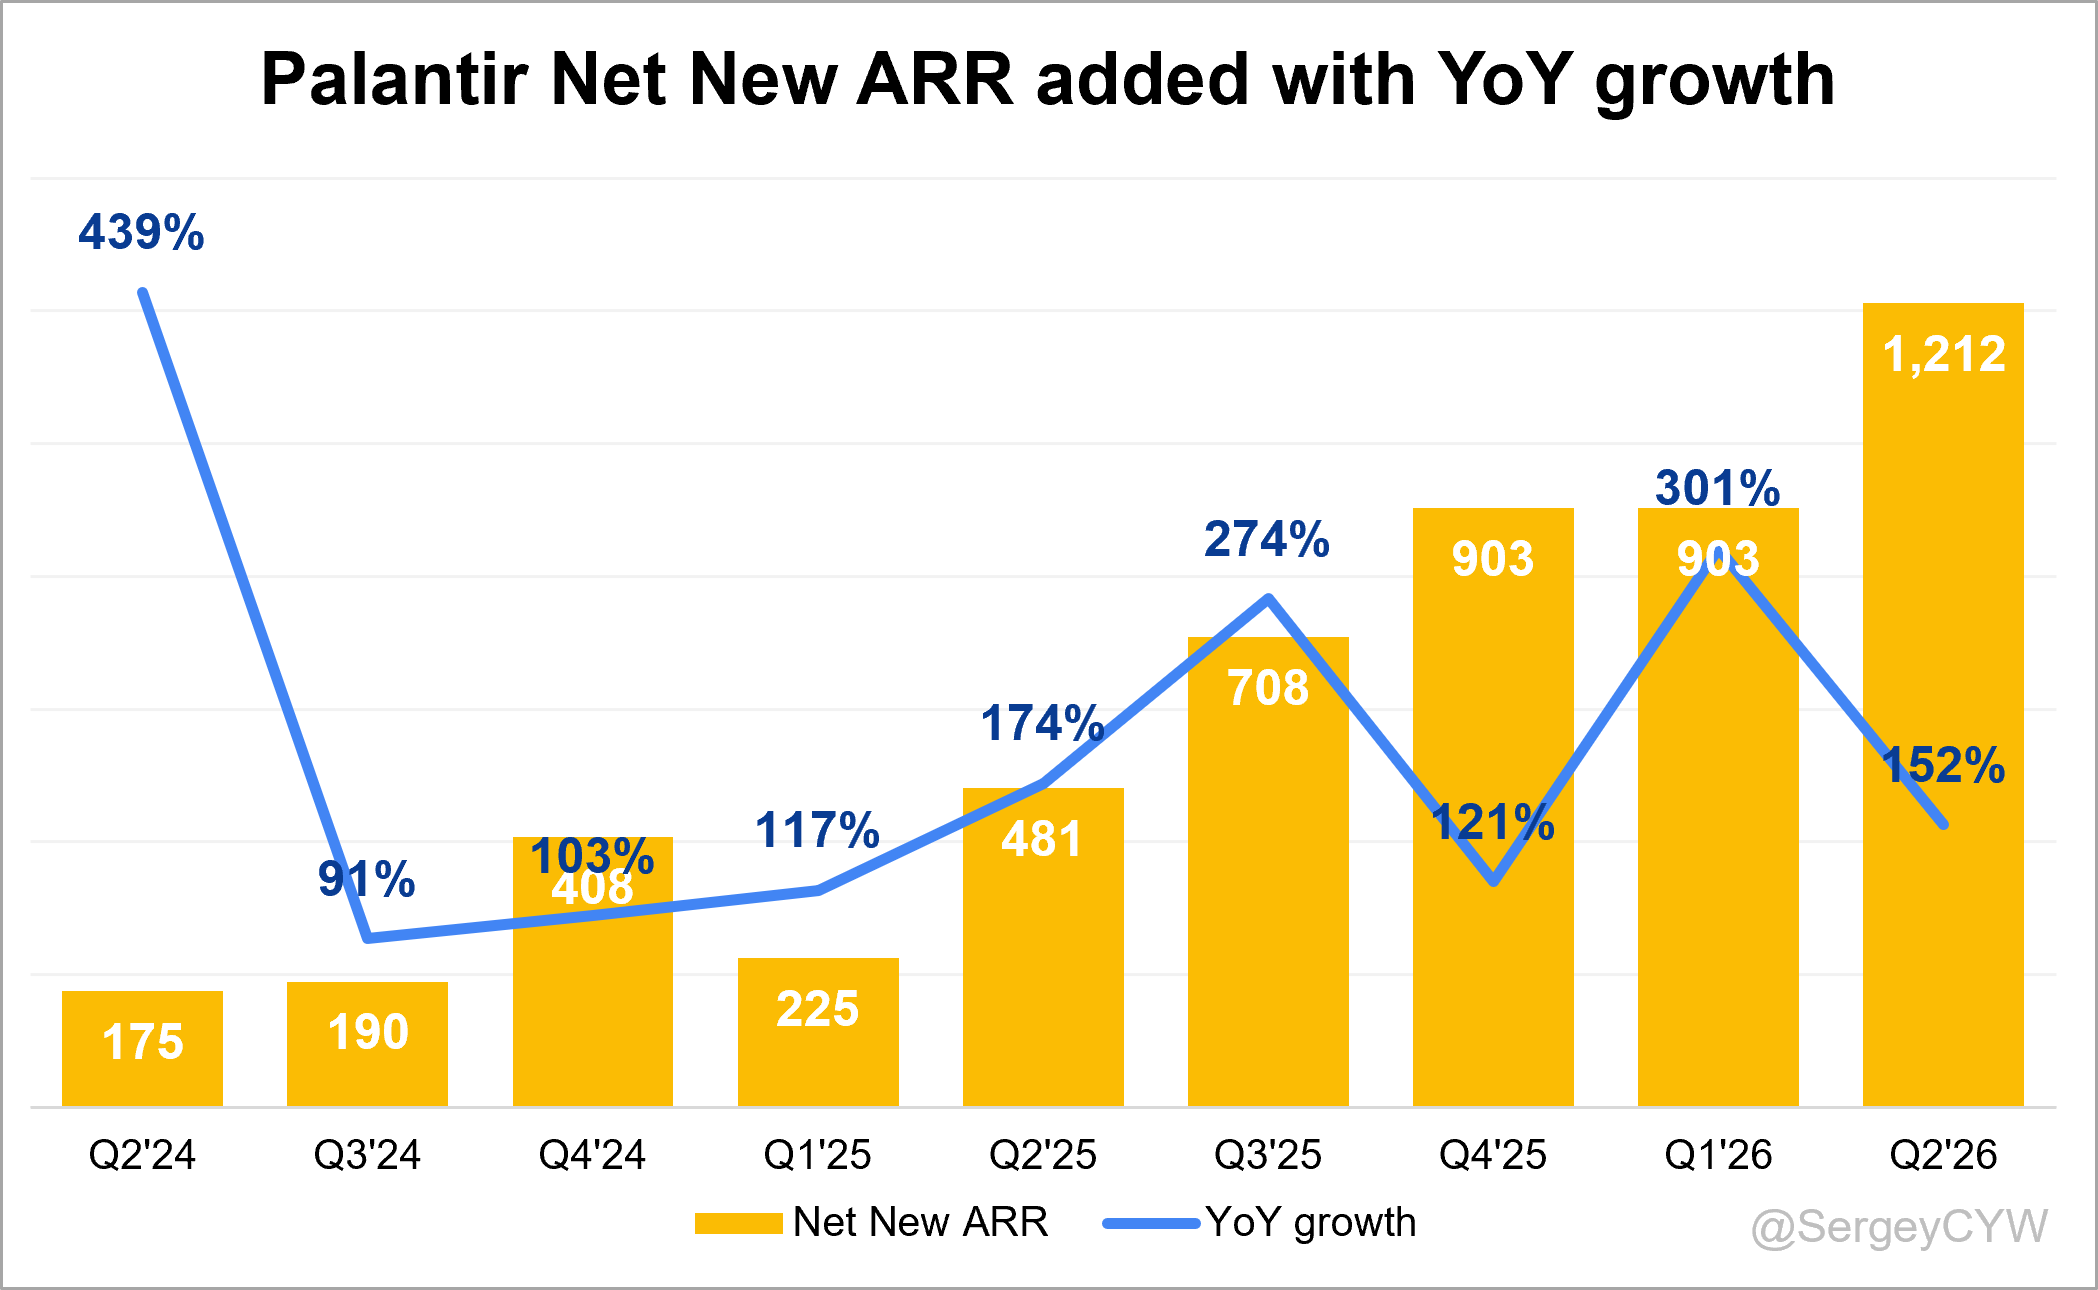
↗️Net New ARR $1,212M (+152.1% YoY)
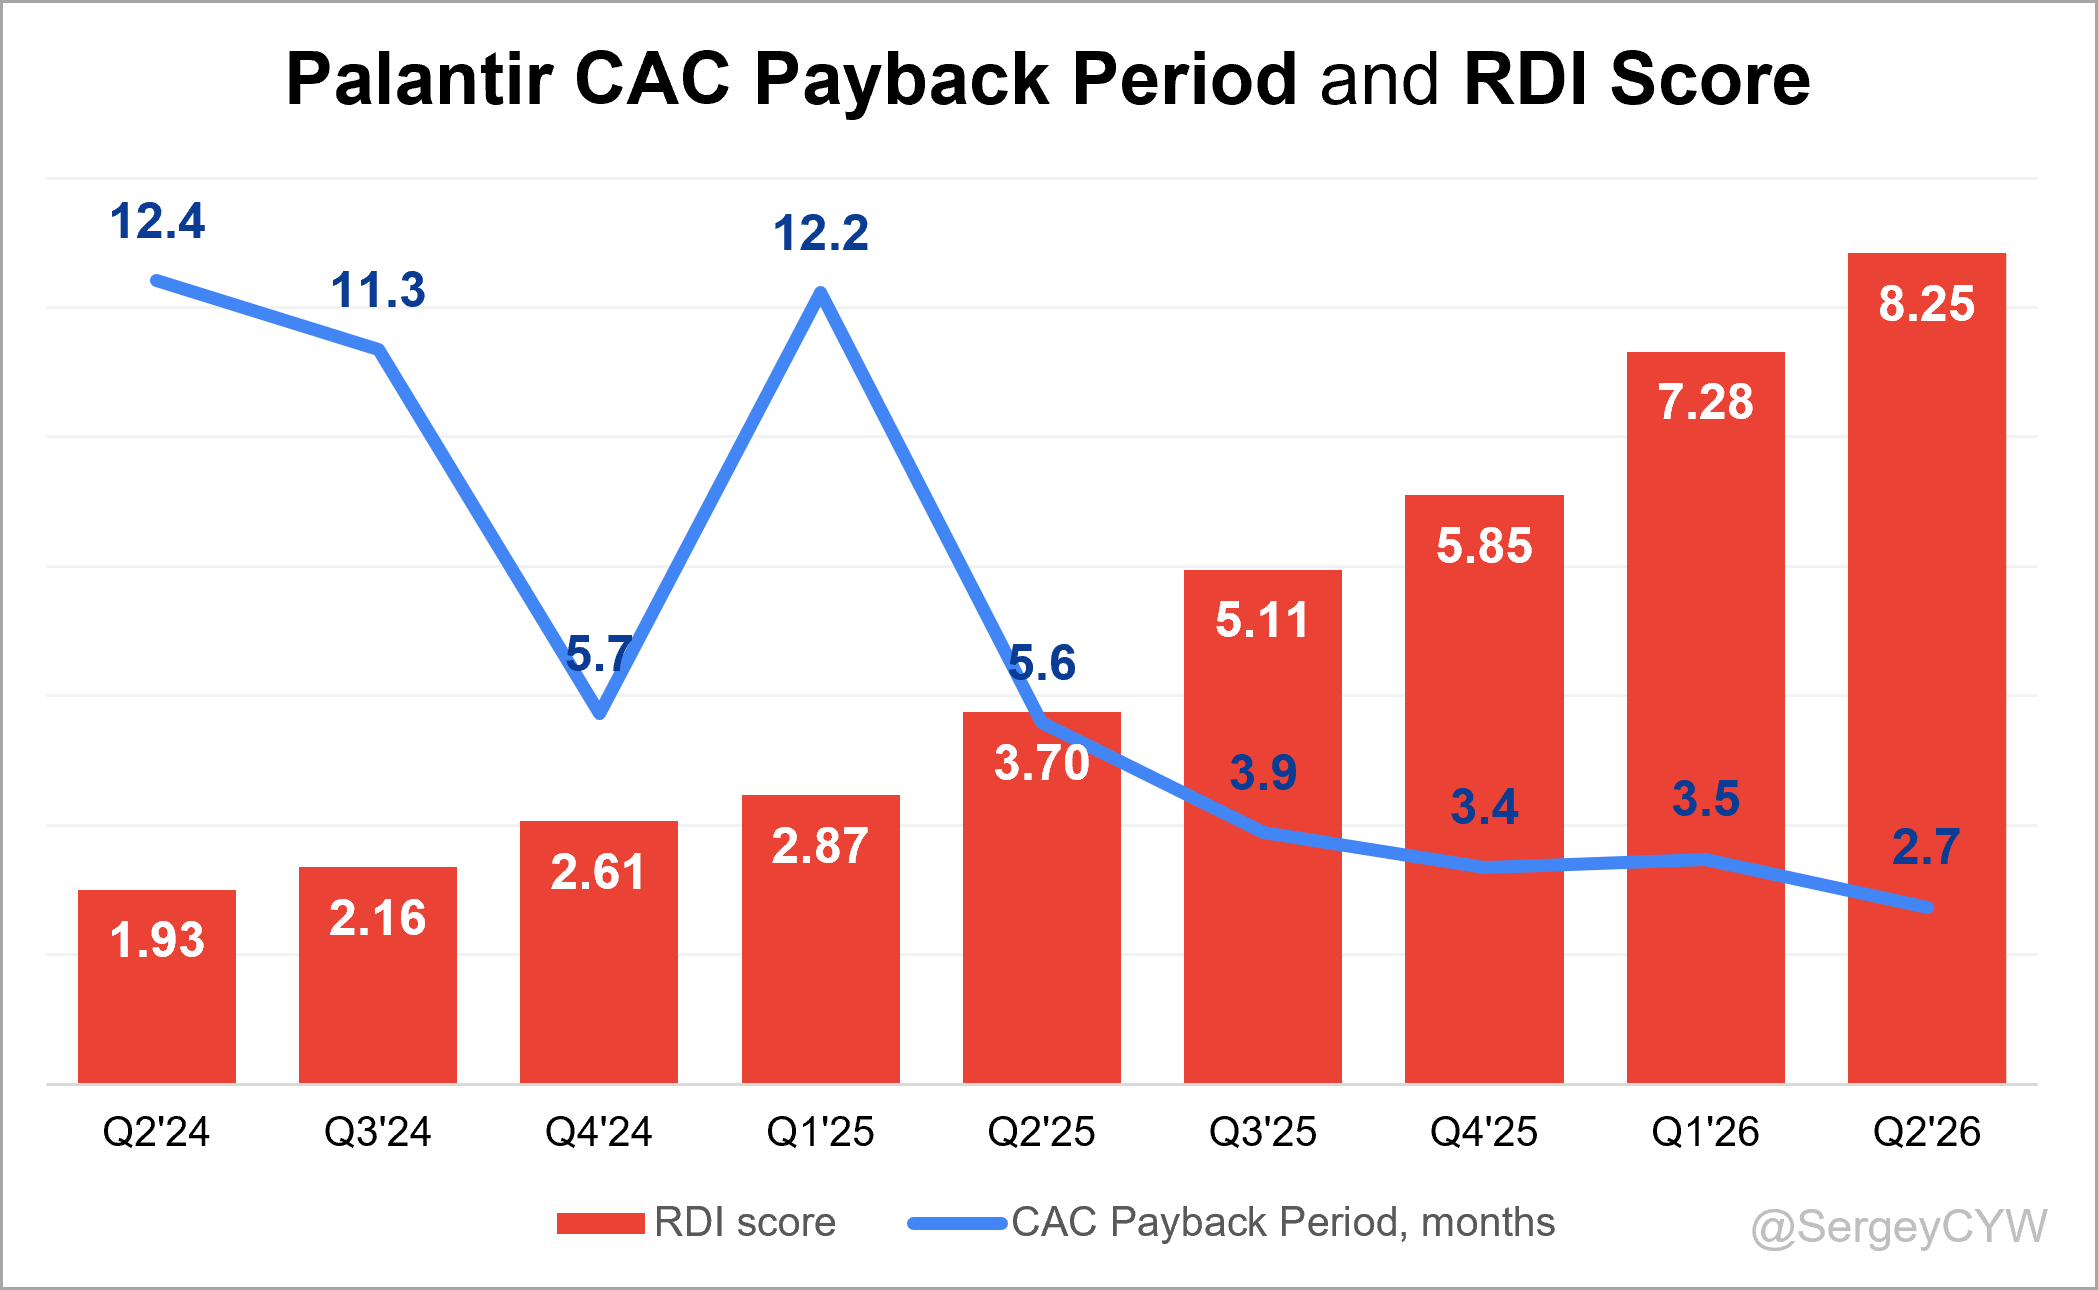
↘️CAC* Payback Period 2.7 Months (-2.9 YoY)🟢
↗️R&D* Index (RDI) 8.25 (+4.55 YoY)🟢
Dilution
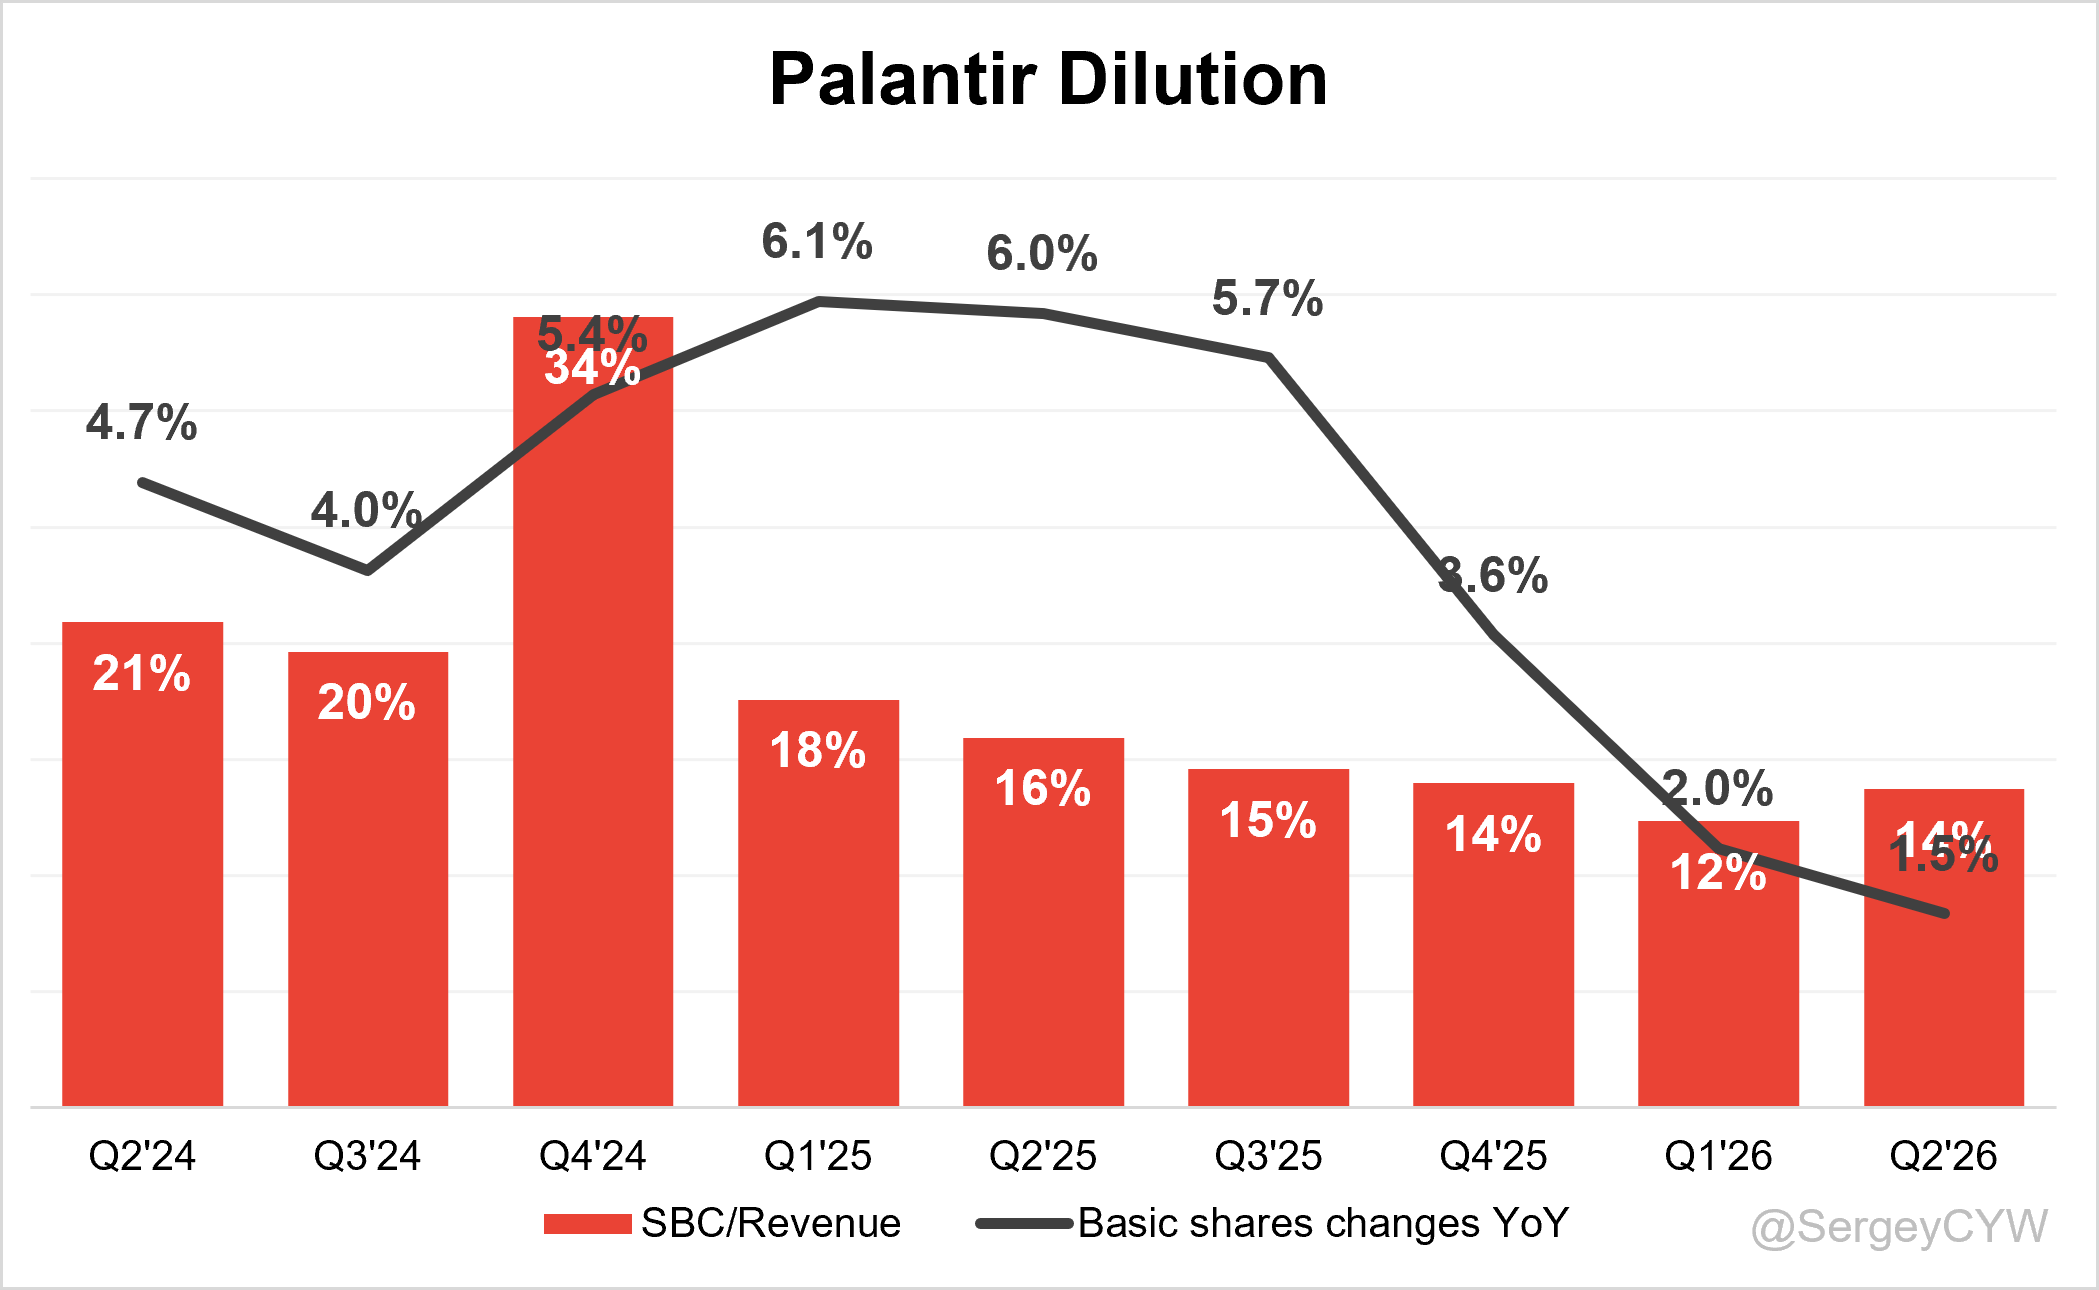
↗️SBC/rev 14%, +1.4 PPs QoQ
↘️Basic shares up 1.5% YoY, -0.5 PPs QoQ
↘️Diluted shares up 0.2% YoY, -0.5 PPs QoQ🟢
Guidance
↗️Q3’26 $2,160.0 - $2,164.0M guide (+83.1% YoY) beat est by 8.4%
↗️$8,150.0 - $8,158.0M FY guide (+82.2% YoY) raised by 6.5% beat est by 6.4%
🟢Positive
Revenue growth +92.8% YoY and +18.6% QoQ, beat estimates by 7.5%.
Adj operating margin rose 15.5 PPs YoY to 61.7%, adj FCF margin reached 63.1%, and net margin rose to 54.9%.
Adj EPS $0.41, beat estimates by 20.6%.
Commercial revenue grew +109.5% YoY to $945 million, led by U.S. Commercial growth of +149.7% to $764 million.
U.S. Commercial TCV bookings reached a record $2.132 billion, up +153% YoY and +81% QoQ.
Net dollar retention increased to 157% from 150% last quarter, confirming strong expansion within existing customers.
RPO increased +102.5% YoY to $4.90 billion, while total remaining deal value reached $13.1 billion, up +83%.
Palantir closed 220 deals above $1 million, and 98 above $5 million and 73 above $10 million.
Net new ARR increased +152.1% YoY to $1.212 billion, and CAC payback improved to only 2.7 months.
AIP expanded into supervised fine-tuning, reinforcement learning and post-training, strengthening Palantir’s position as an enterprise AI operating layer.
Full-year revenue guidance increased 6.5% to $8.150–$8.158 billion, implying +82.2% YoY growth, beating consensus by 6.4%.
🟡Neutral
Government revenue increased 79.1% YoY to $991 million and represented 51.2% of total revenue.
Billings grew +88.0% YoY to $2.072 billion, slightly below revenue growth.
Total customer count increased 23.6% YoY to 1,049, and commercial customers rose 25.7% to 870.
U.S. Commercial customer count increased 34.6% to 653, indicating expansion and larger contracts are driving most growth.
Adj gross margin high 85%, although Palantir assumed hosting costs for one government customer.
Q3 revenue guidance of $2.160–$2.164 billion implies 12% sequential growth and 83.1% YoY growth.
🔴Negative
International Commercial revenue increased only 26% YoY and 2% QoQ, far below U.S. Commercial growth.
International Commercial customer count remained unchanged sequentially at 217 (+0 new customers QoQ) and grew only 4.8% YoY.
U.S. operations now generate 81% of total revenue, increasing geographic concentration.
Stock-based compensation reached 14% of revenue, and increased 1.4 PPs QoQ.
Customer concentration elevated, with top 20 accounts generating approximately $2.48 billion in combined trailing revenue.
Operating expenses are expected to rise in Q3.
Strong quarter for PLTR. Revenue growth accelerated to +92.8% YoY, beating management’s guidance by 7.5%, one of the largest beats in the company’s history. Full-year guidance was raised by 6.5%, following a 6.4% increase in Q1. If Palantir beats its Q3 guidance by a similar margin, revenue growth could accelerate to +96.9% YoY.
Commercial revenue grew +109.5% YoY, and its share increased to 48.8% of total revenue. U.S. Commercial revenue growth accelerate to +149.7% YoY. Government revenue growth also accelerated to +79.1% YoY.
These are exceptionally strong results that could justify Palantir’s premium valuation at 47.3x EV/Sales and 79.7x Forward P/E.
However, such a high valuation assumes continued rapid growth, but can Palantir grow 100%+ further?
Retention very strong at 157%, showing that existing customers continue to expand their usage. However, new customer growth is slowing noticeably. Palantir added 42 new customers, almost half the 80 customers added in Q2 last year, and below the previous quarter.
Palantir added 38 new U.S. Commercial customers, the weakest result over the past six quarters. International performance raises even more concerns. Palantir added no new International Commercial customers, while International Commercial revenue growth significantly lagged, growing just +26% YoY.
Regarding customer growth, it is important to note that Palantir is increasingly focused on attracting larger customers. Management highlighted 220 deals worth more than $1 million, including 98 deals above $5 million and 73 deals above $10 million. But, as Palantir moves toward larger enterprise customers, customer concentration is also increasing. Average revenue from each top-20 customer reached $124 million.
Billings and RPO growth remain high, but both metrics show early signs of future revenue growth decline. Billings growth slowed to +88% YoY, below revenue growth. RPO growth also slowed from +134% YoY in Q1 to +102.5%, although it still above revenue growth.
Operating margin, free cash flow margin and net margin improved both QoQ and YoY. However, non-GAAP gross margin declined noticeably from 87.88% in Q1 to 84.66%.
Operating expenses are expected to increase in Q3 due to seasonal hiring and marketing. Non-GAAP operating margin in Q2 at 61.7%, while management expects it to decline to 60% in Q3.
Management sees Sovereign AI as an important future growth opportunity. Palantir expanded AIP into customer-controlled model development, allowing enterprises to retain greater control over their models, data and workflows.
Companies using third-party AI platforms face risks related to transferring prompts, operational knowledge and proprietary information to external model providers. Palantir is positioning AIP as a more secure and controlled alternative for enterprise AI deployment.
GRAB revenue rose +21.7% YoY, beat est by 0.7%, but growth slowed from +23.5% YoY in Q1.
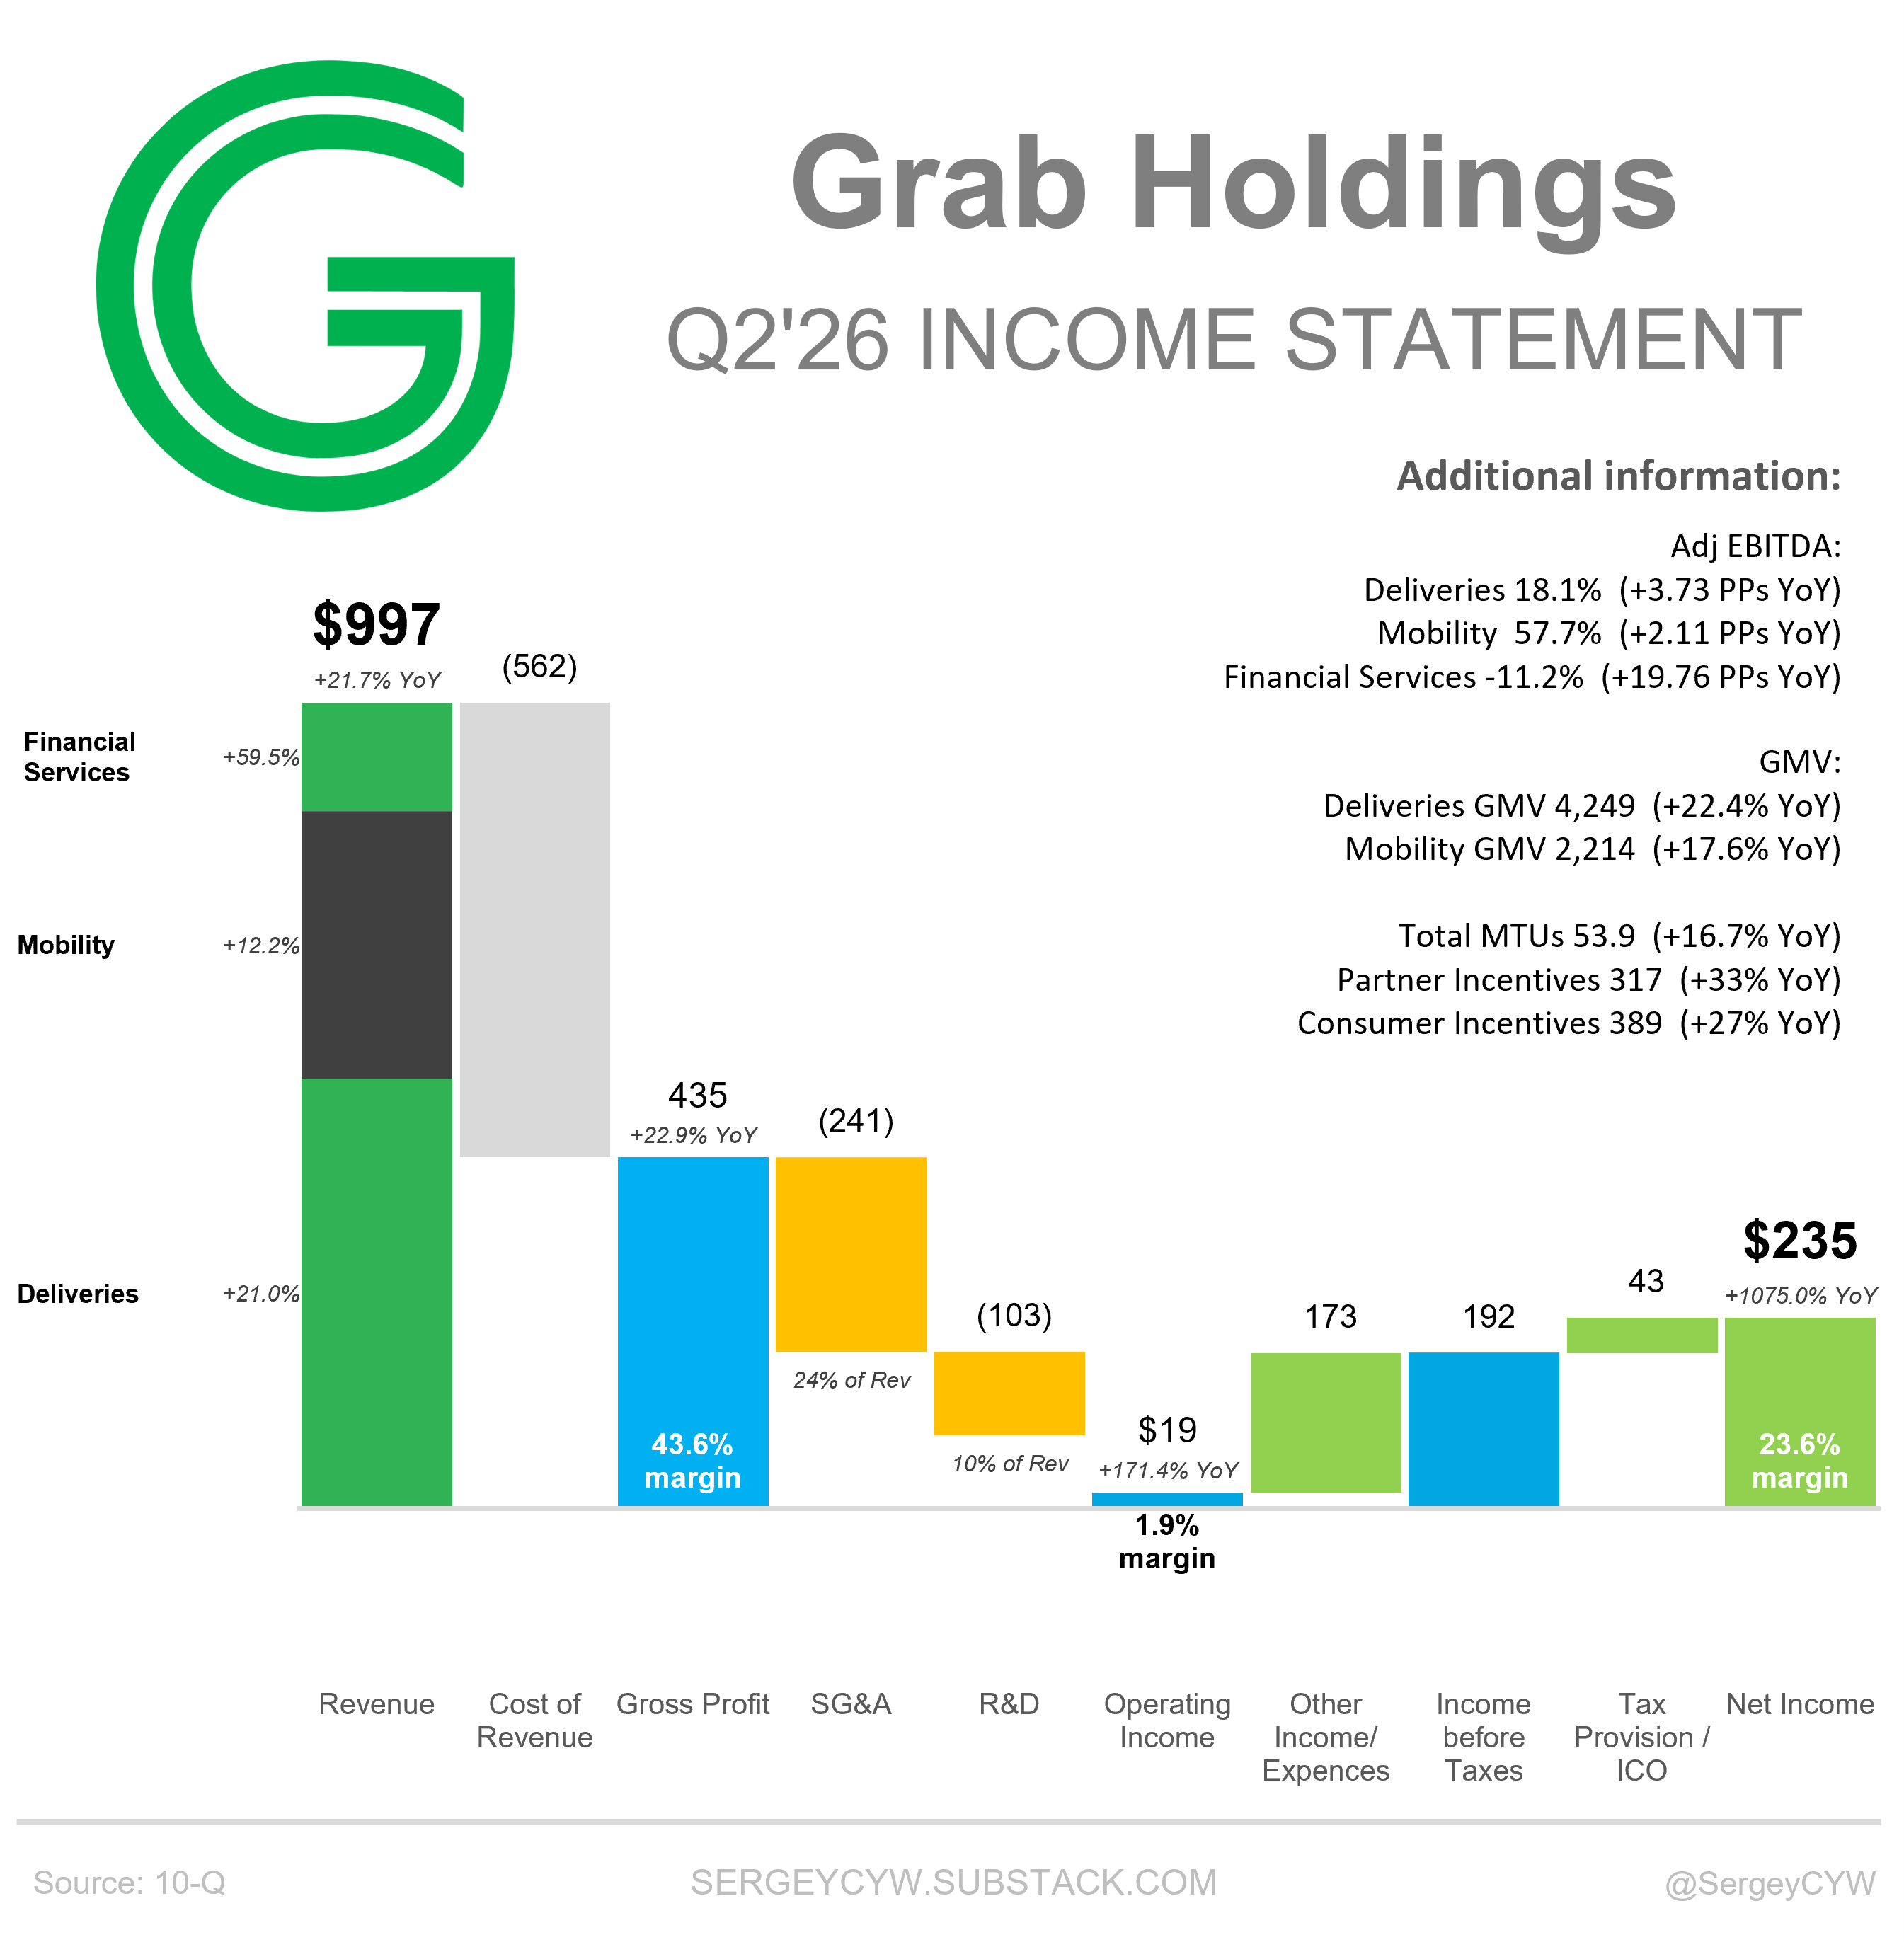
Gross margin reached 44%, +40 BPs YoY, and Operating margin expanded to 2%, +110 BPs.
Deliveries revenue rose +21% YoY (represented 53.3% of total revenue). Deliveries GMV increased +22.4%, Adj EBITDA margin expanded to 18.1%.
Mobility revenue rose +12.2% YoY, Mobility GMV increased +17.6%. Mobility Adj EBITDA grew 16.5%, although revenue growth continued to lag transaction and GMV growth.
Financial Services Adj EBITDA still negative, but management expects segment profitability in the second half of 2026.
GRAB trades at 3.2x EV/Sales and 42.4x Forward P/E.
Thank you for reading!
Follow me for more frequent updates on X/Twitter and Threads, and on LinkedIn. For visual infographics, check out Instagram, and for portfolio changes, follow me on SavvyTrader.
Disclaimer: This earnings review is for informational purposes only and does not constitute financial, investment, or trading advice.
Comments
Nothing yet. Say the first thing.
Sign in to join the conversation.