
Detailed Earnings Analysis:
MercadoLibre MELI 0.00%↑ , AppLovin APP 0.00%↑ , Axon AXON 0.00%↑ .
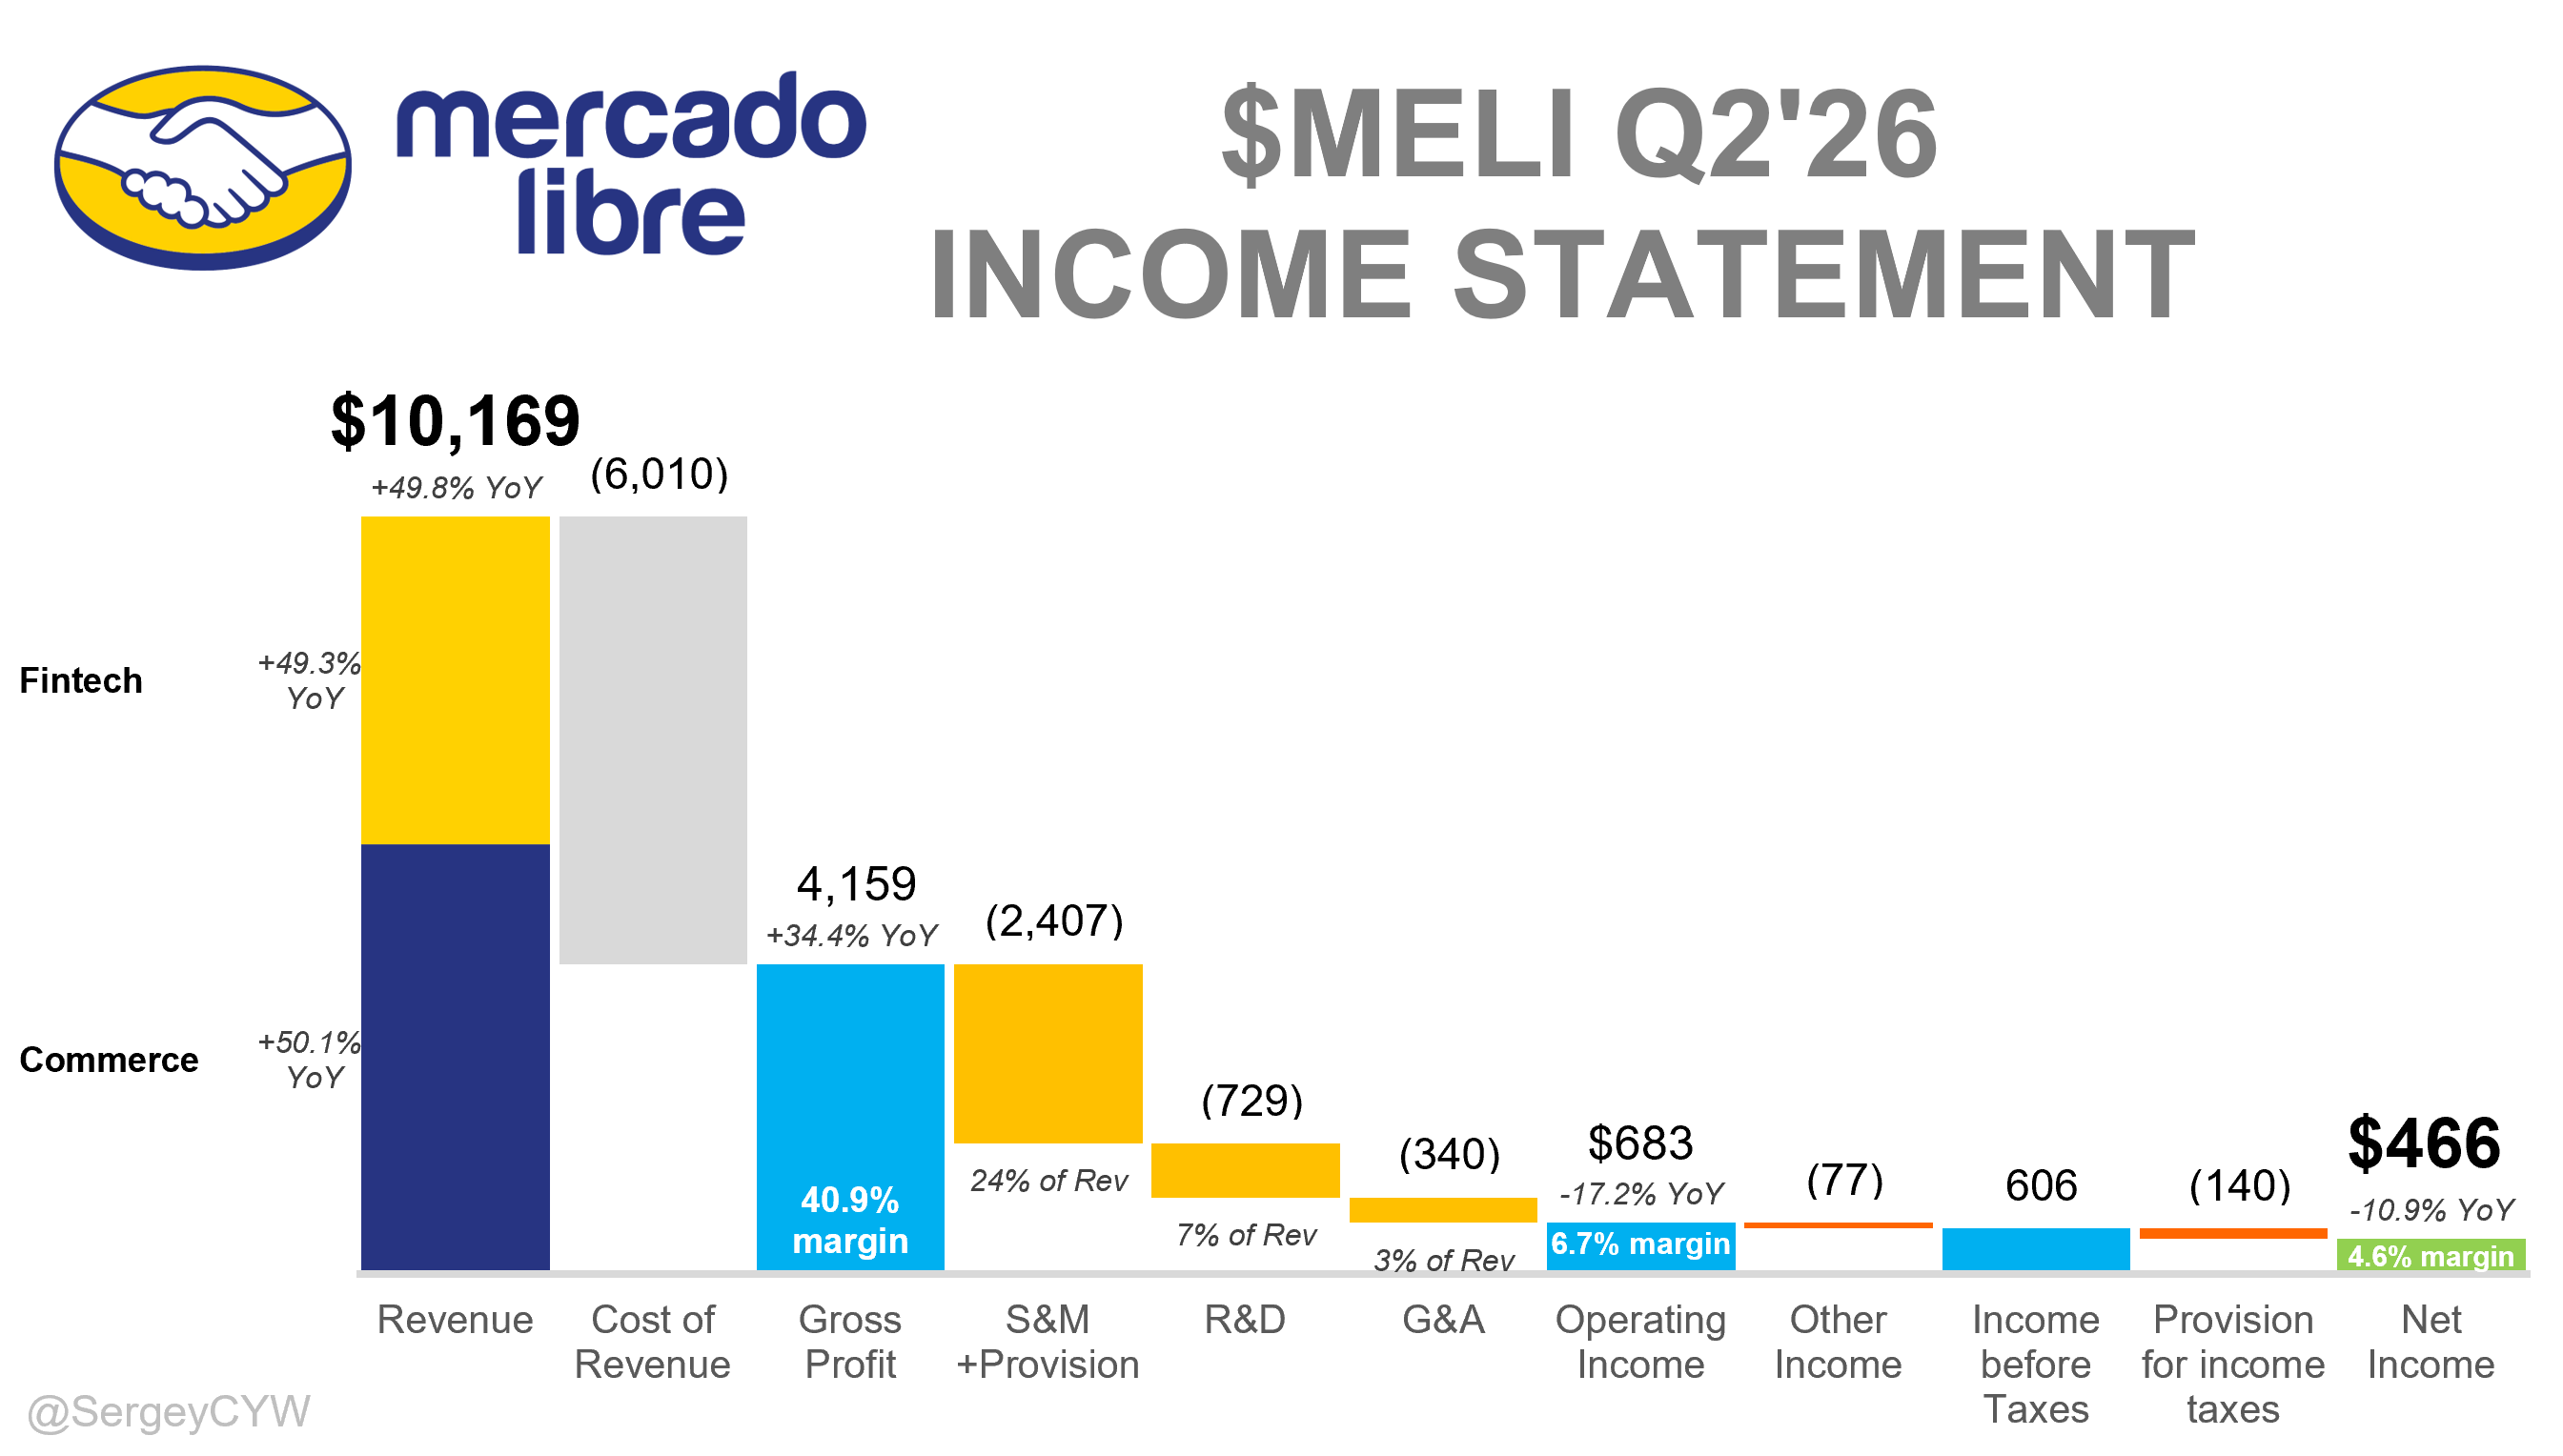
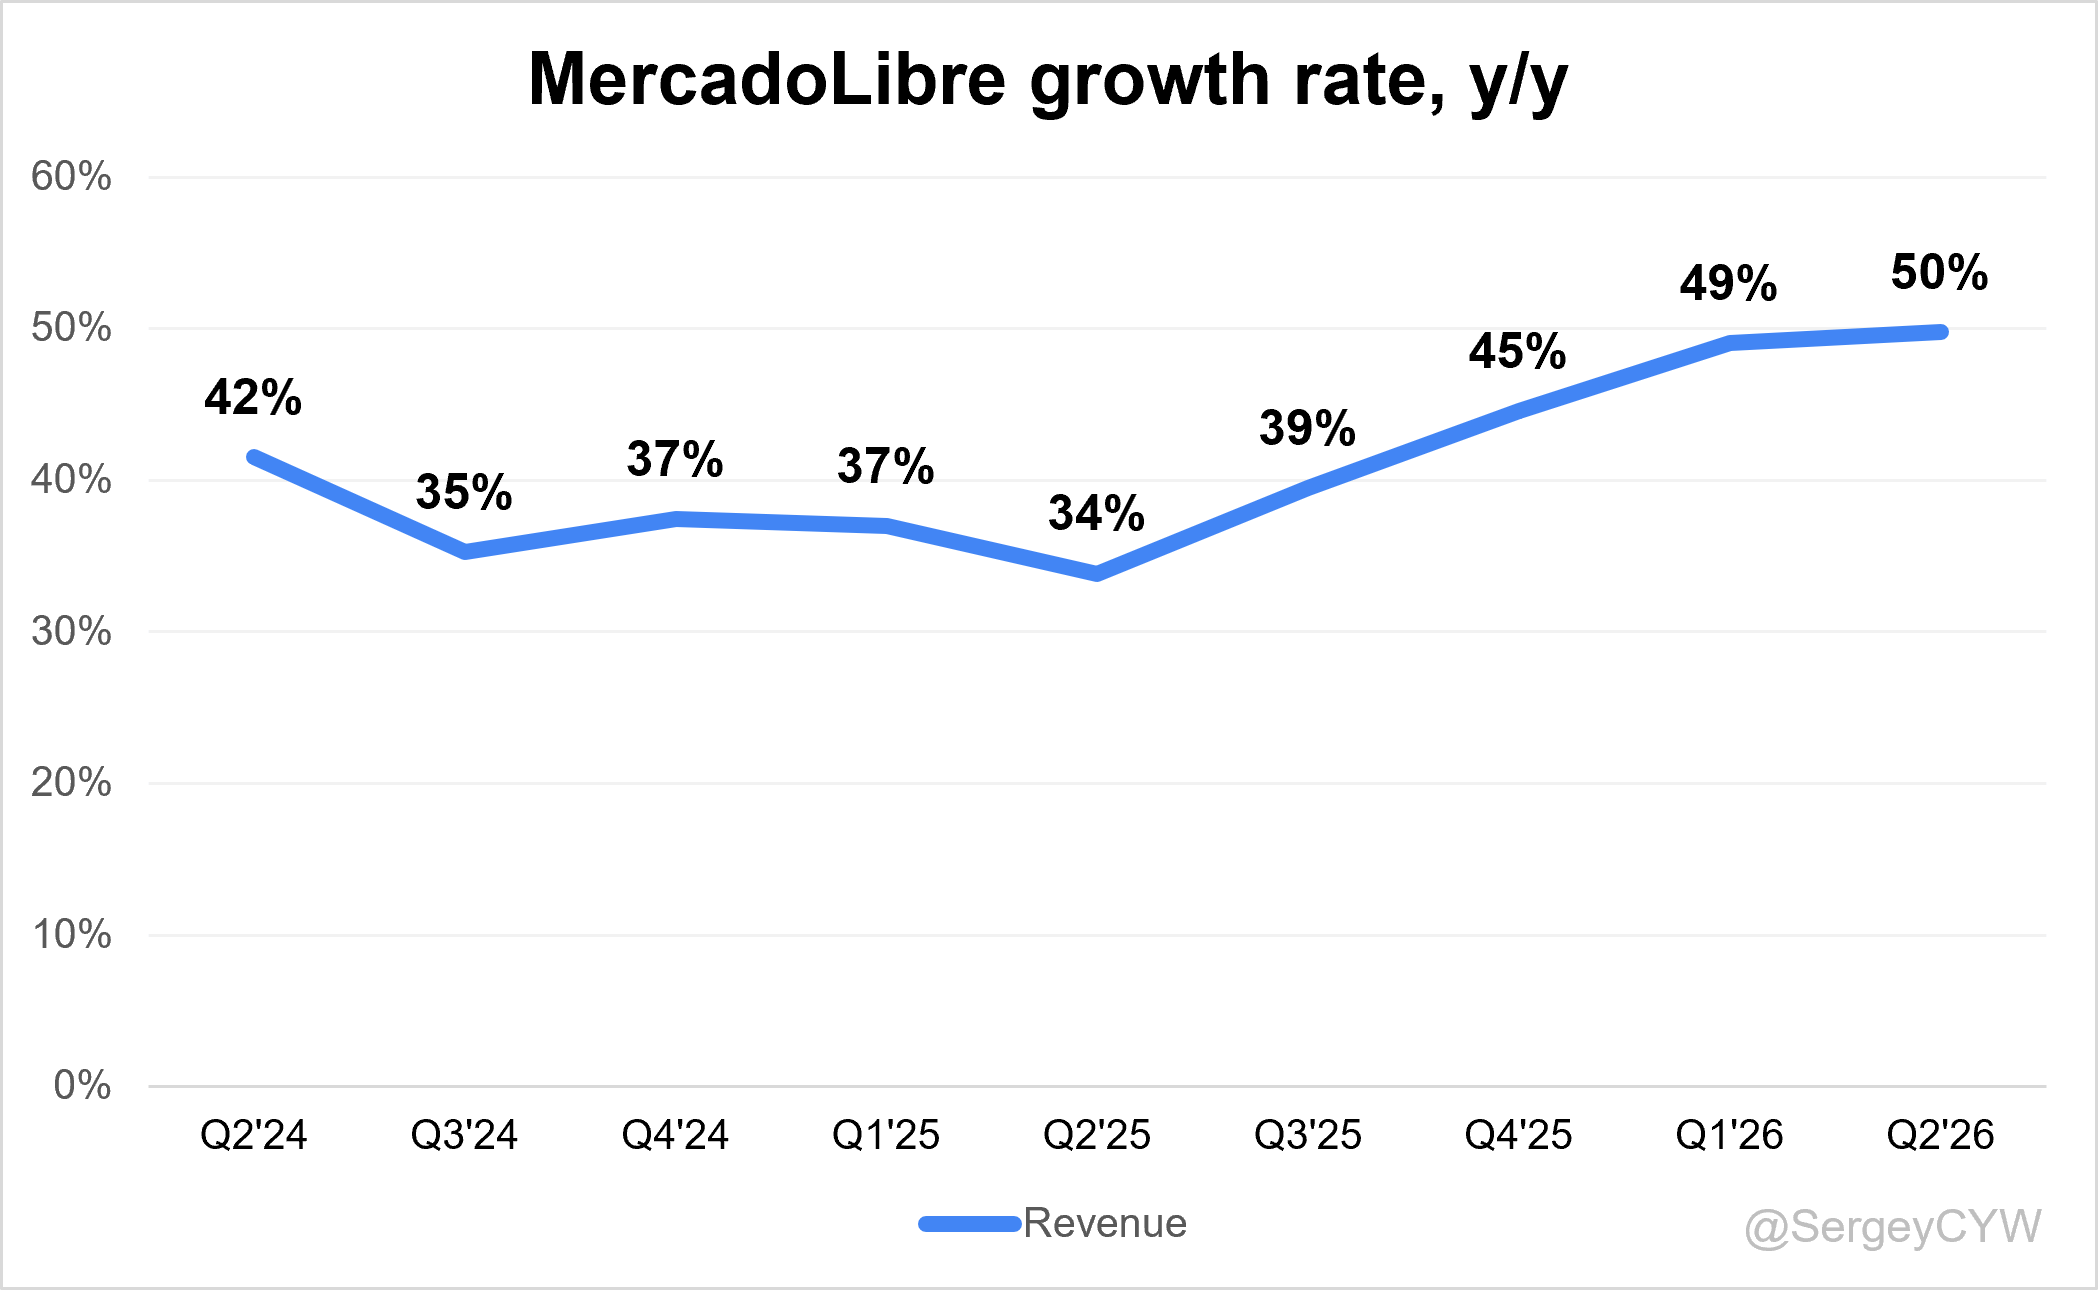
↗️$10,169M rev (+49.8% YoY, +15.0% QoQ) beat est by 3.8%
↘️GM (40.9%, -4.7 PPs YoY)🟡
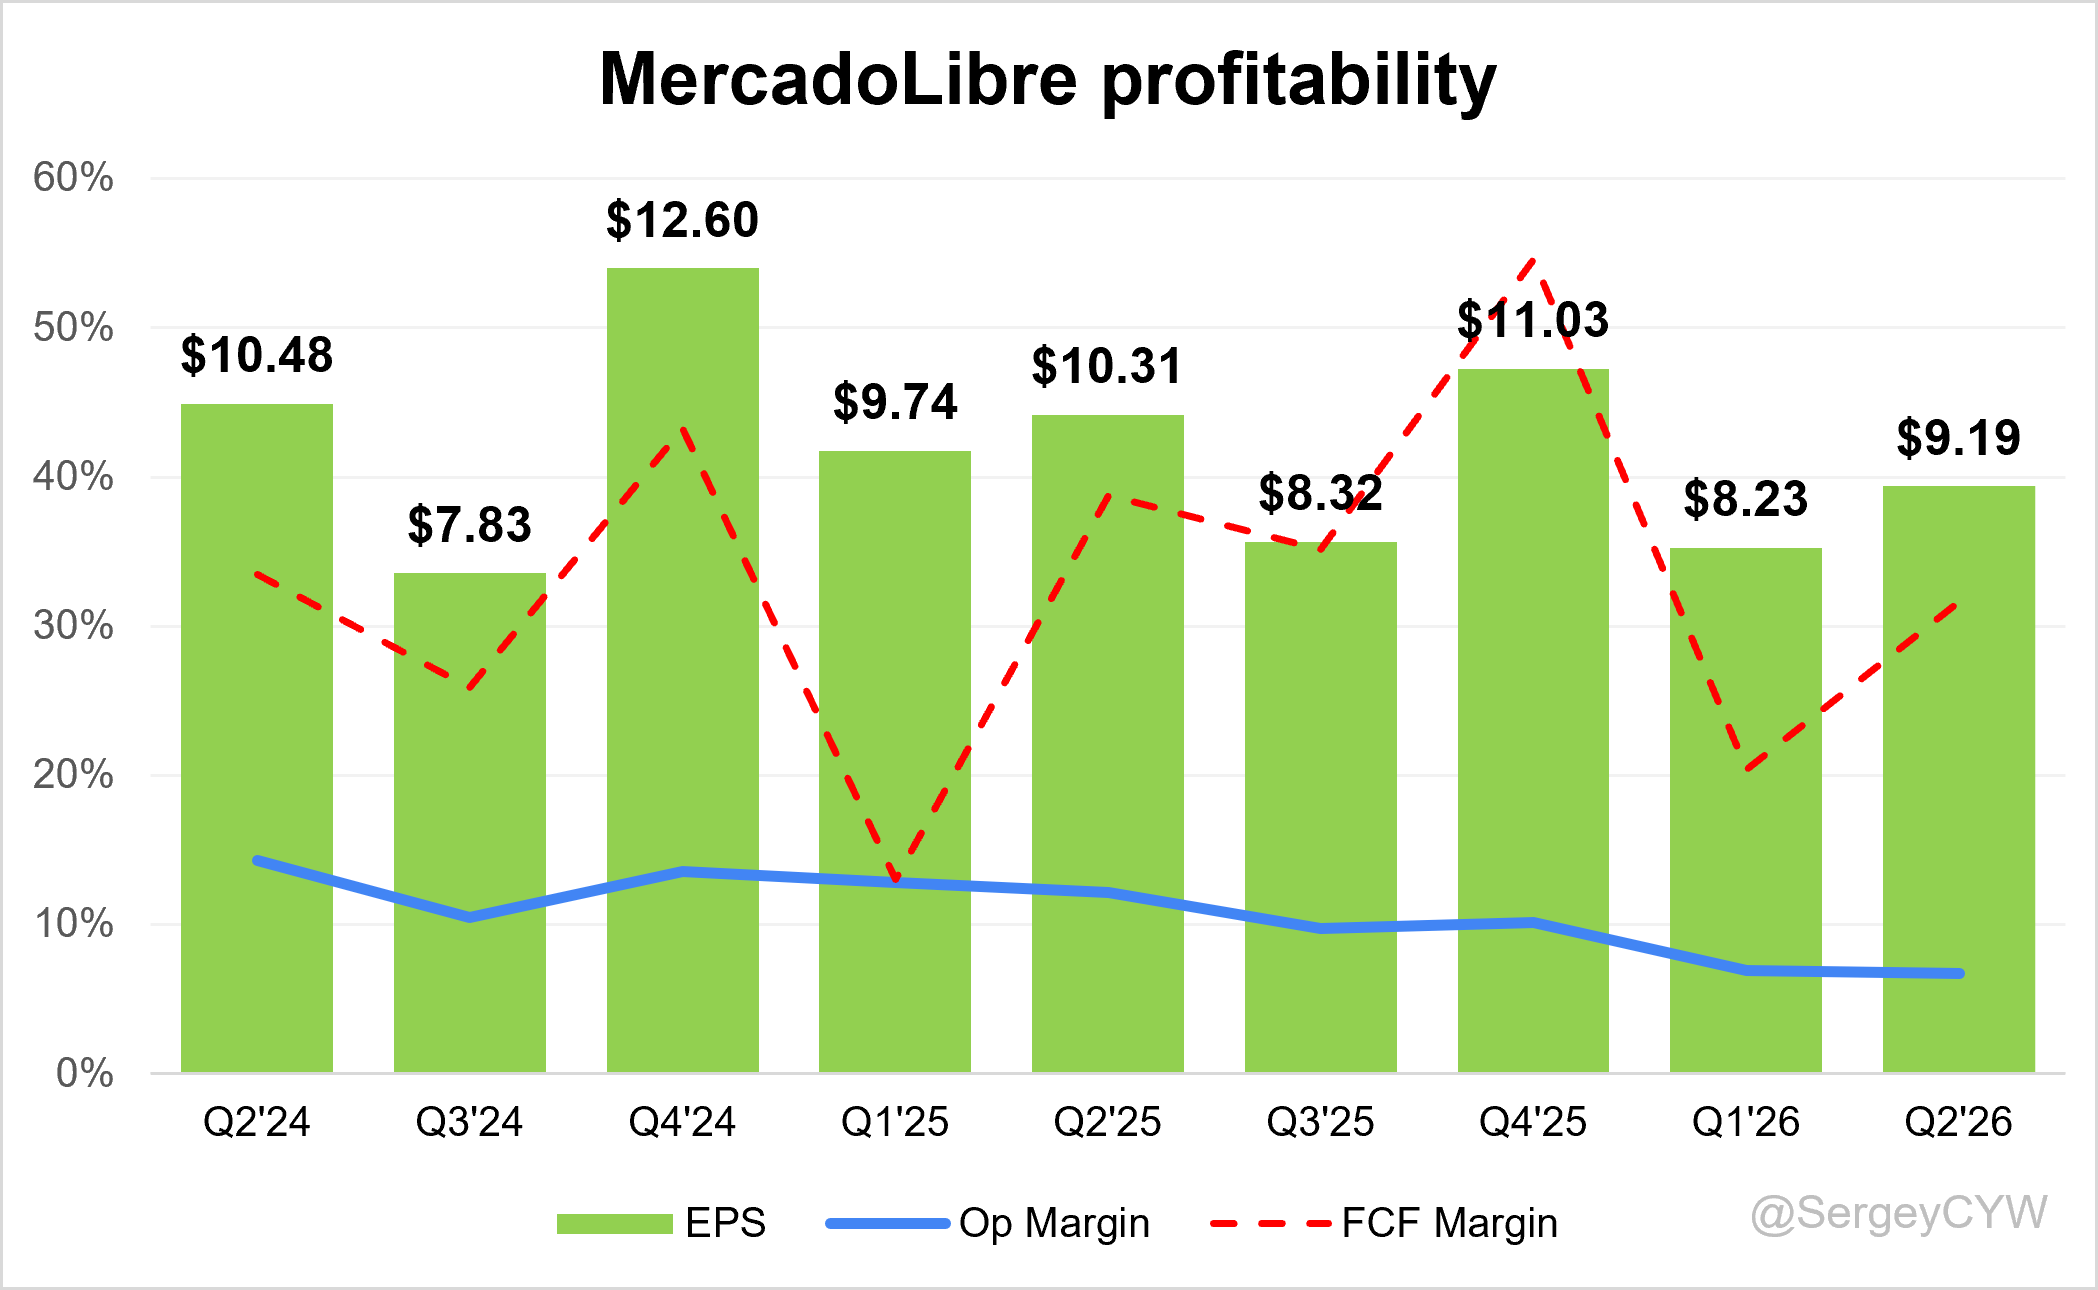
↘️Operating Margin (6.7%, -5.4 PPs YoY)🟡
↘️FCF Margin (31.7%, -7.1 PPs YoY)🟡
↘️Net Margin (4.6%, -3.1 PPs YoY)🟡
↗️EPS $9.19 beat est by 0.5%
Revenue By Segment
Commerce
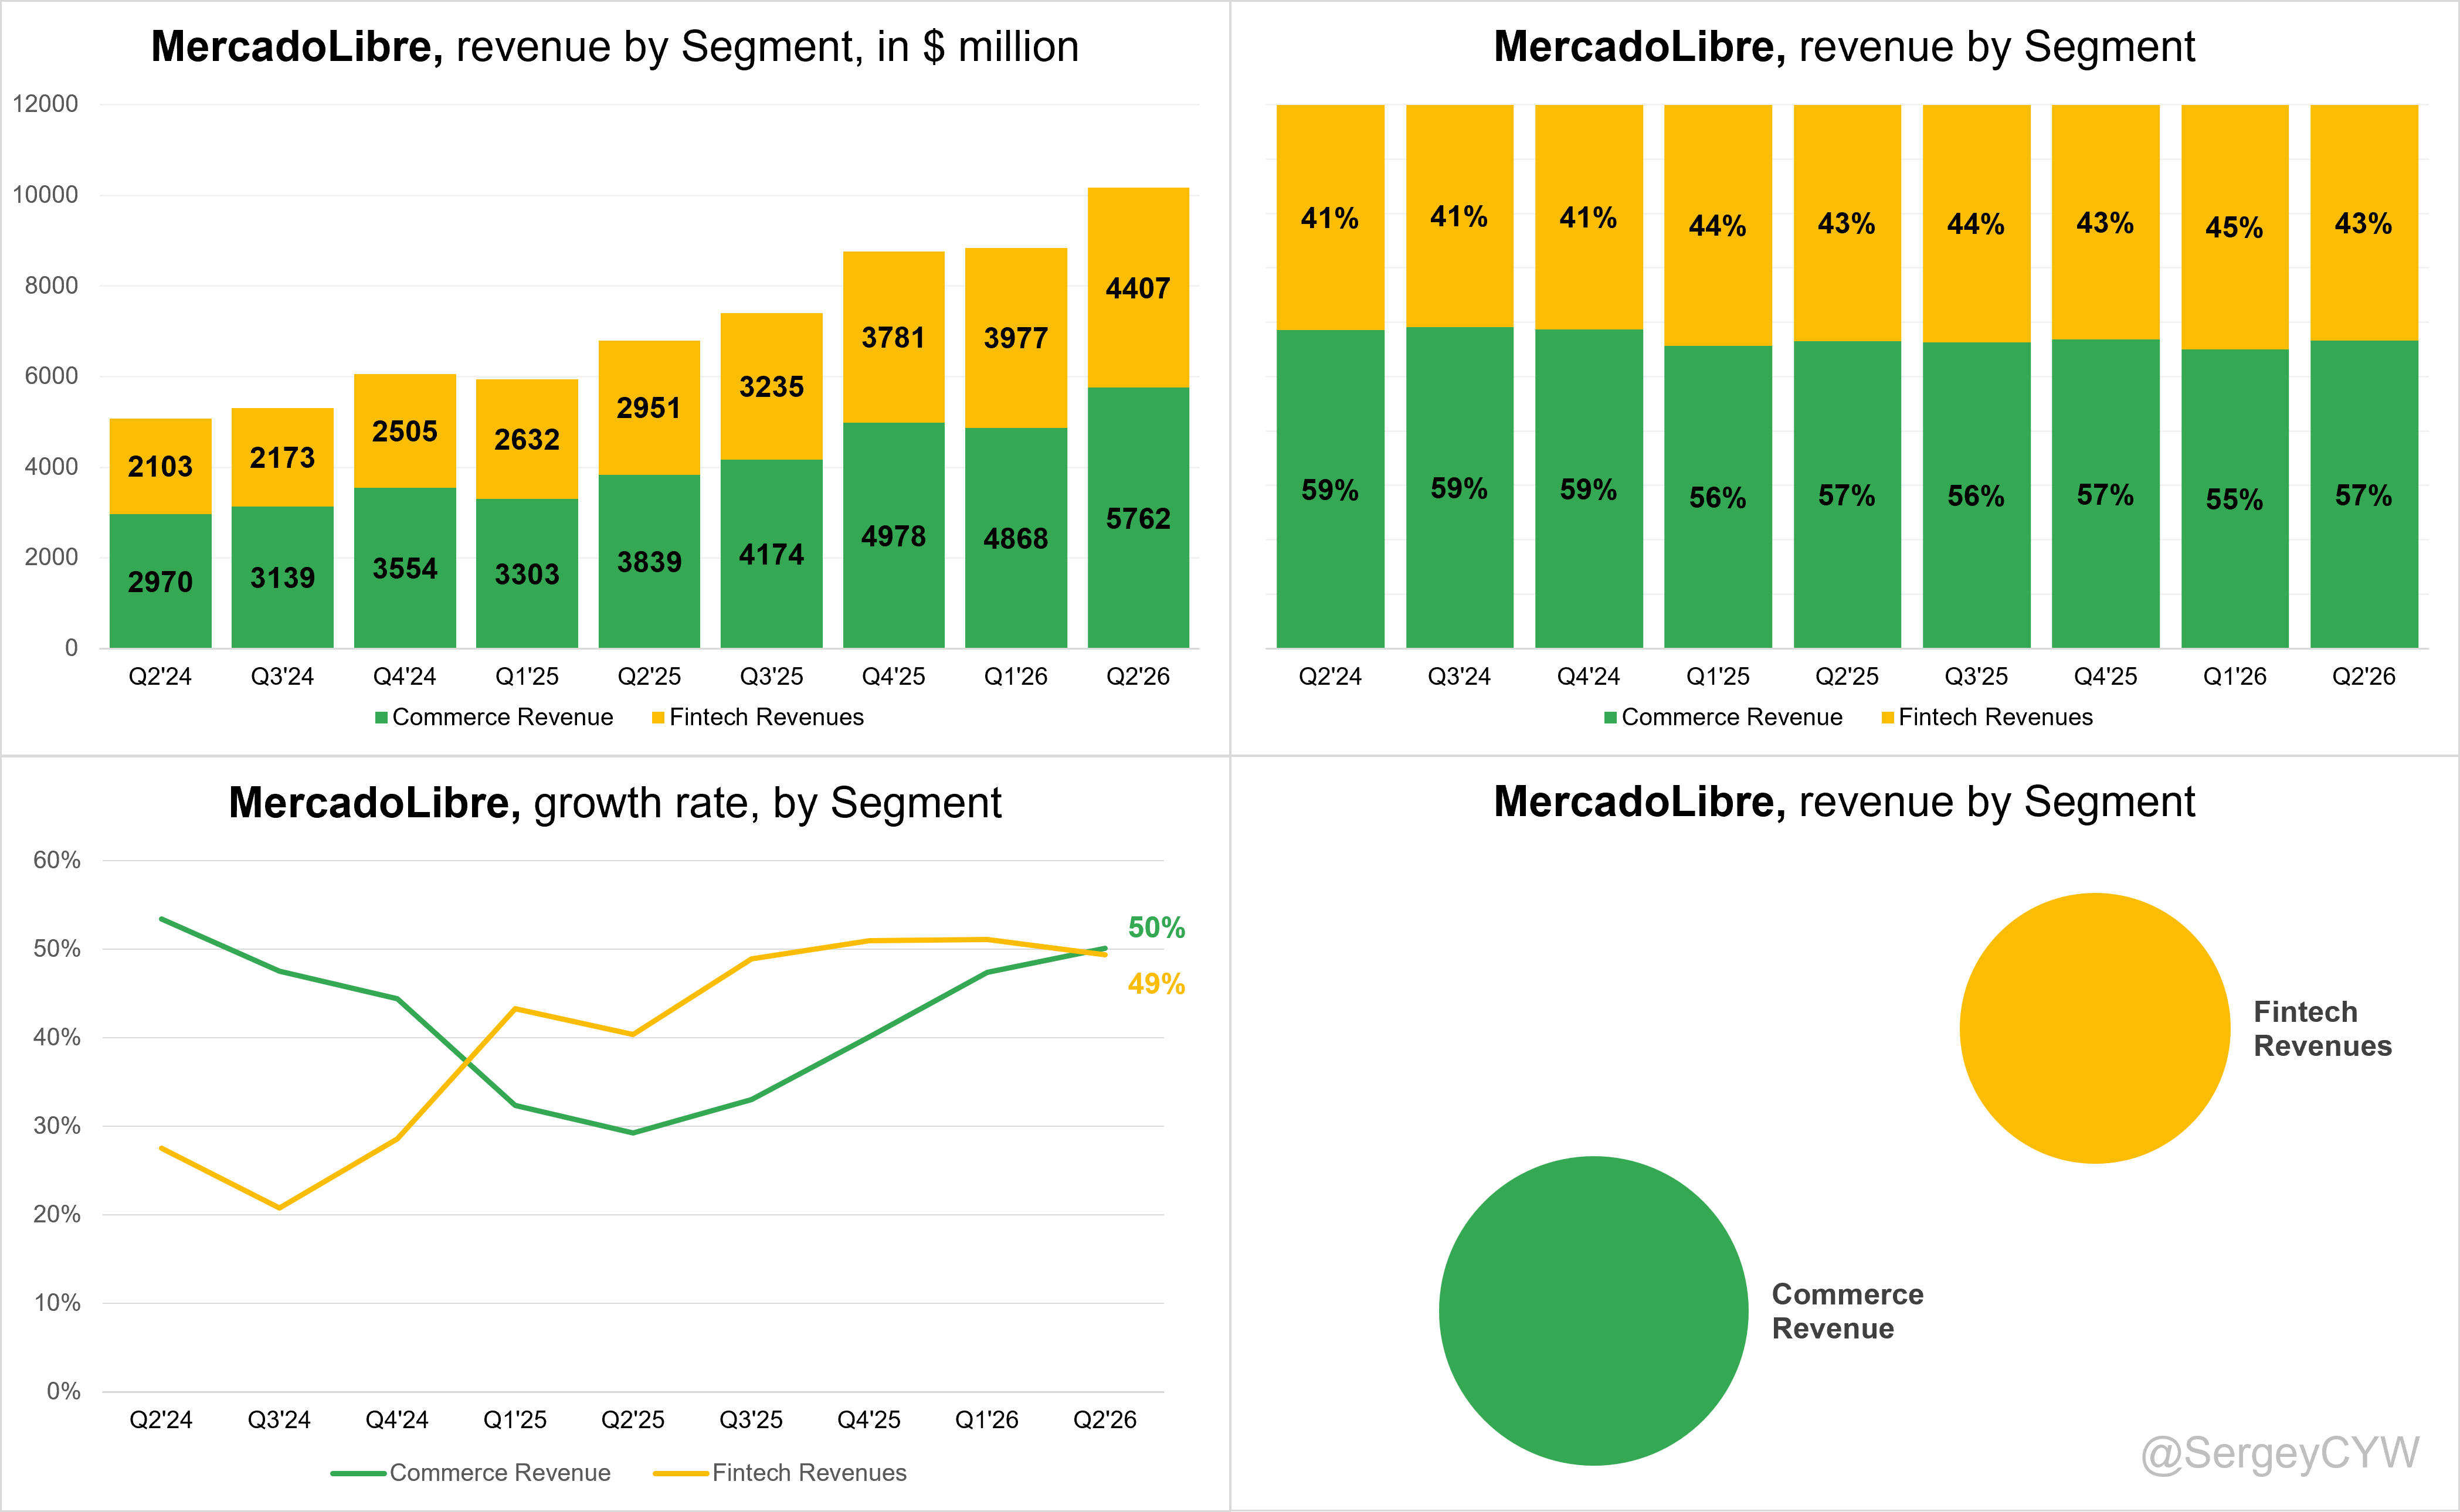
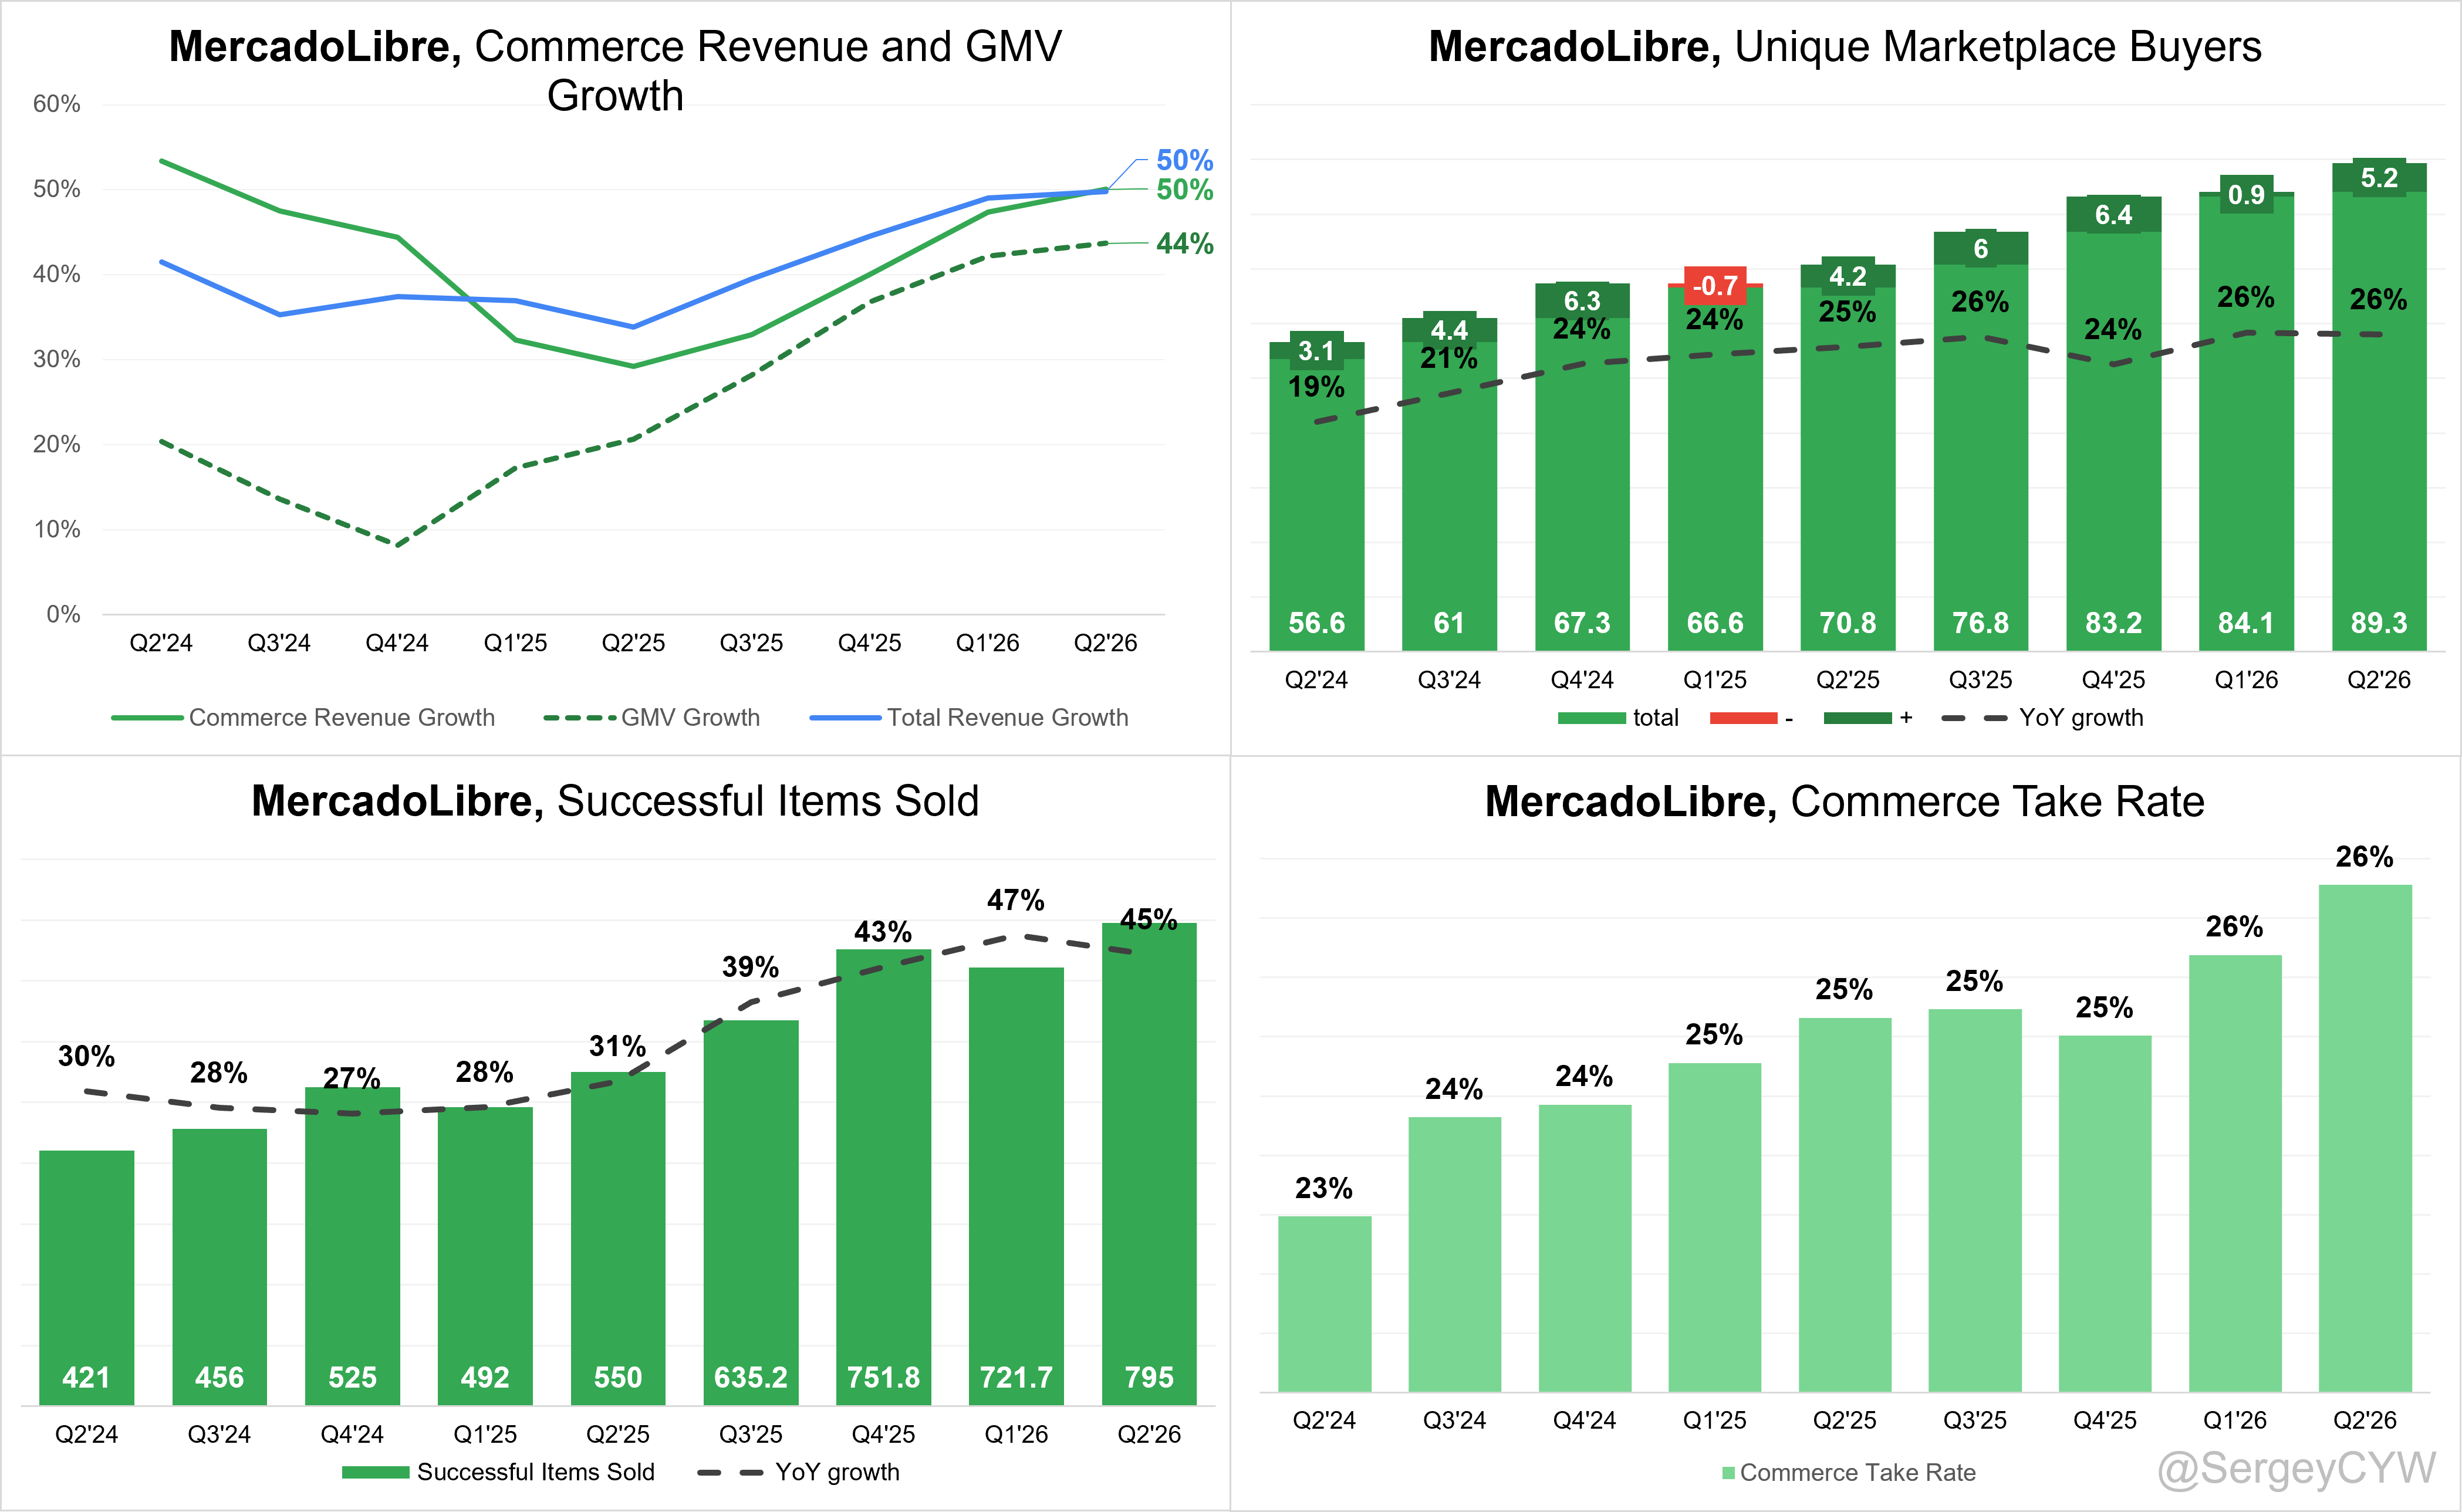
↗️$5,762M Commerce Revenue (+50.1% YoY, +40.0% FX-Neutral)
➡️$21,926M GMV (+43.7% YoY, +35.8% FX-Neutral)
↗️795M Successful Items Sold (+44.5% YoY, +73)
↗️89.3M Unique Marketplace Buyers ( +26.1% YoY, +5.2)
↗️Commerce Take Rate (26.3%, +0.6 PPs QoQ, +1.1 PPs YoY)🟢
Fintech
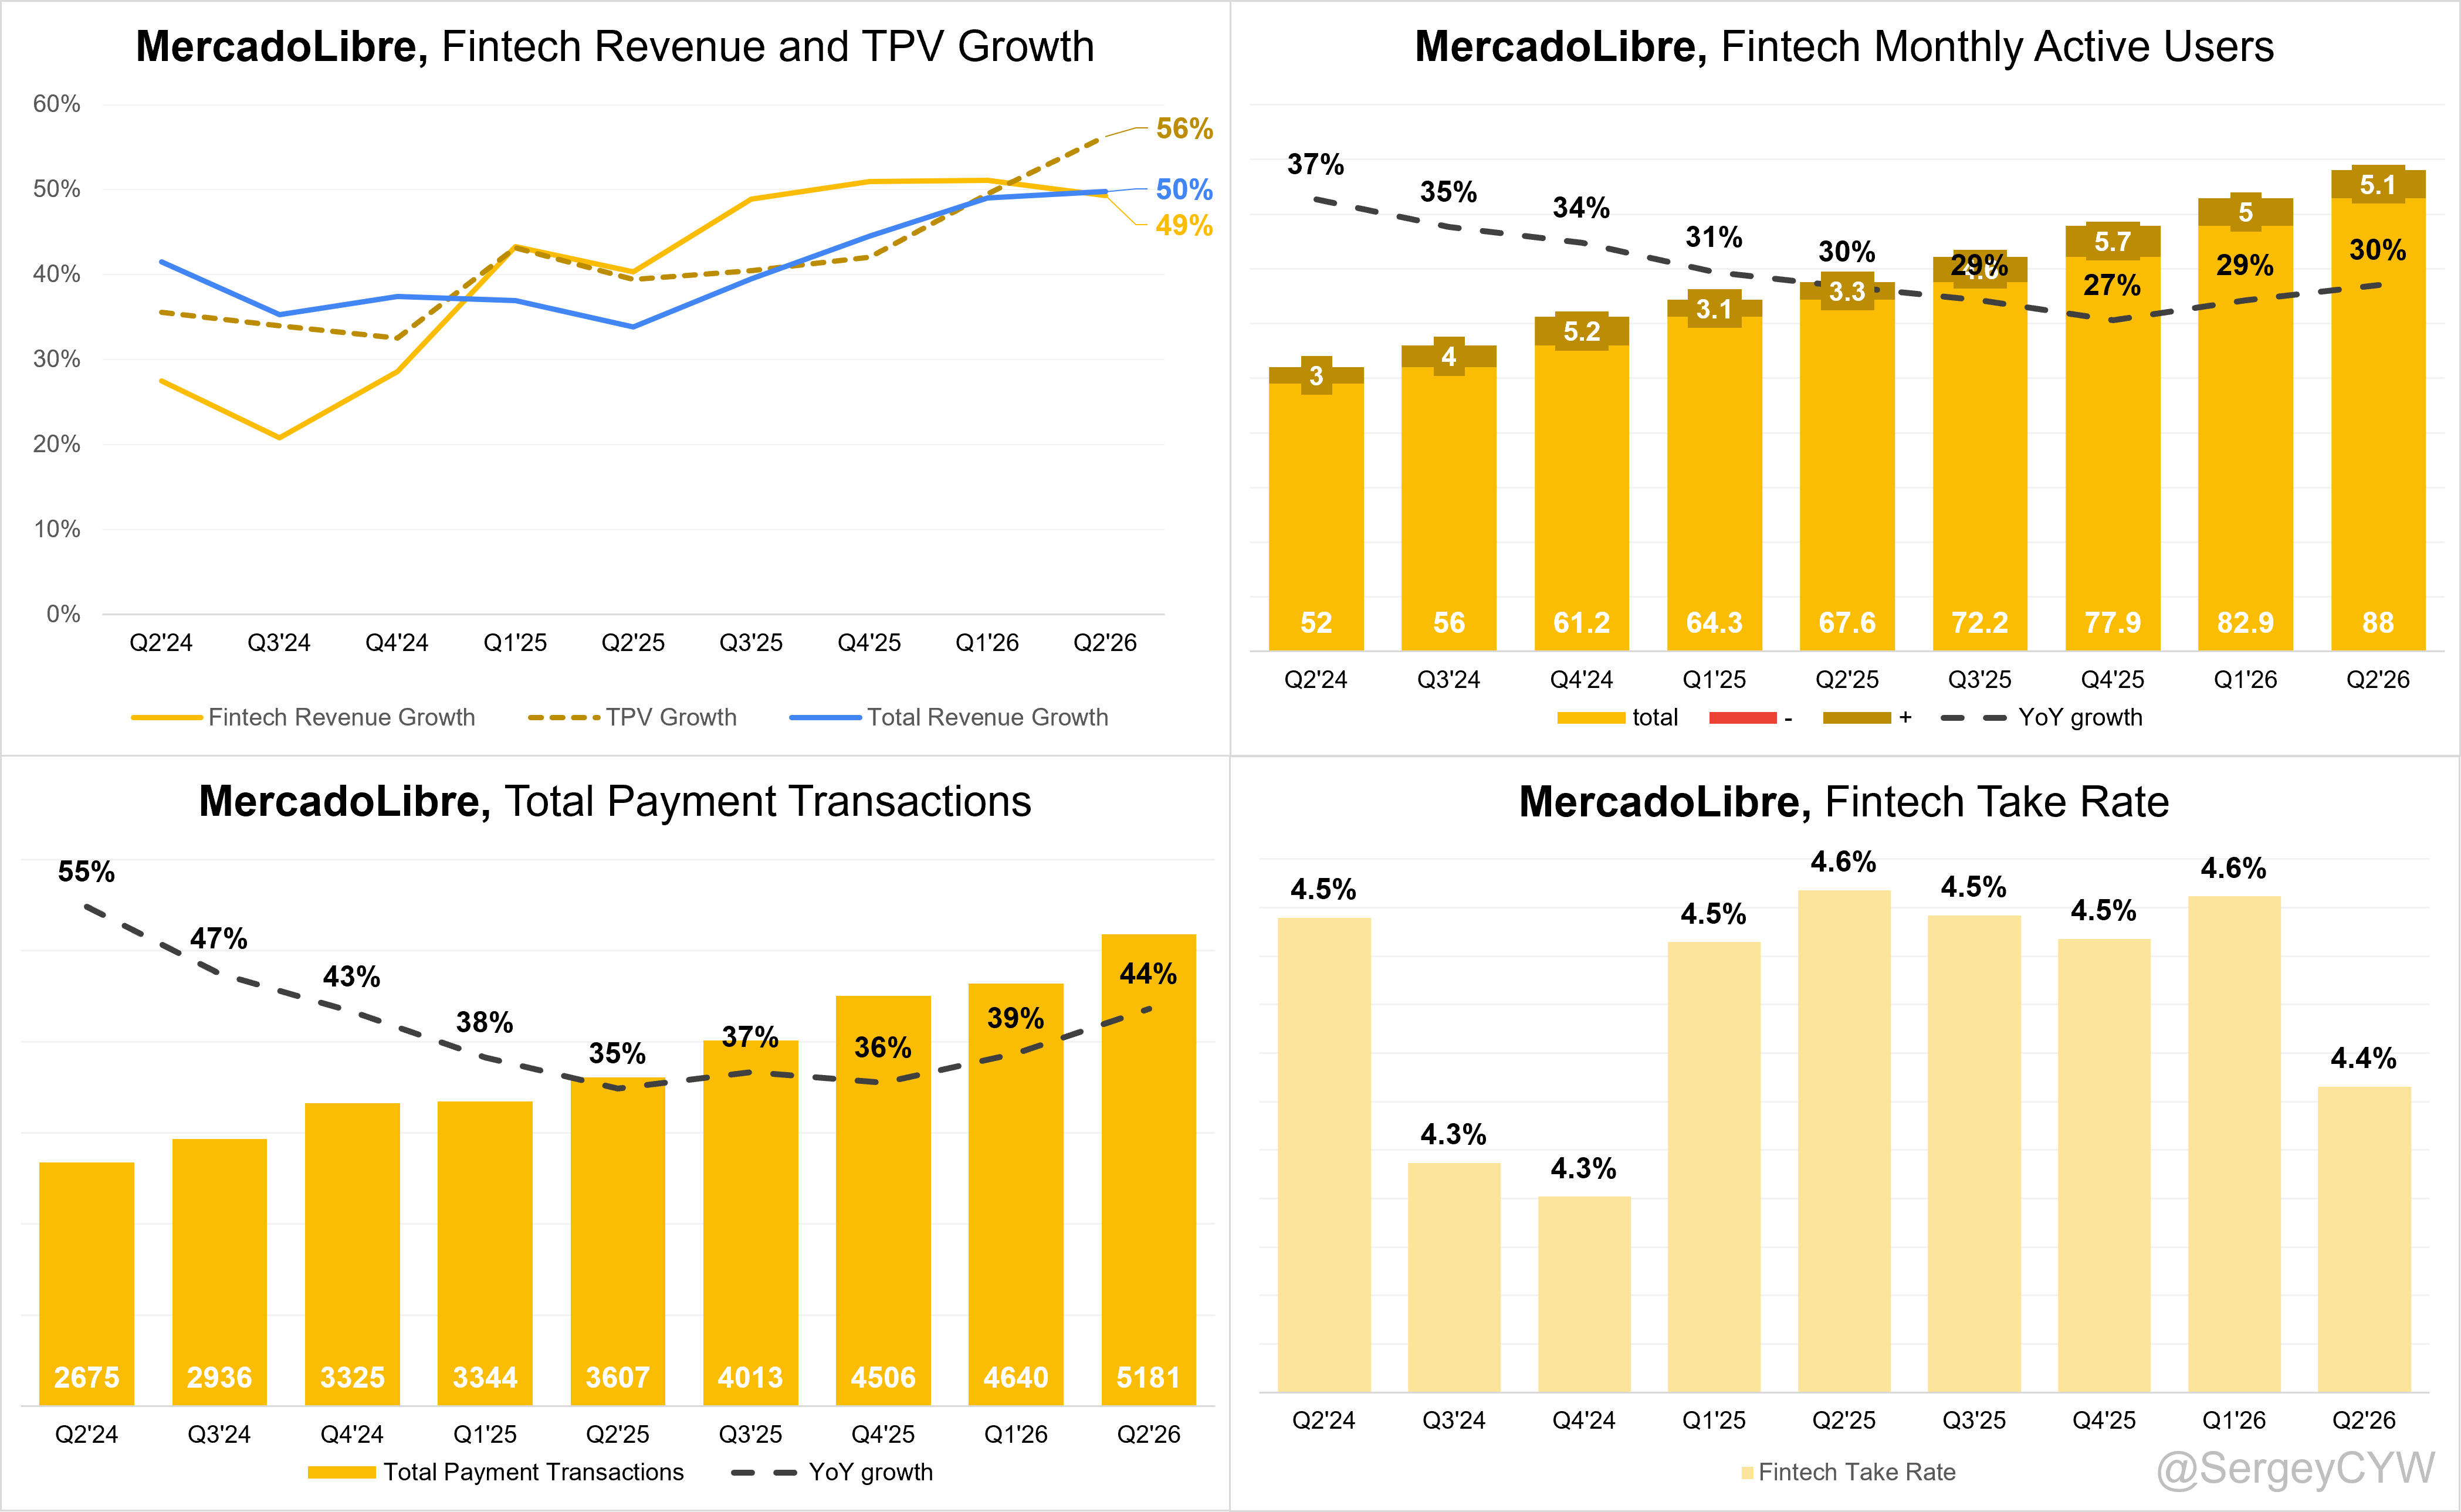
➡️$4,407M Fintech Revenue (+49.3% YoY, +47.0% FX-Neutral)
↗️$100,952M TPV (+56.3% YoY, +56.2% FX-Neutral)
➡️$5,181M Total Payment Transactions (+43.6% YoY)
↗️88.0M Fintech Monthly Active Users (+30.2% YoY, +5.1)
↗️Fintech Take Rate (4.4%, -0.2 PPs QoQ, -0.2 PPs YoY)🔴
Credit Portfolio
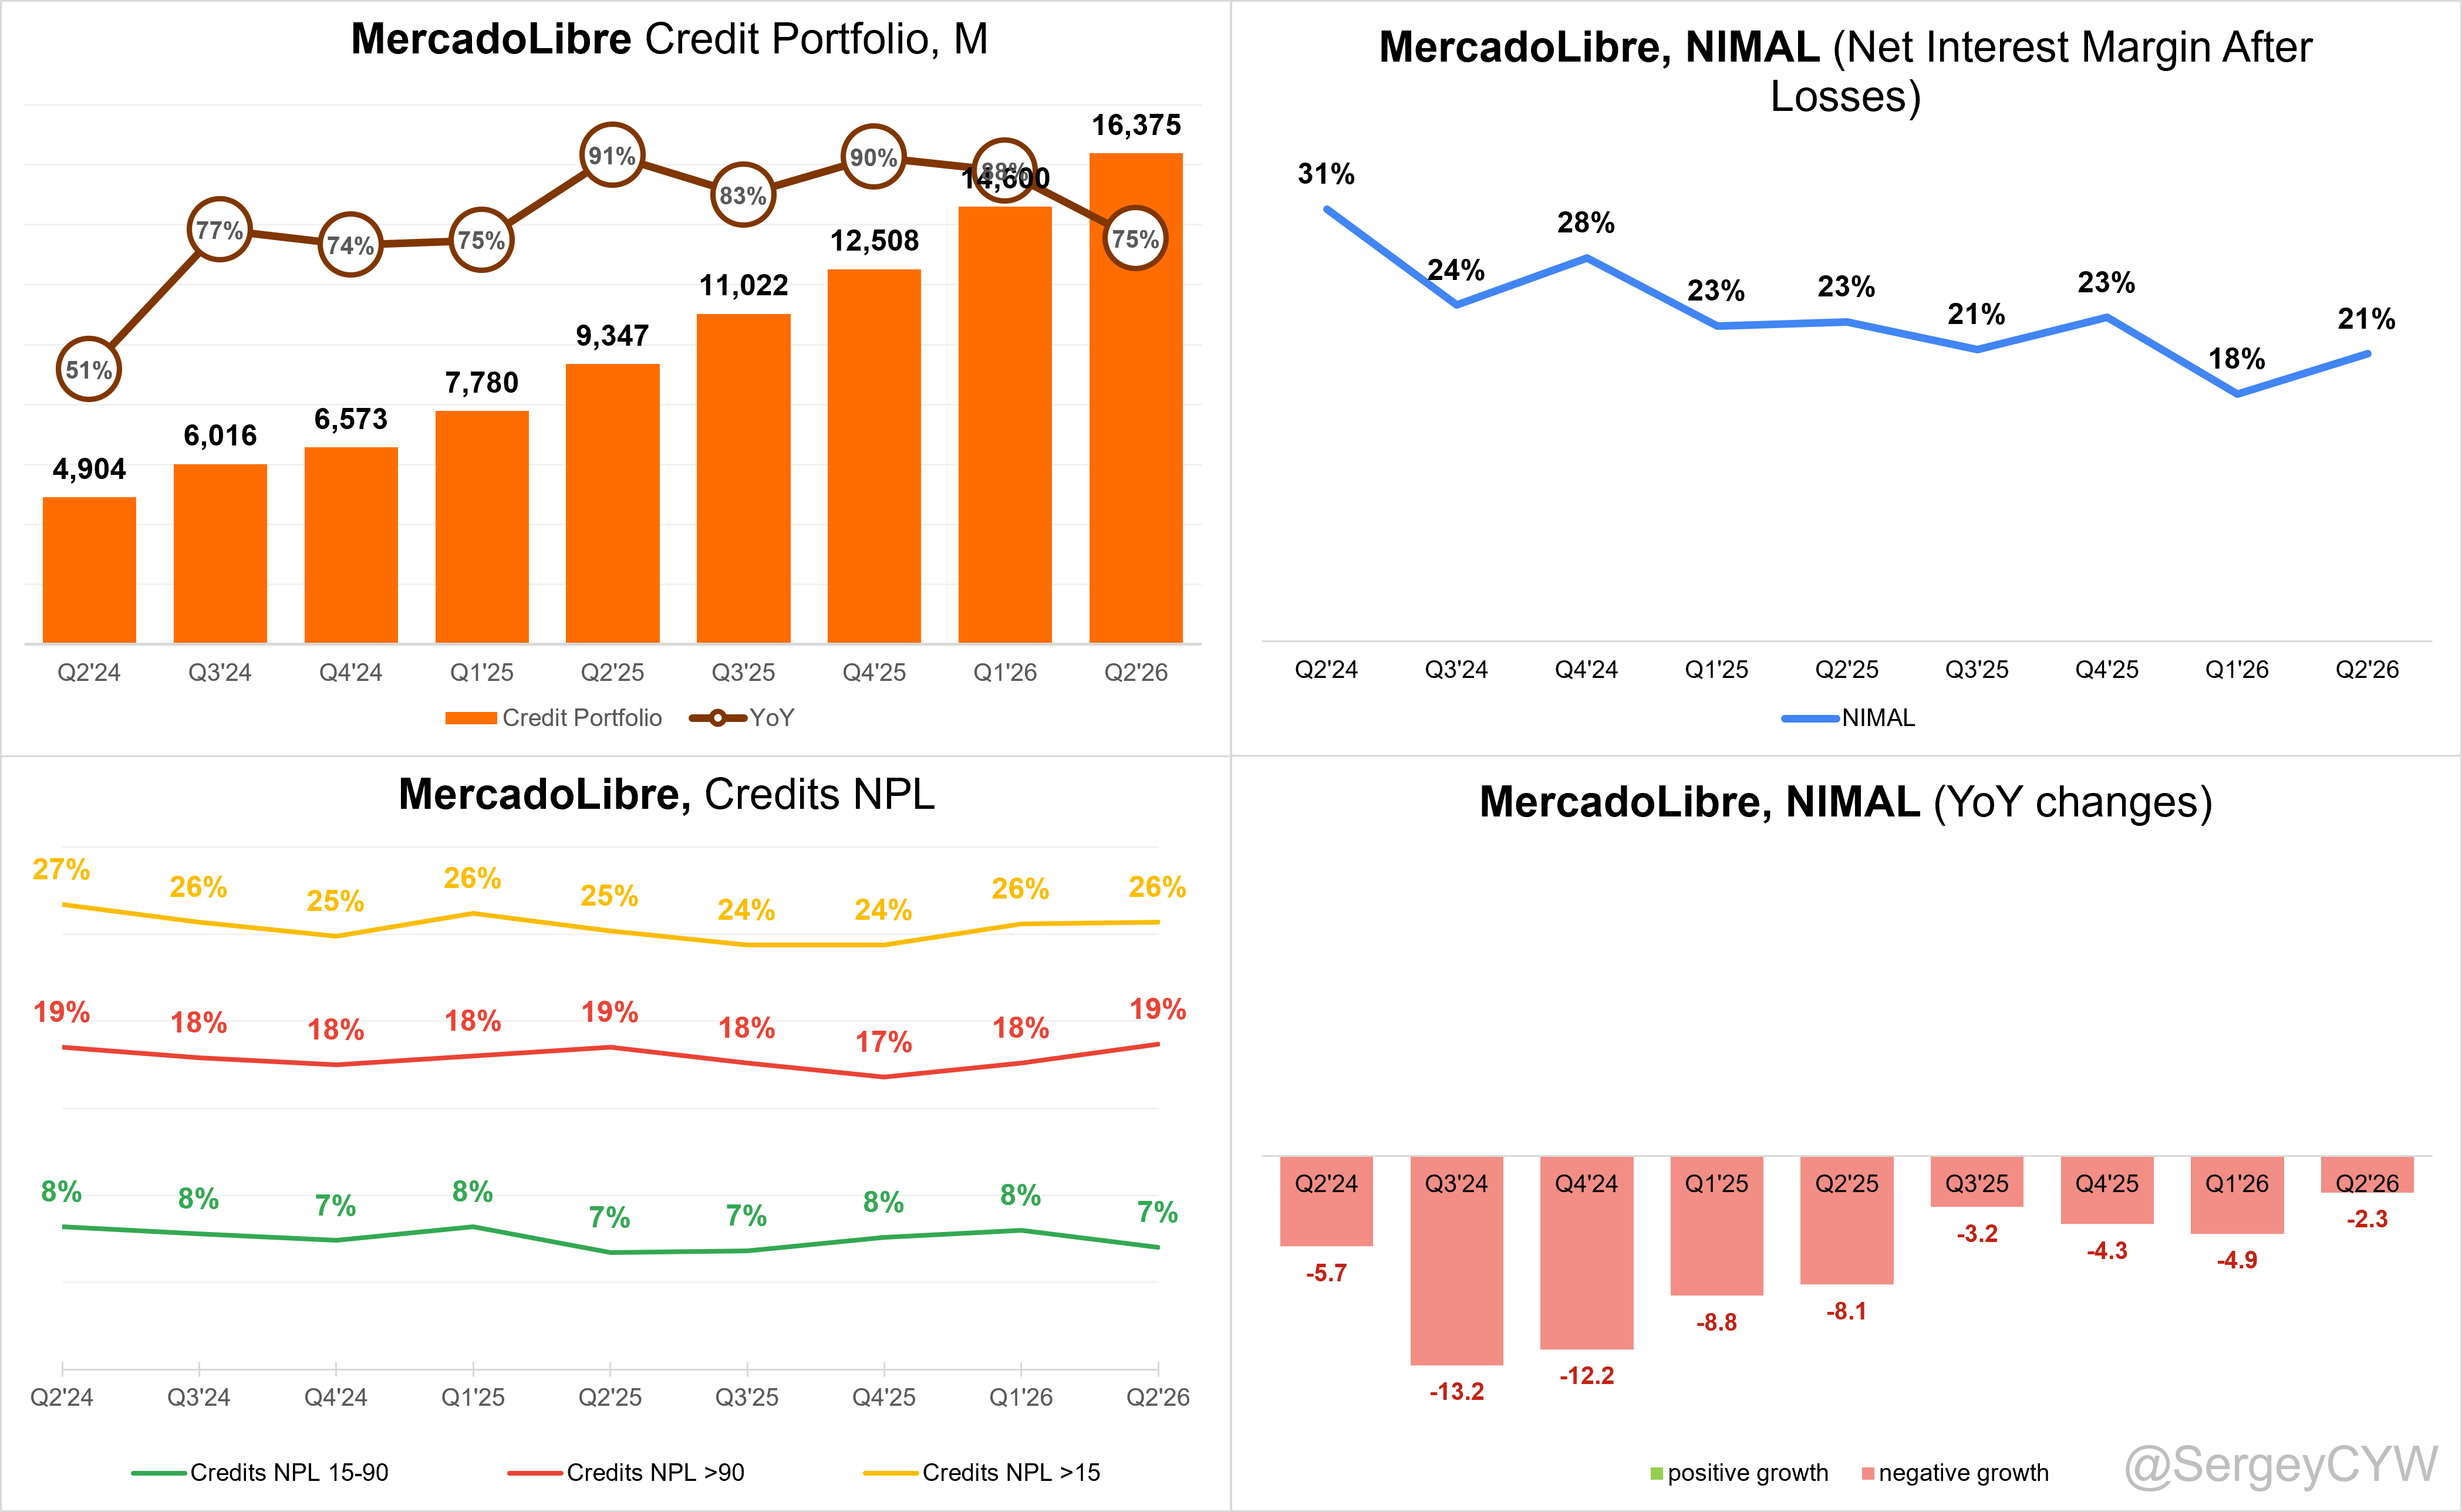
↗️$16,375M Credit Portfolio (+75.2% YoY)
↘️Credits NPL 15-90 (7.0%, -1.0 PPs QoQ)🟢
↗️Credits NPL >90 (18.7%, +1.1 PPs QoQ)🟡
↗️Credits NPL >15 (25.7%, +0.1 PPs QoQ)🟡
↗️NIMAL 20.7% (+2.9 PPs QoQ)🟡
Regional Breakdown
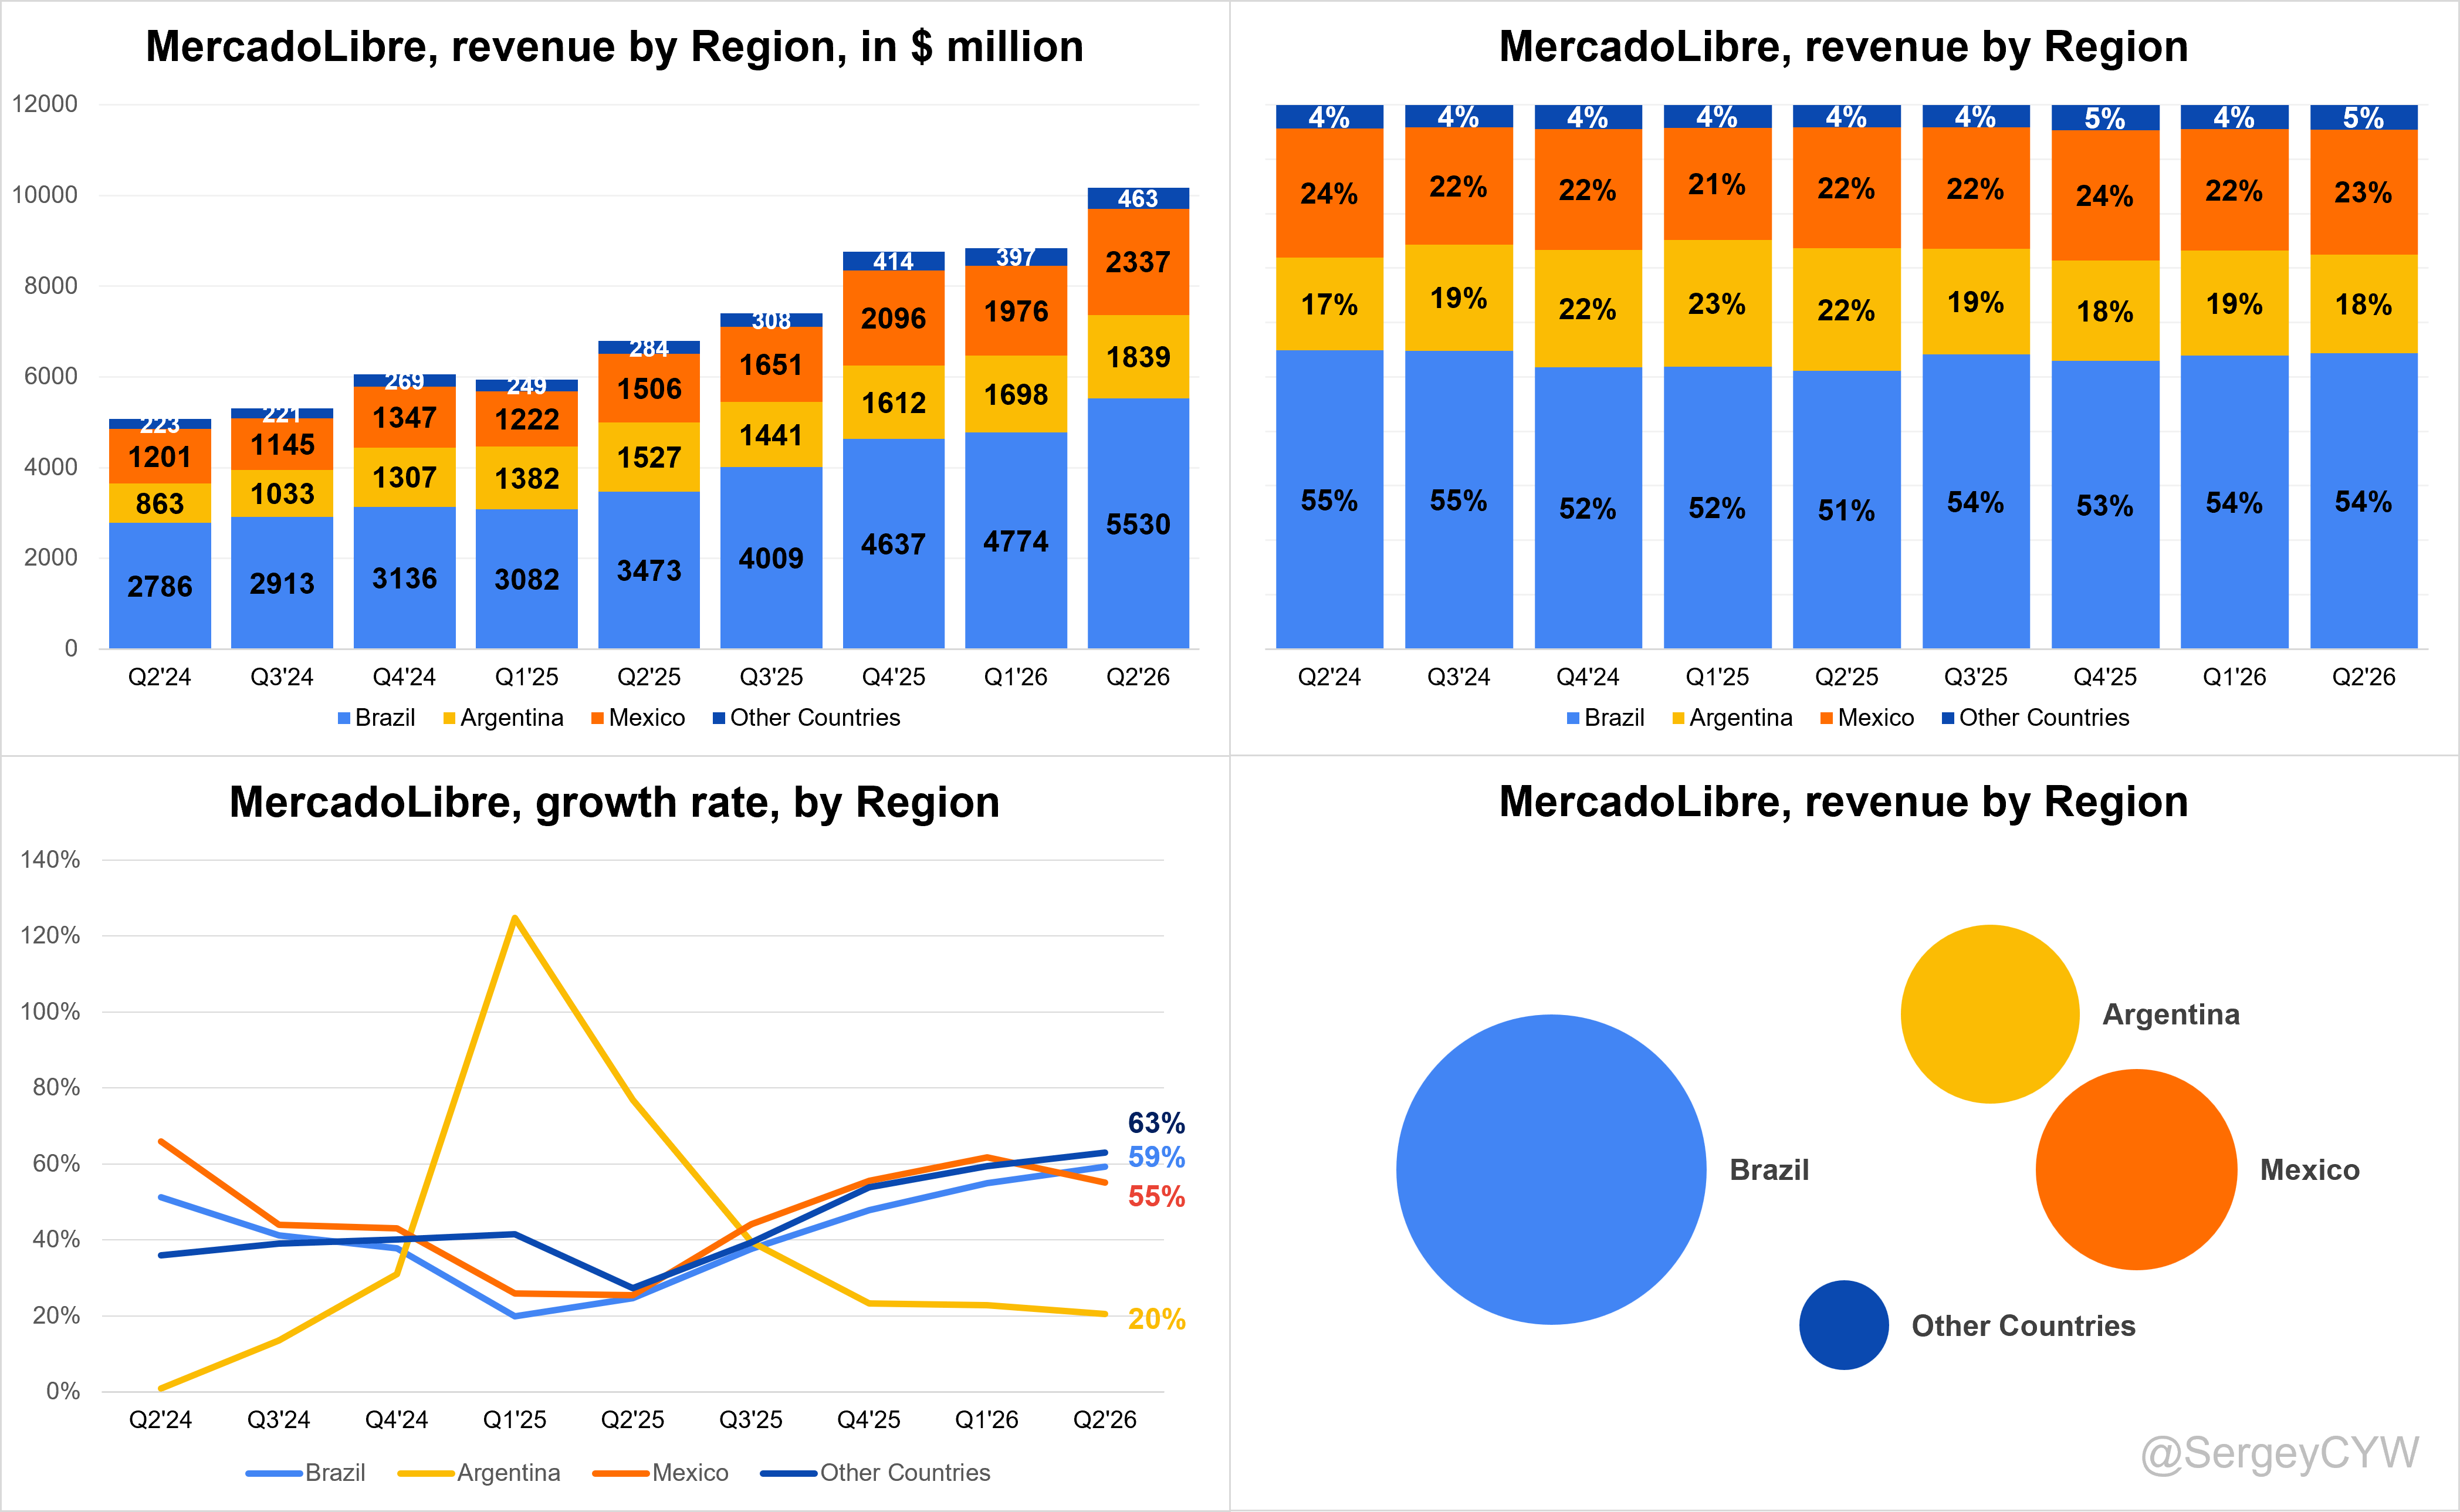
↗️Brazil $5,530M rev (+59.2% YoY, 54% of Rev)
↘️Argentina $1,839M rev (+20.4% YoY, 18% of Rev)
↗️Mexico $2,337M rev (+55.2% YoY, 23% of Rev)
↗️Other Countries $463M rev (+63.0% YoY, 5% of Rev)
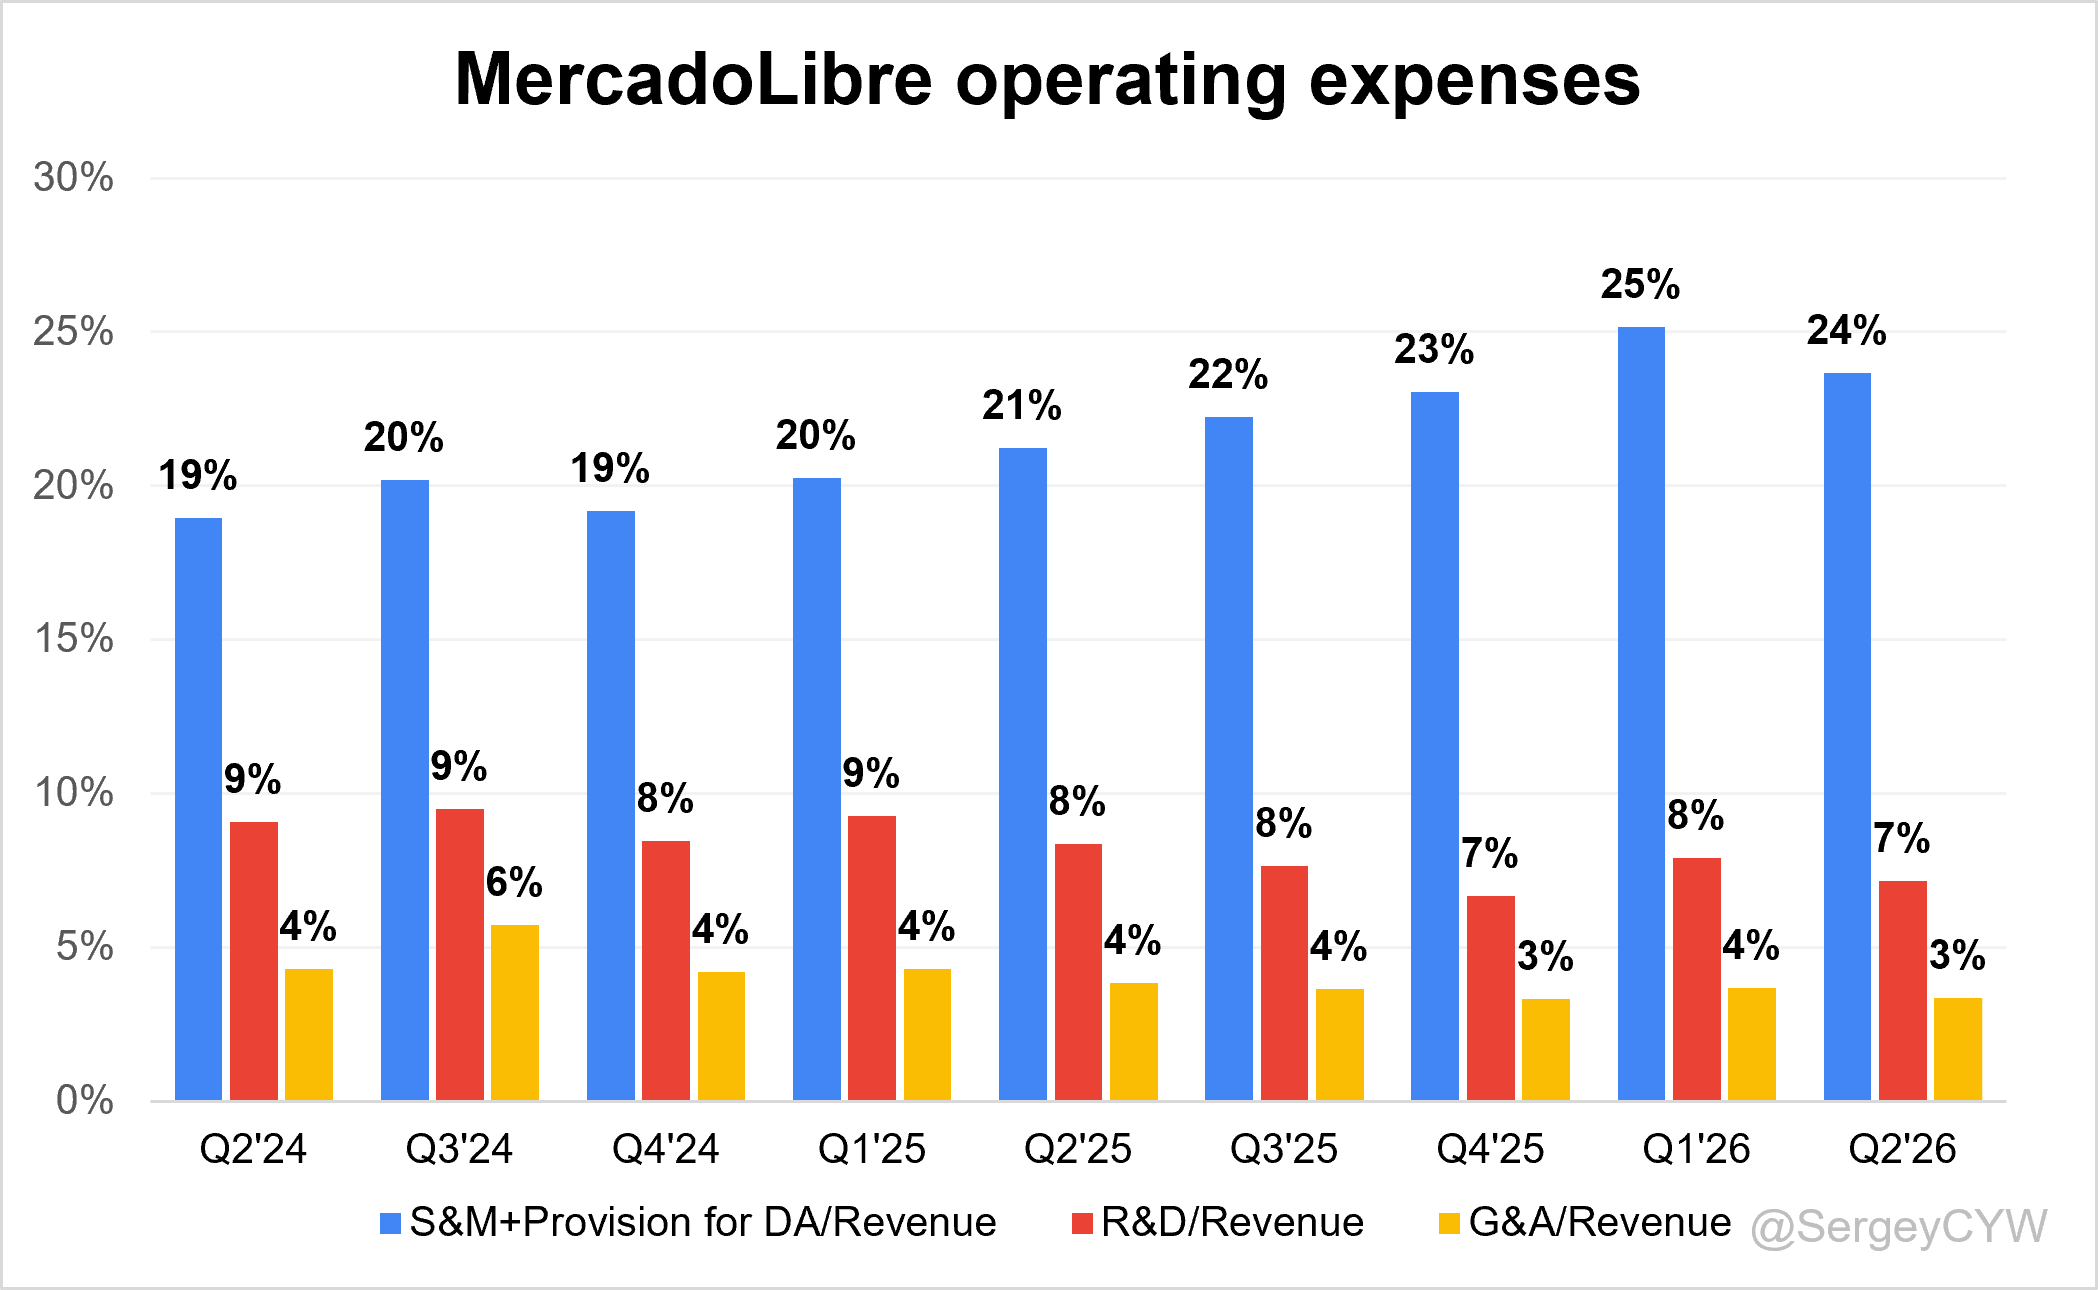
Operating expenses
↗️S&M+Provision for doubtful accounts/Revenue 23.7% (+2.4 PPs YoY)
↘️R&D/Revenue 7.2% (-1.2 PPs YoY)
↘️G&A/Revenue 3.3% (-0.5 PPs YoY)
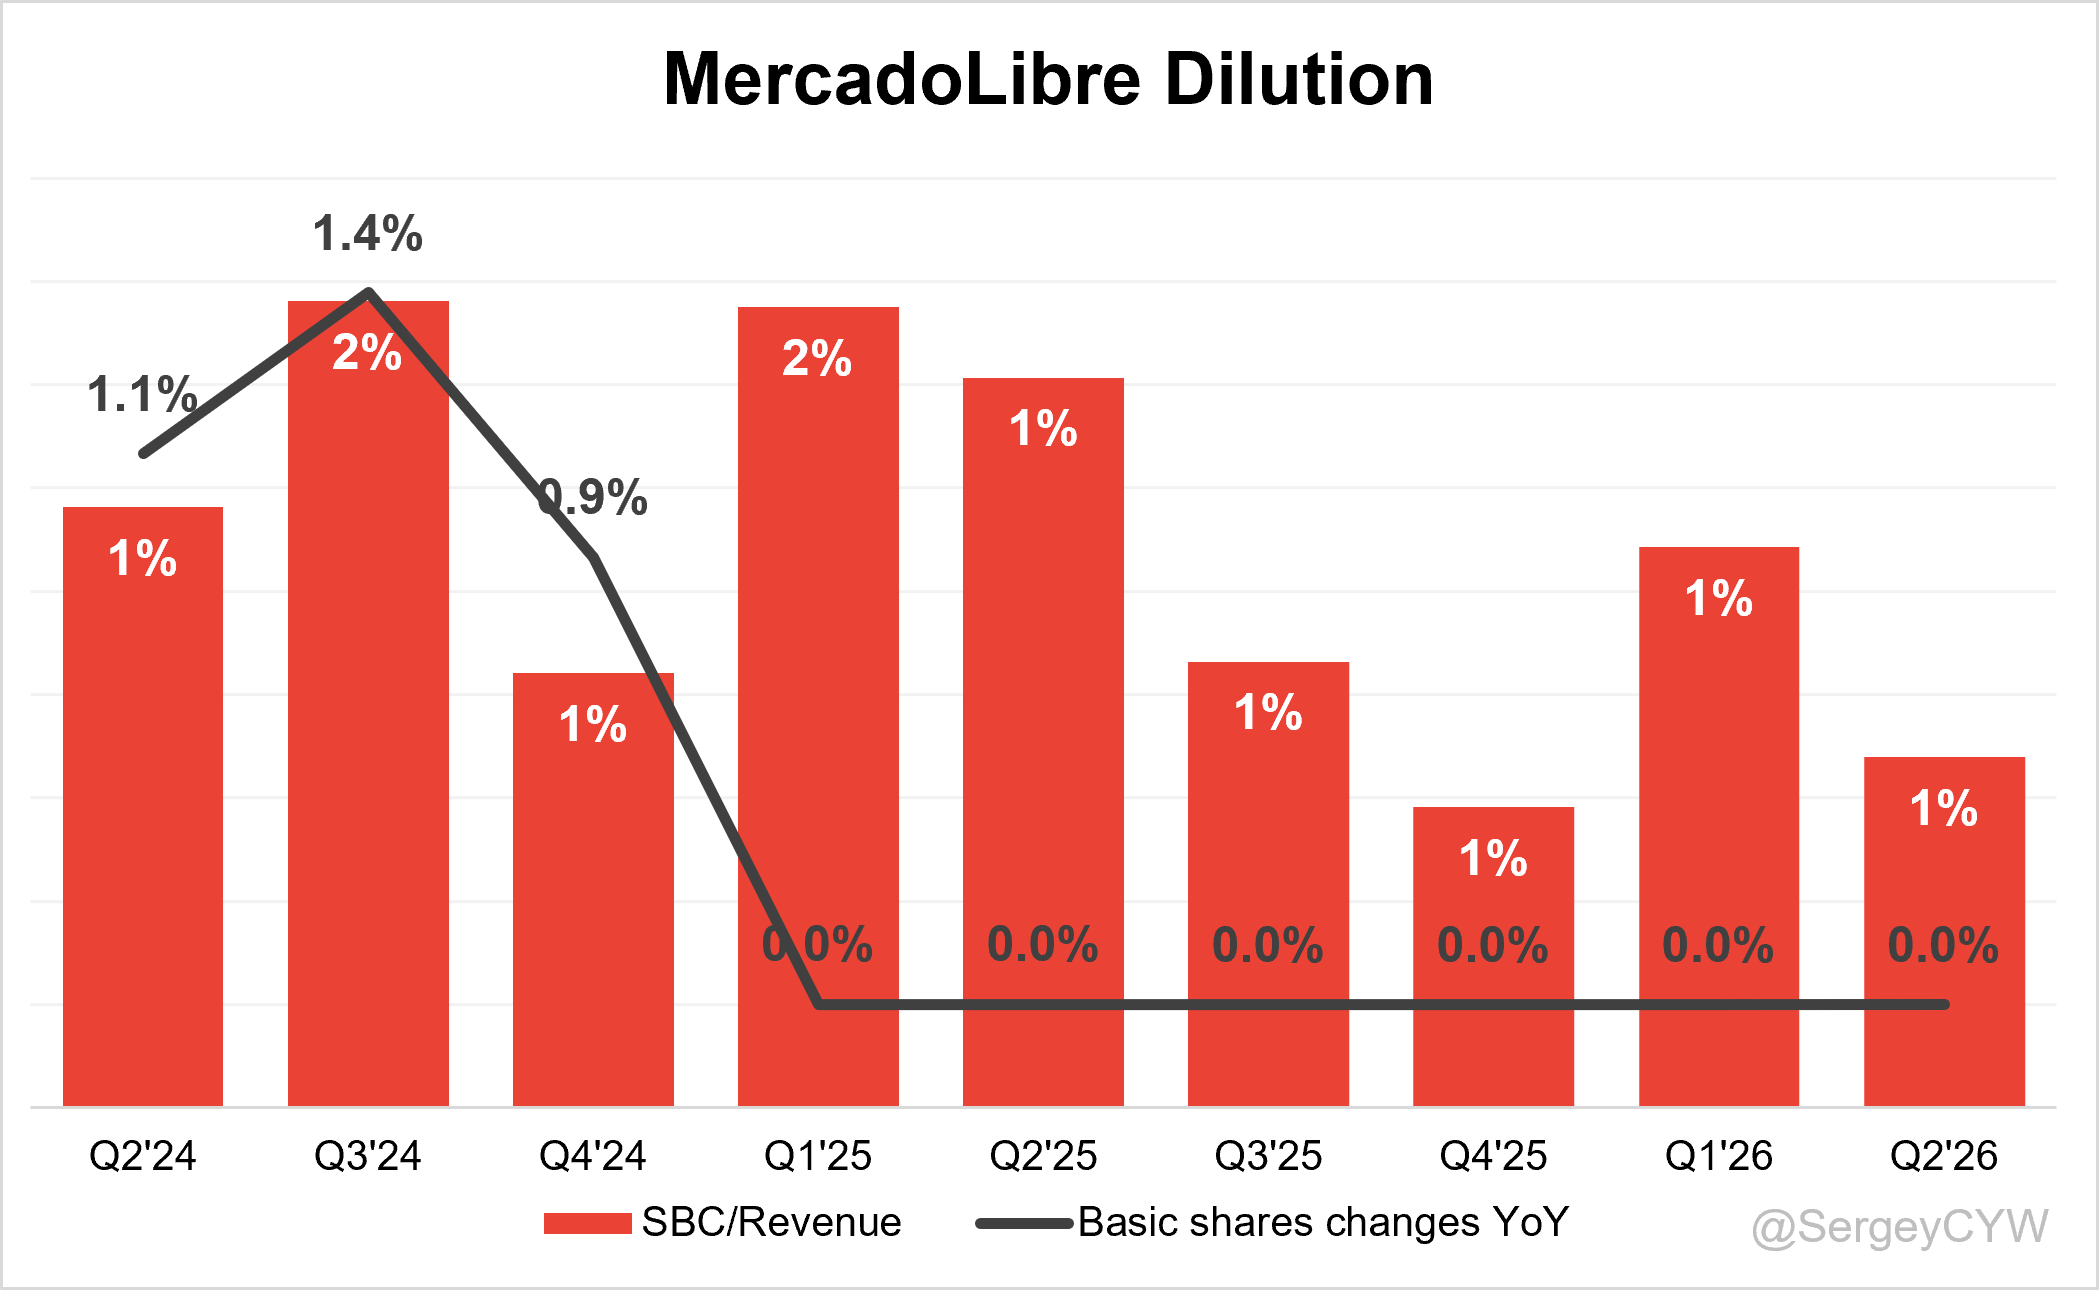
Dilution
↘️Basic shares down 0.0% YoY, -0.0 PPs QoQ🟢
↗️Diluted shares down 0.0% YoY, +0.0 PPs QoQ🟢
🟢Positive
Revenue rose +49.8% YoY to $10.17B, beat est by 3.8%. EPS reached $9.19, beat est by 0.5%.
Commerce revenue increased +50.1% YoY to $5.76B, andGMV grew 43.7% to $21.93B.
Successful items sold rose +44.5%, and unique buyers increased +26.1% to 89.3M.
Fintech revenue rose +49.3% YoY to $4.41 billion. TPV increased +56.3% to $100.95B, monthly active users rose +30.2% to 88M.
Credit portfolio rose +75.2% YoY to $16.38B. NIMAL improved 2.9 PPs to 20.7%.
Advertising revenue increased +73% YoY, supported by +66% rise in advertising orchestrator usage and better AI-driven targeting.
Brazil revenue grew +59.2% YoY, Mexico increased +55.2%, and other markets rose 63.0%.
China fulfillment-center volume increased +170% QoQ, while cross-border GMV grew +60% YoY.
AI improved efficiency across customer service and development, 90% of service interactions require no human involvement, and product development expense declined from 8.4% to 7.2% of revenue.
🟡Neutral
Operating margin 6.7%, stable QoQ but down 5.4 PPs YoY as management reinvested into growth.
Gross margin declined 4.7 PPs YoY to 40.9%, and net margin fell 3.1 PPs to 4.6%.
Loans >90 days increase +1.1 PPs QoQ to 18.7%.
Brazil credit card issuance accelerated from 1.6M to 2.6M, pressuring near-term profitability. Cohorts reach NIMAL breakeven within 12 to 18 months.
AI investment increased by approximately $80Ь YoY. Search and advertising applications generate positive returns, shopping assistant and gamification remain in testing.
Argentina revenue grew +20.4% YoY, slower than Brazil and Mexico, but credit-card adoption remained in line with expectations.
🔴Negative
FCF margin declined -7.1 PPs YoY to 31.7%, reflecting higher investment in credit, and logistics.
Fintech take rate declined 0.2 PPs YoY and QoQ to 4.4%.
Margins faced pressure from lower seller take rates, Pix discounts, free shipping, first-party commerce, higher energy costs and chip inflation.
Mexico faced tax reform, weaker consumption and World Cup-related spending pressure.
Strong Q2 from MELI. Revenue growth accelerated to +49.8% YoY, beating estimates by 3.8%. However, on a constant-currency basis, revenue growth slightly slowed to +42.9% YoY.
MELI has two main business segments, E-Commerce and Fintech, and both delivered strong growth in Q2.
E-Commerce revenue growth accelerated to +50.1% YoY, or +40% in СС. Items sold increased +56% YoY, driven by the rollout of free shipping. Items purchased per buyer rose +19%, and purchase frequency increased +20%. Conversion improved by +1.1 PPs YoY.
MELI added 5.2M new unique marketplace buyers, a record for a second quarter. GMV growth accelerated to +44% YoY, or +36% in СС. GMV growth remained high but below E-Commerce revenue growth, which is positive and suggests MELI is generating more revenue from adjacent services attached to each transaction.
Successful items sold on MELI’s E-Commerce platform increased by 72M during Q2, a second-quarter record and one of the highest additions in company history.
Fintech revenue growth slightly slowed to +49.3% YoY, or +47% in СС. TPV growth accelerated to +56%, or +56.2% in СС. TPV is growing faster than GMV, users are actively using Mercado Pago outside the marketplace, it strengthens customer loyalty and expands MELI’s ecosystem.
MELI is actively increasing credit card adoption among users. Credit portfolio grew +75% YoY to $16.B, becoming a major part of the business. On one side, this strengthens customer loyalty and improves retention. On the other side, it increases asset-quality risk for the entire company.
Loans with NPL >90 days have now increased for two consecutive quarters. In Q2, the delinquency ratio reached 18.7%, making it one of the most important metrics to monitor.
NIMAL improved from 18% in Q1 to 21% in Q2, but credit card NIMAL declined to a negative -2.5%.
Gross margin declined to 40.90%, operating margin fell to 6.72%, and net margin decreased to 6.72%.
POS device costs increased due to rising chip prices, MELI did not increase pricing for customers, as a result, POS device margins declined significantly. Brazil credit card issuance also weighed on profitability.
Management expects deployed POS devices to generate more acquiring revenue in long term. I believe this is the right strategic decision, higher energy prices also increased logistics expenses.
MELI is investing in future growth, sacrificing near-term profitability, free shipping and investments in logistic have already produced strong operating results.
I think management’s strategy of sacrificing near-term profitability to support long term growth and strengthen MELI’s competitive advantage is correct. But, rising loans with NPL >90 days require close attention.
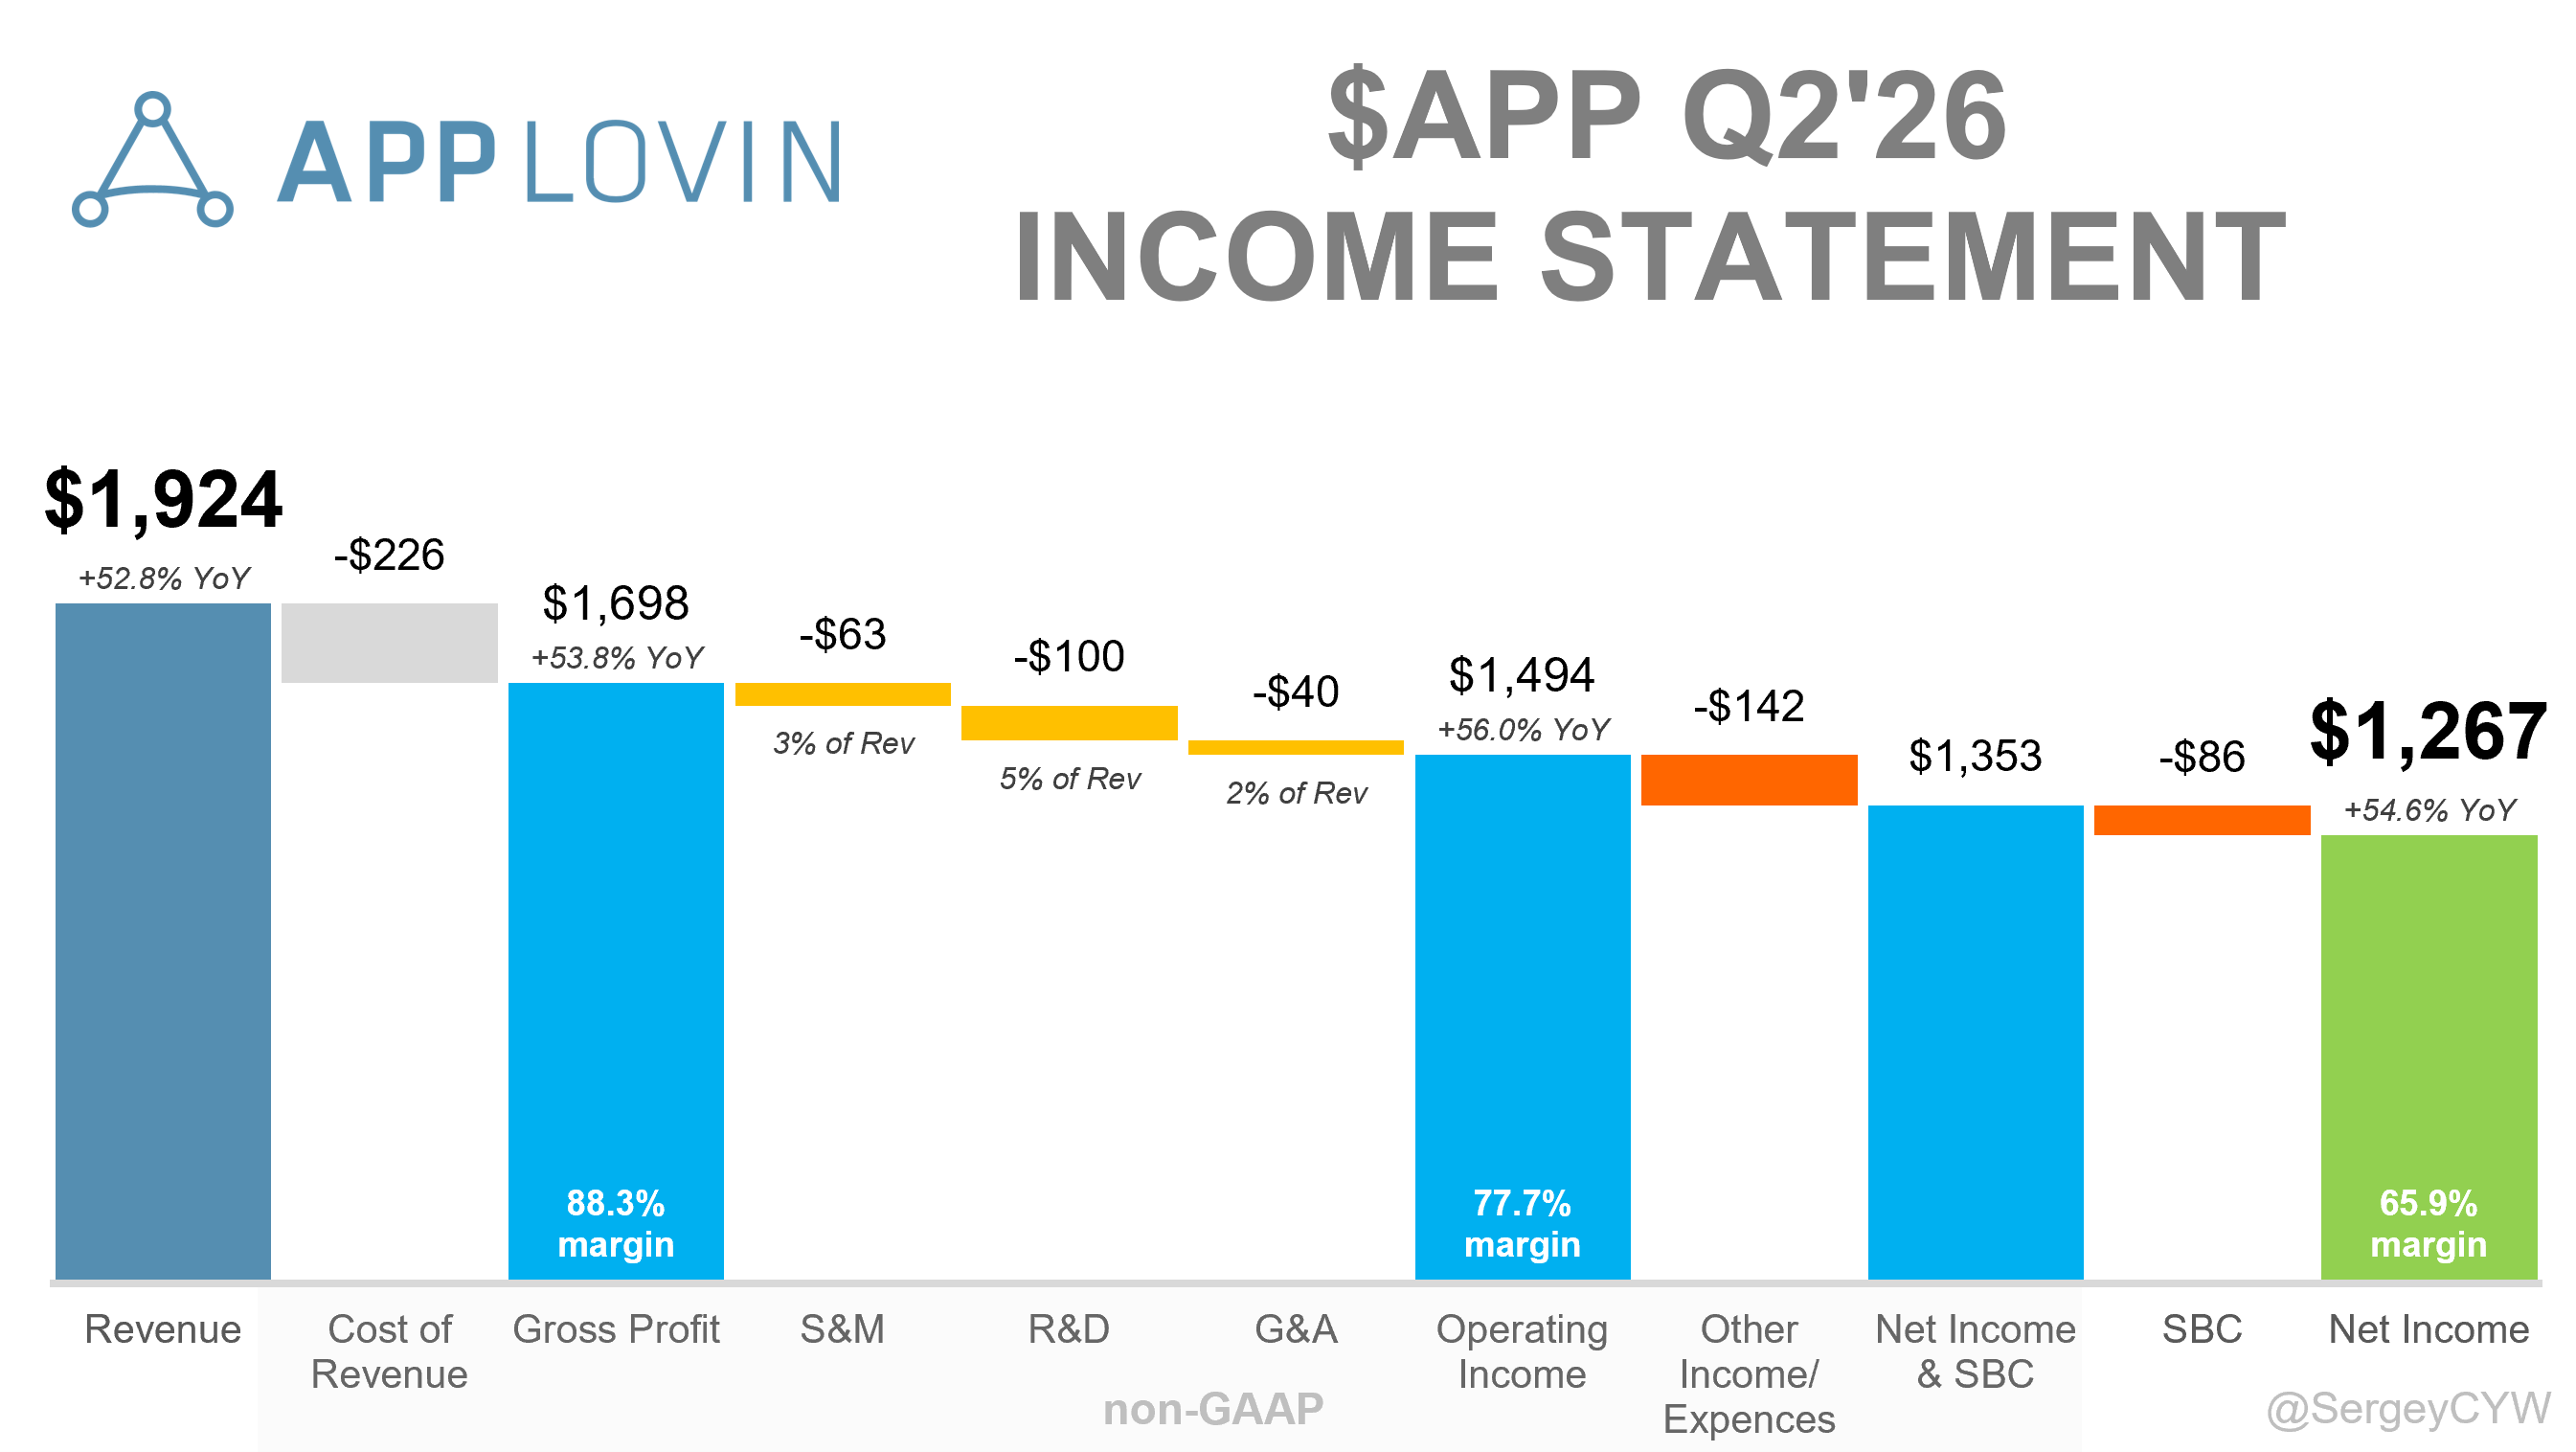
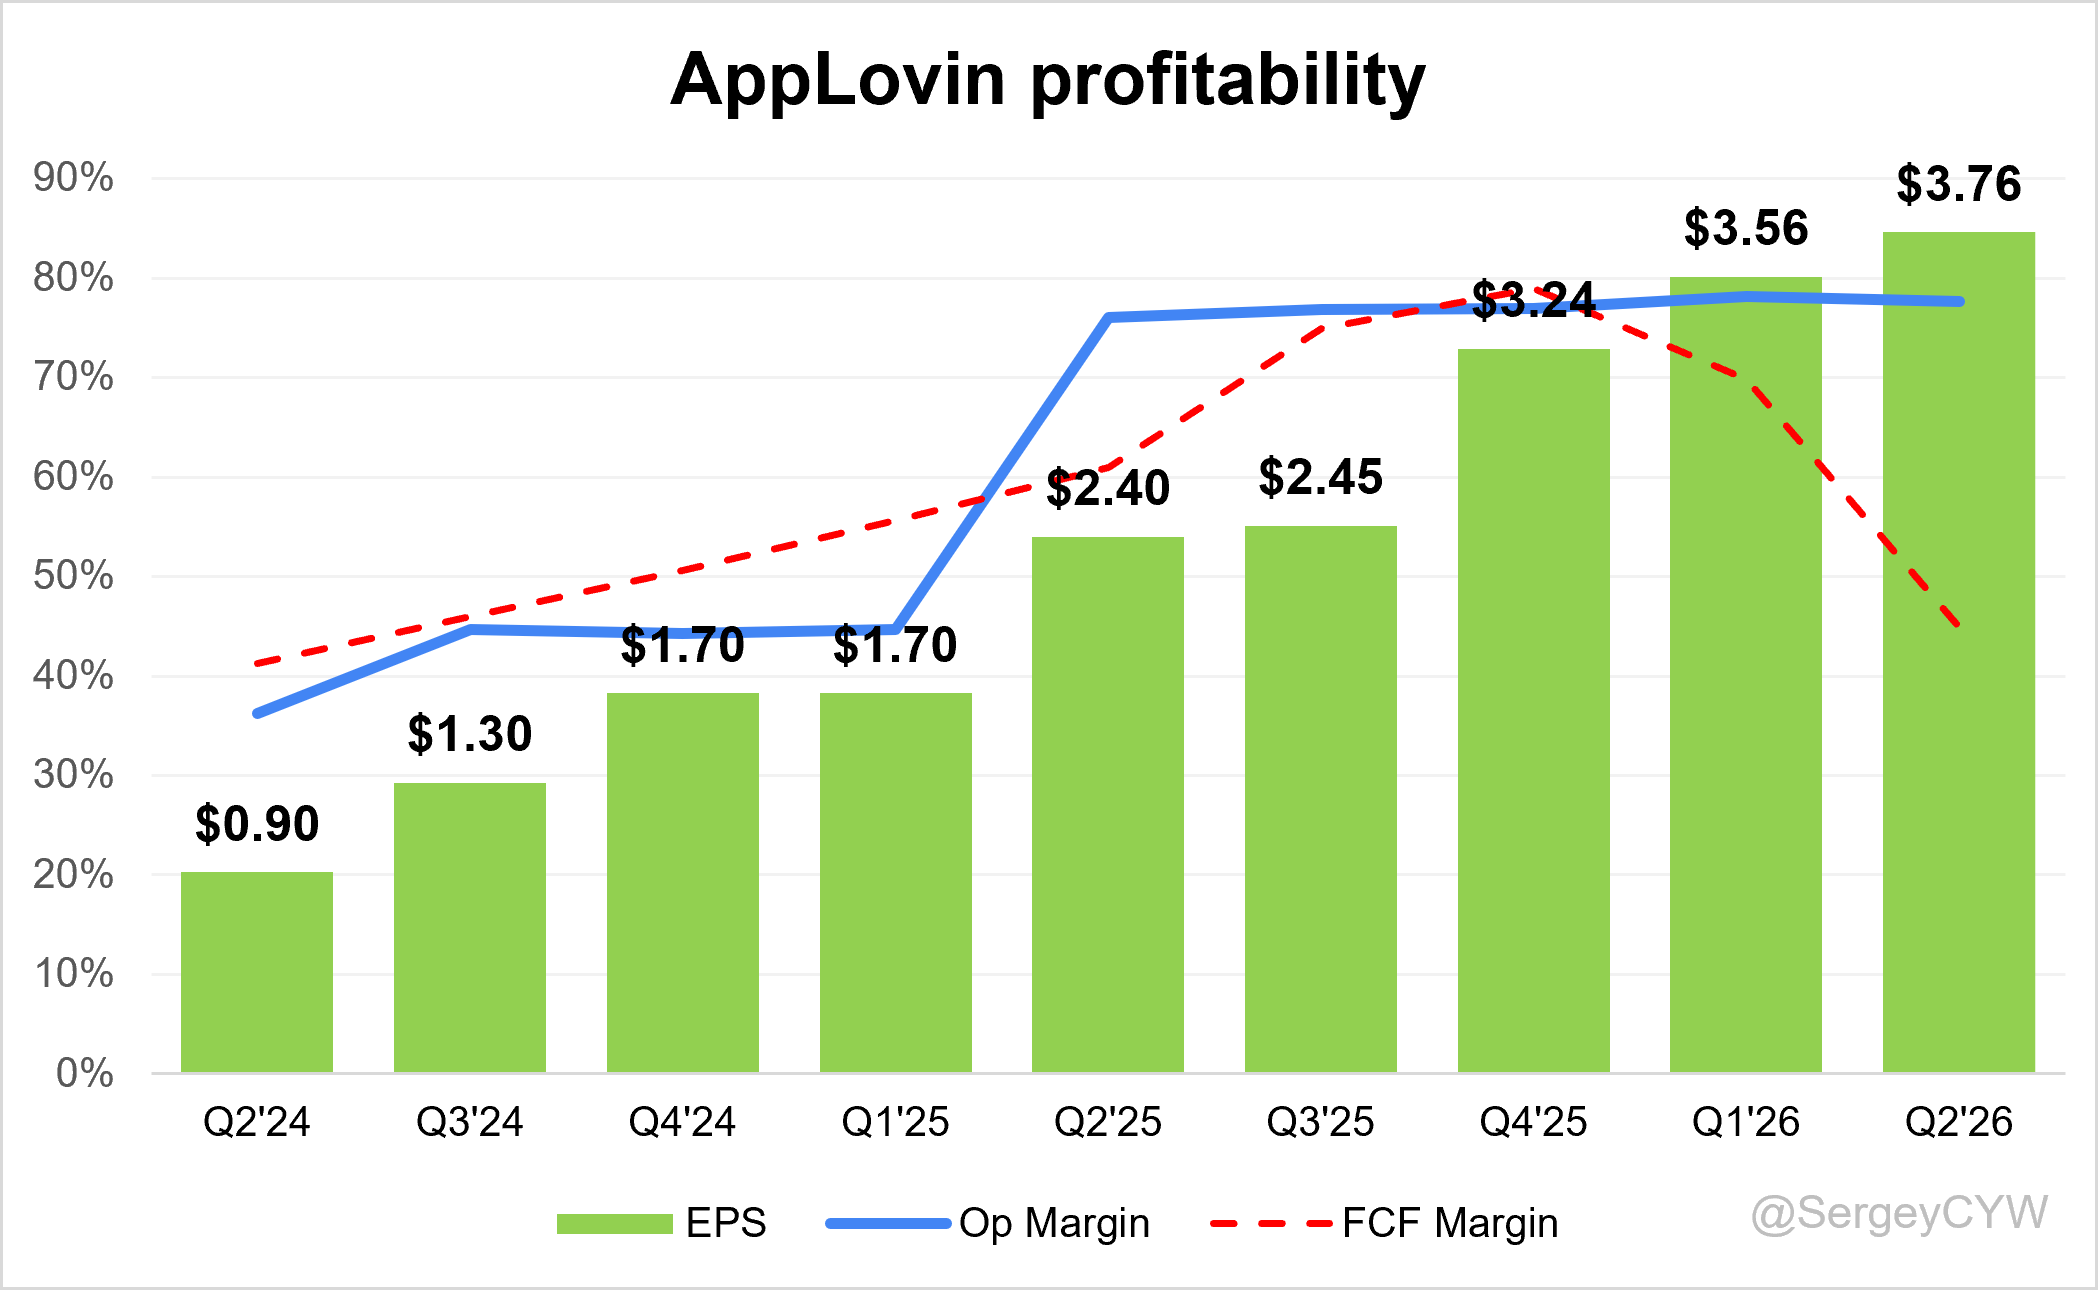
↘️$1,923.7M rev (+52.8% YoY, +4.4% QoQ) missed est by -0.9%🔴
↗️GM (88.3%, +0.6 PPs YoY)
↗️Operating Margin (77.7%, +1.6 PPs YoY)
↘️FCF Margin (44.9%, -16.1 PPs YoY)🟡
↗️Net Margin (65.9%, +0.8 PPs YoY)
↗️EPS $3.76 beat est by 0.3%🟢
Software Platform
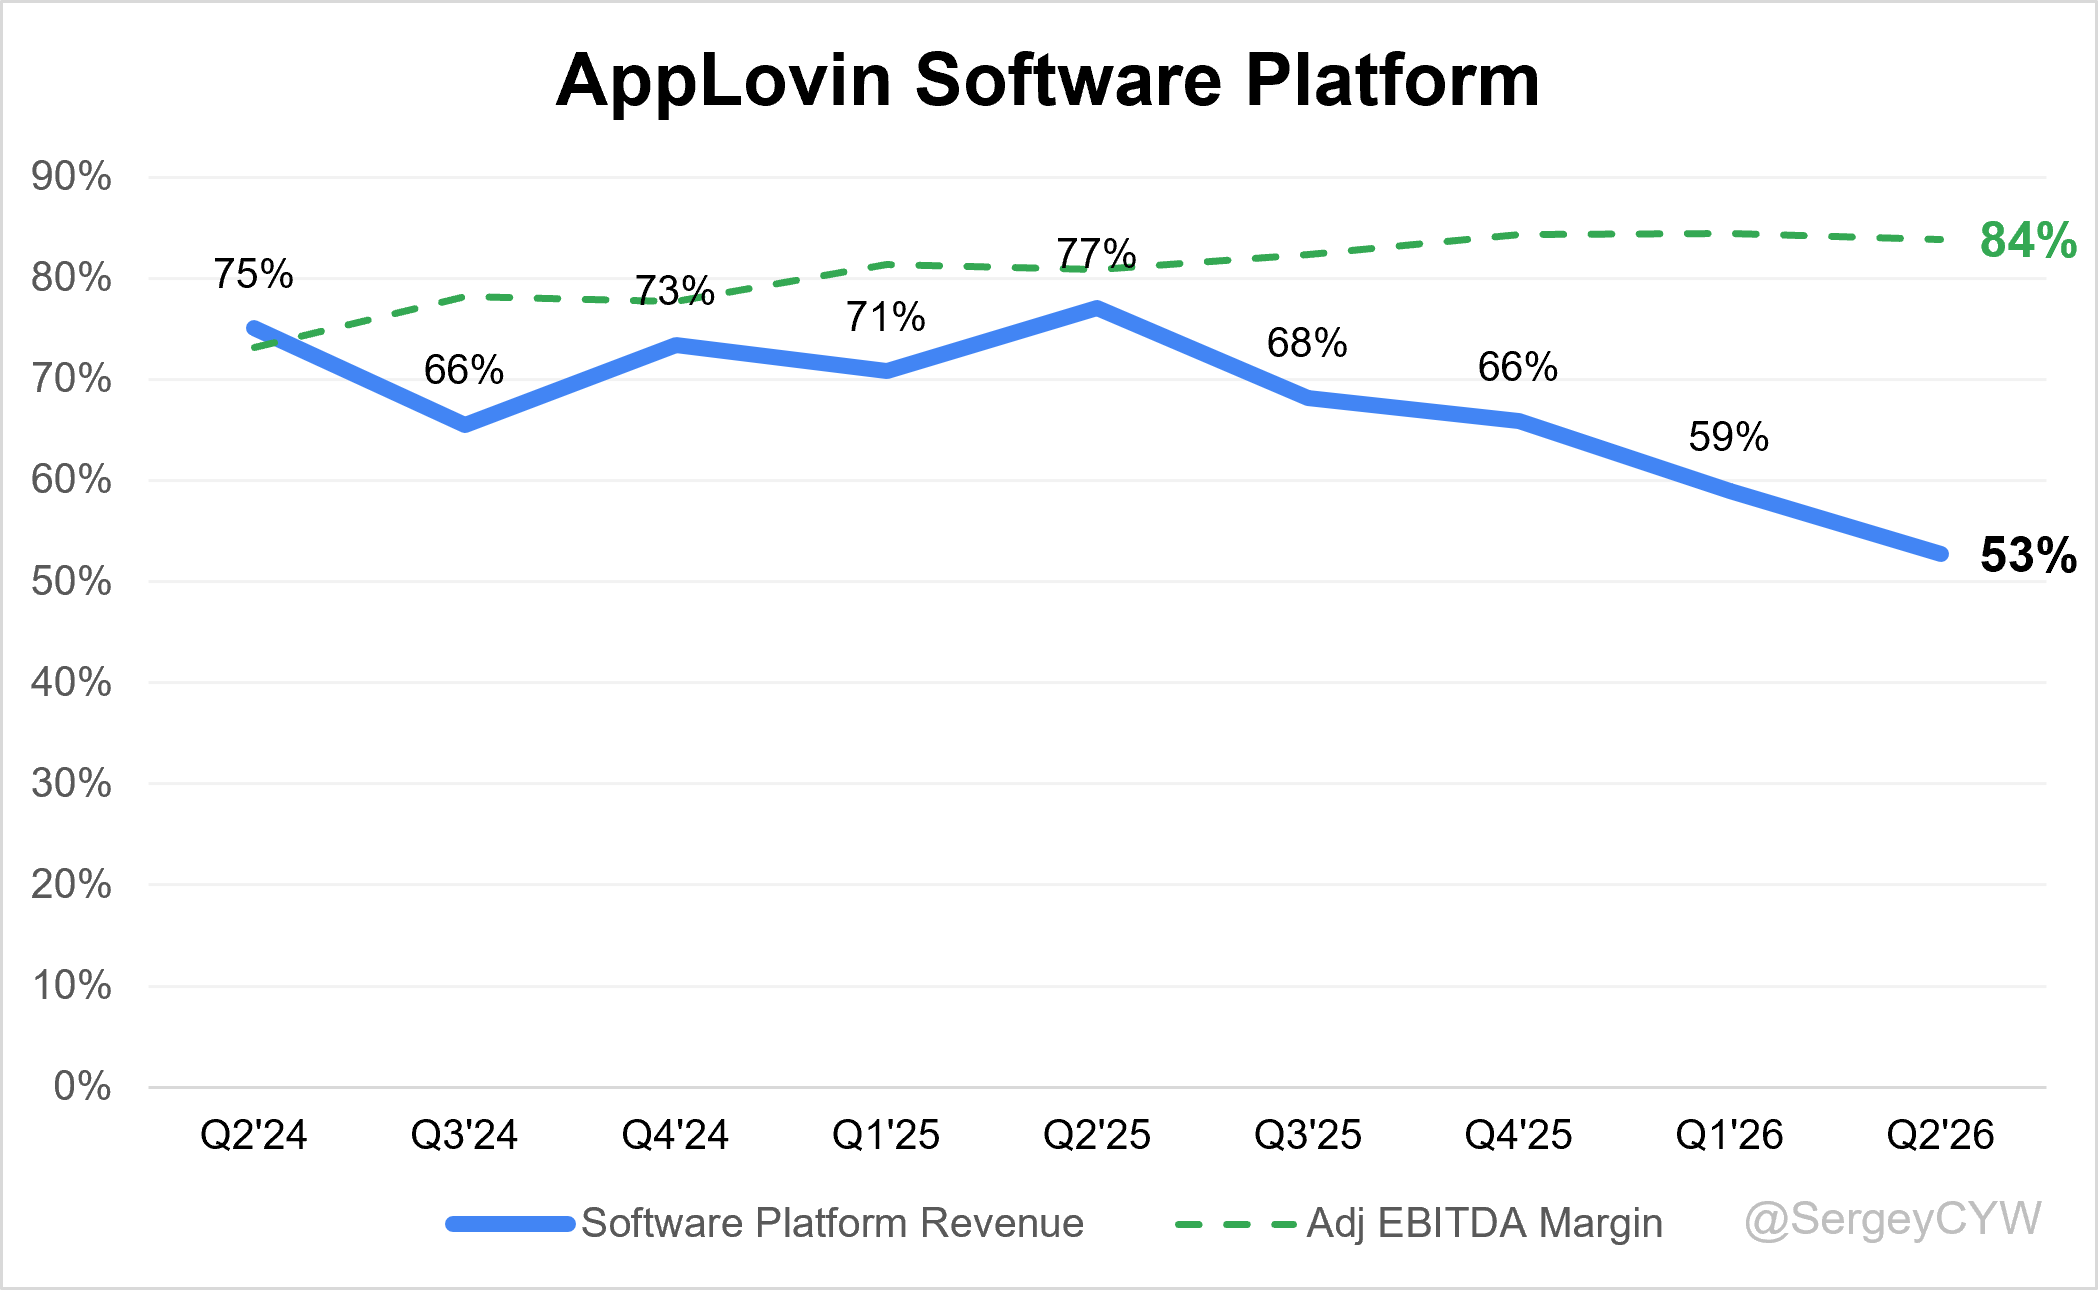
➡️$1,923.7M Software Platform rev (+52.8% YoY); 100.0% of Rev
↗️adj EBITDA Margin (83.9%, +3.0pp YoY)
Operating expenses
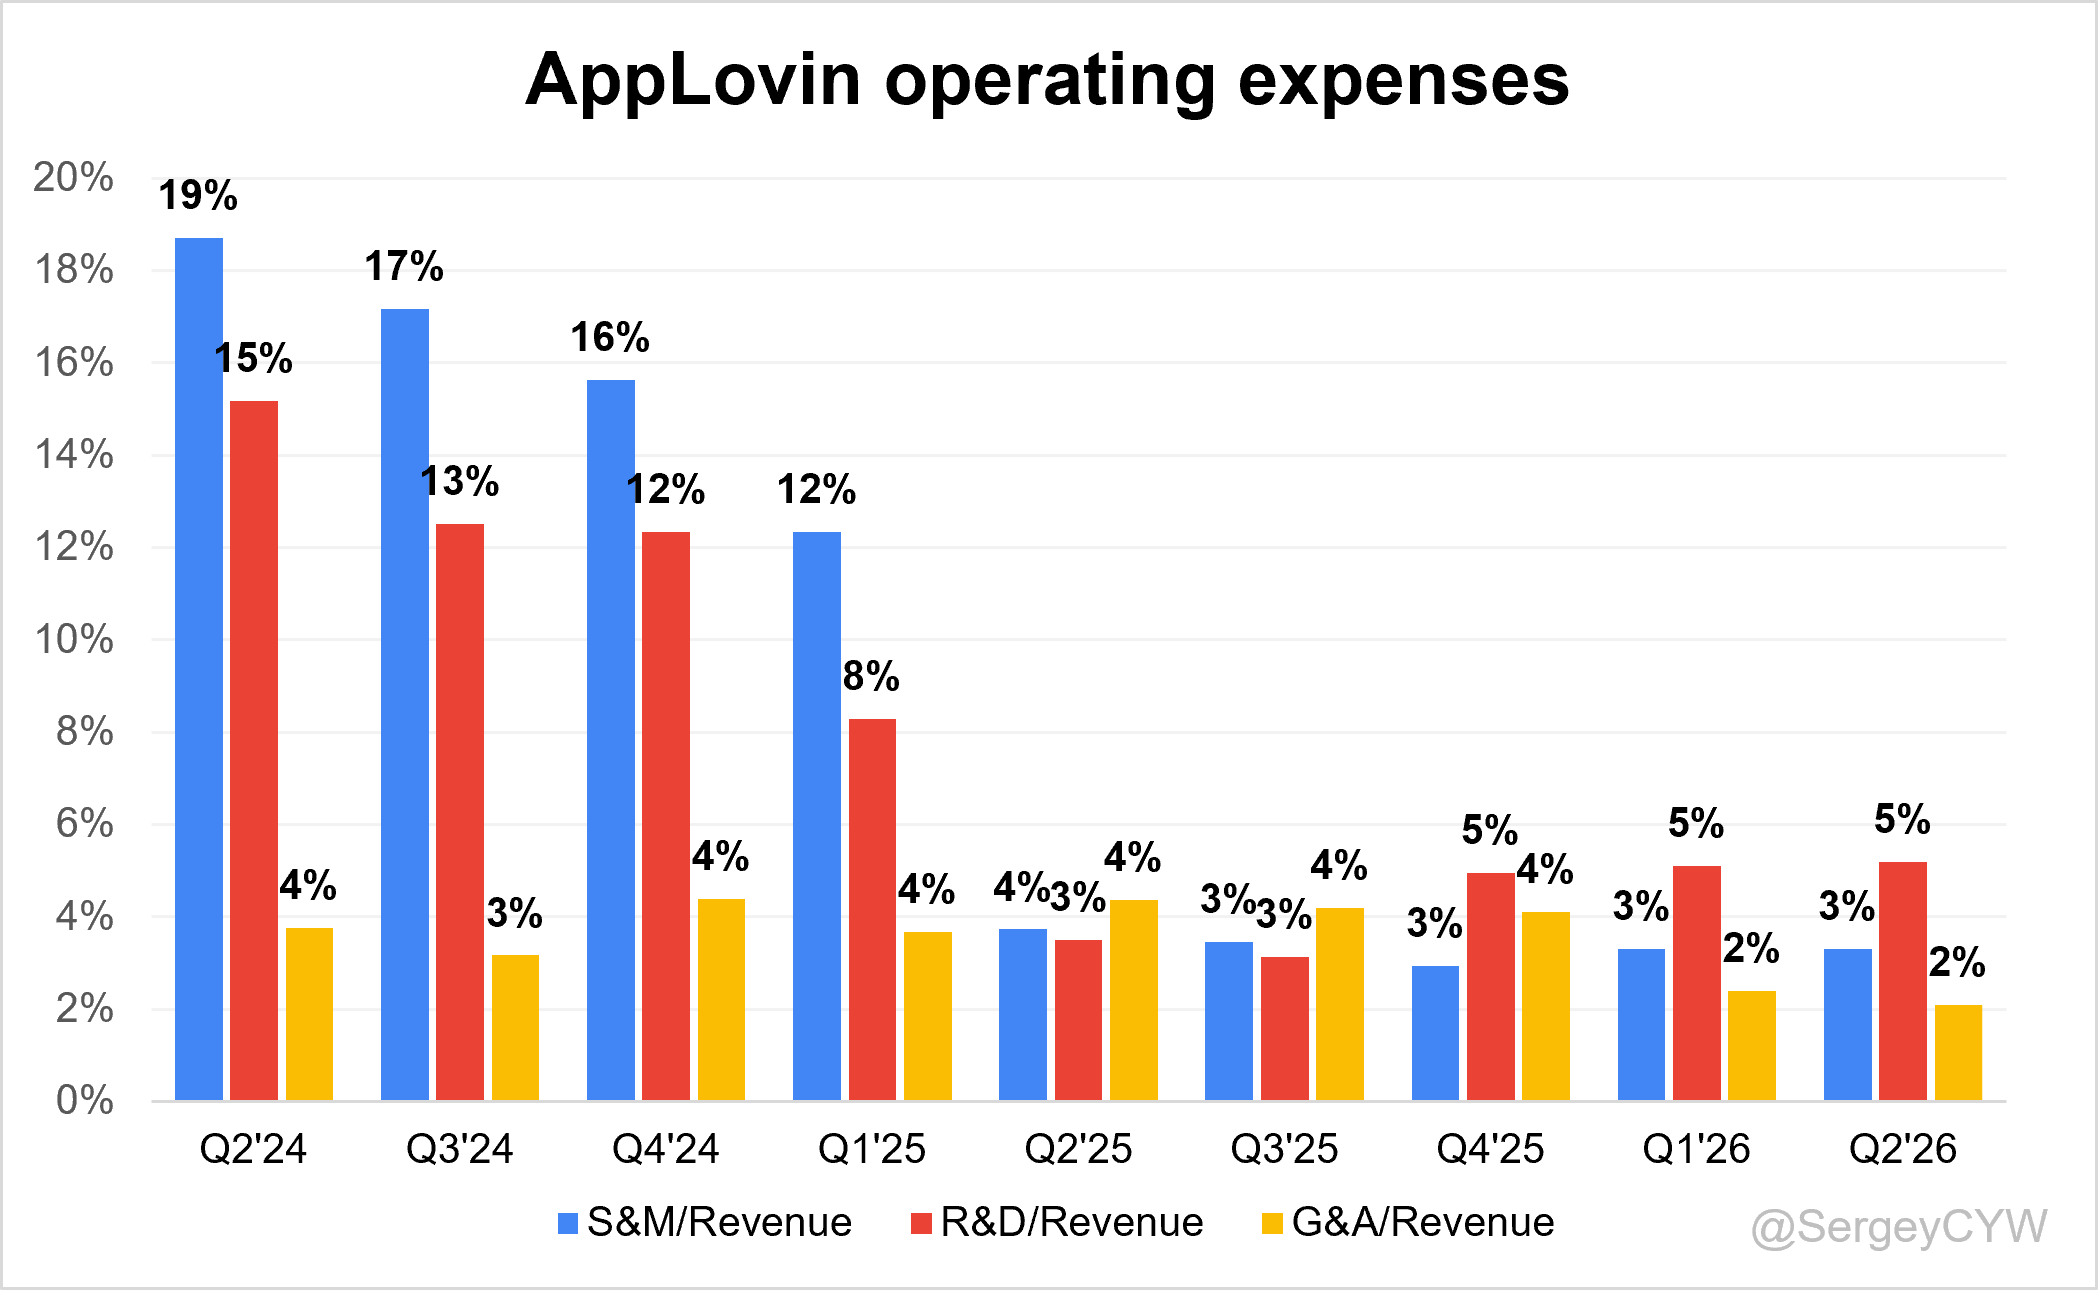
↘️S&M/Revenue 3.3% (-0.4 PPs YoY)
↗️R&D/Revenue 5.2% (+1.7 PPs YoY)
↘️G&A/Revenue 2.1% (-2.3 PPs YoY)
Dilution
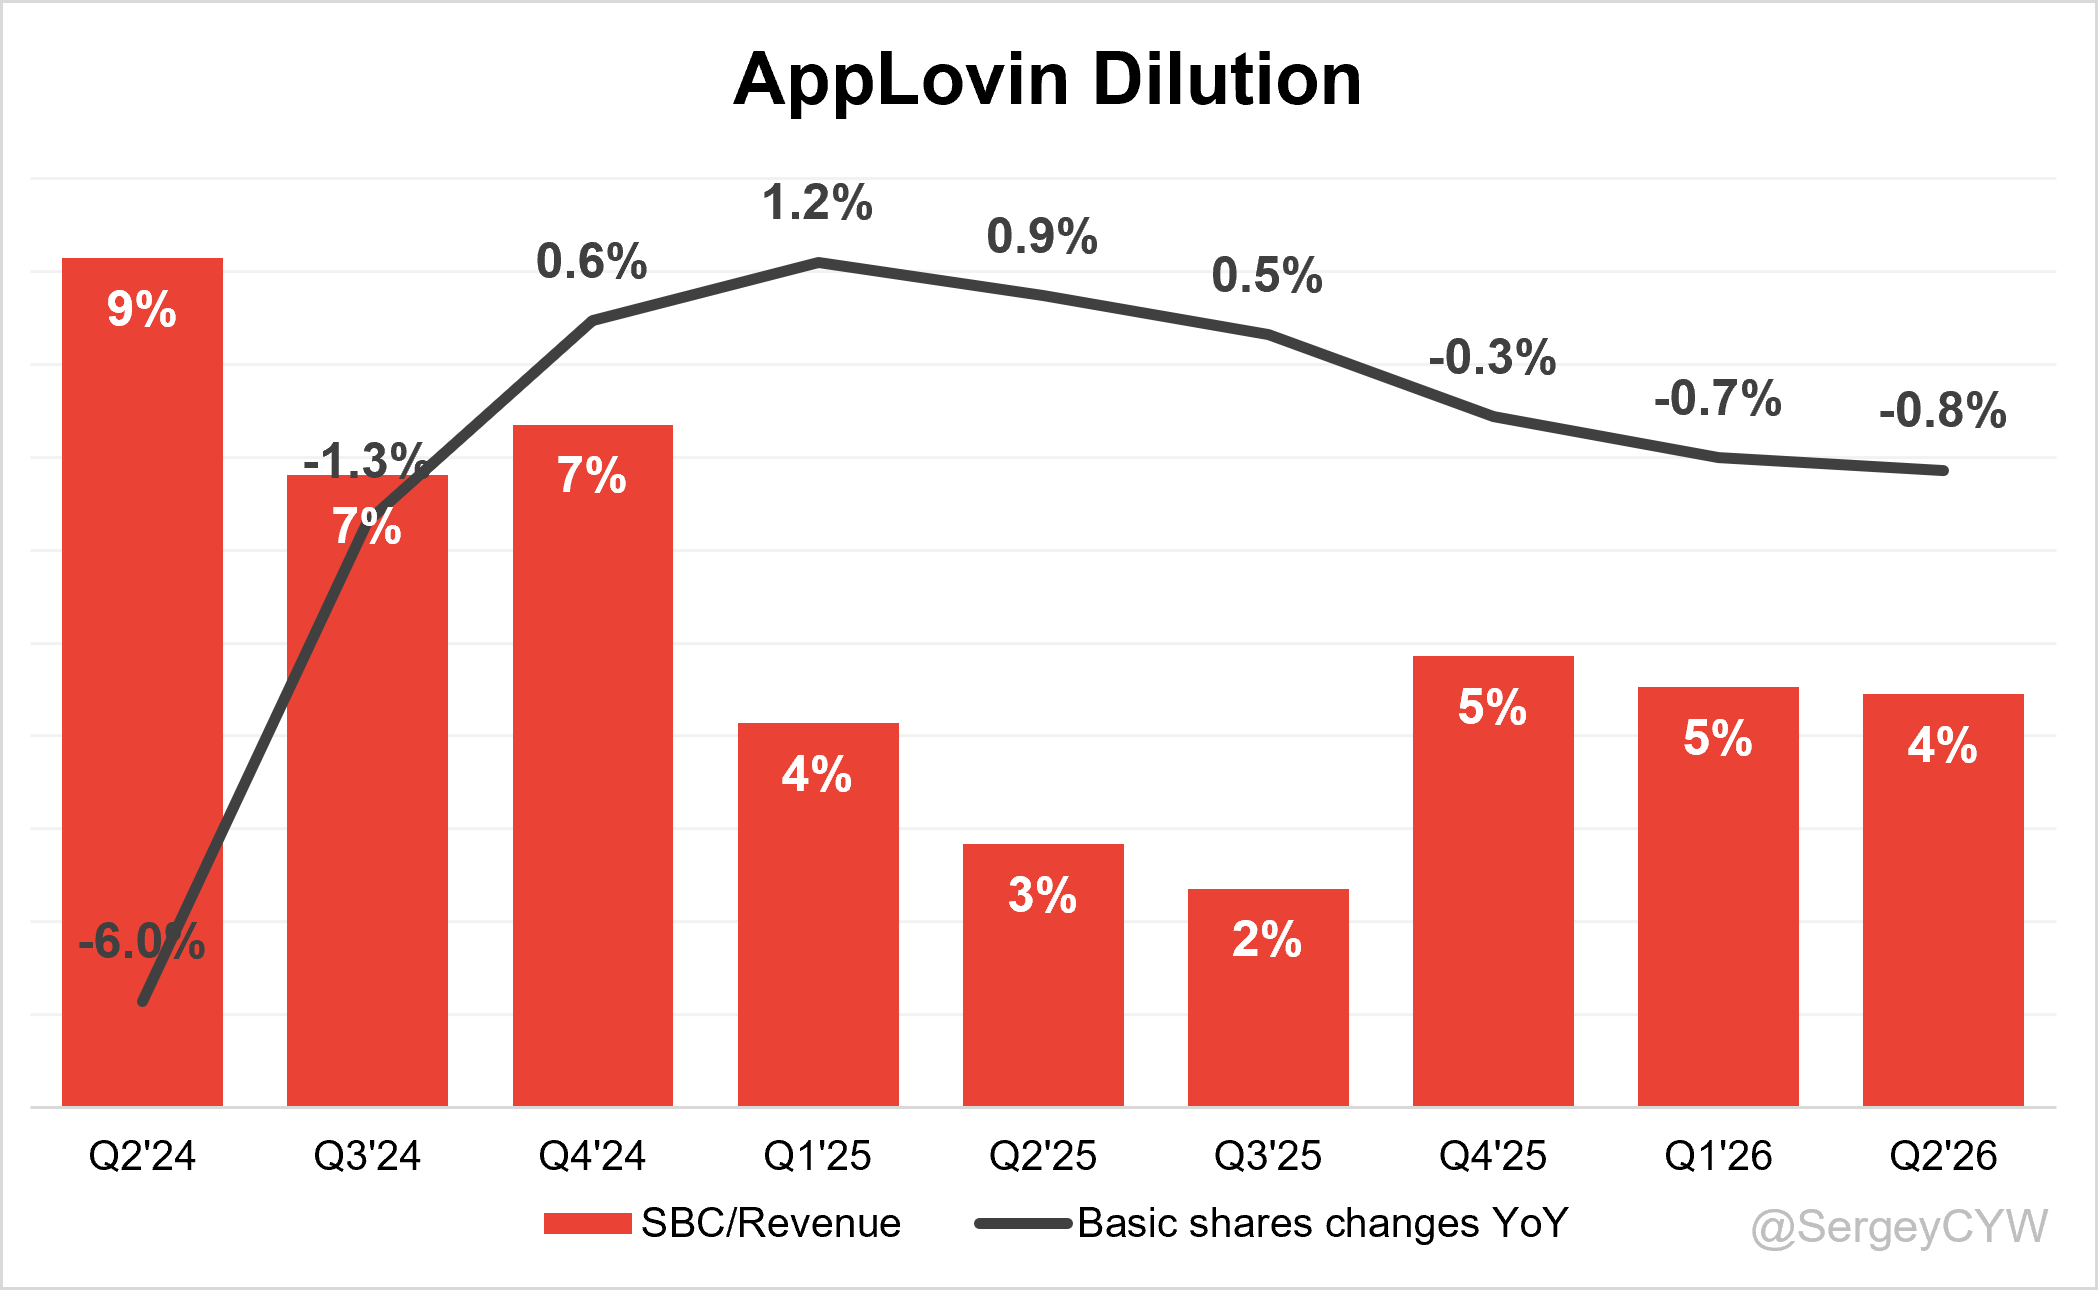
↘️SBC/rev 4%, -0.1 PPs QoQ
↘️Basic shares down -0.8% YoY, -0.1 PPs QoQ🟢
↗️Diluted shares down -1.5% YoY, +0.3 PPs QoQ🟢
Guidance
➡️Q3’26 $2,055.0 - $2,085.0M guide (+47.3% YoY) in line with est
🟢Positive
Revenue rose +52.8% YoY to $1.92 billion, gross margin expanded 60 BPs to 88.3% and operating margin rose 160 BPs to 77.7%.
Adj EBITDA margin reached 83.9%, up 300 BPts YoY, confirming strong operating leverage.
EPS $3.76 beat est by 0.3%, and diluted shares declined -1.5% YoY.
Consumer advertiser spending reached a record, finishing 28% above Q4 2025 despite weaker seasonality. Existing customers drove most growth and remain below efficient spending ceilings.
MAX publisher earnings grew at a double-digit sequential rate, waterfall share remained stable, indicating healthy publisher relationships and limited competitive pressure.
SEC concluded its inquiry with no recommended action, removing a major regulatory risk.
AppLovin repurchased or withheld 1.14M shares for $551M, with $1.8B remaining under authorization.
🟡Neutral
Q3 revenue guidance of $2.055B to $2.085B with 46% to 48% YoY growth and 7% to 8% QoQ growth, in line with estimates. Guidance includes deployed model improvements.
Q3 Adj EBITDA guidance of $1.71B to $1.74B with 48% to 50% YoY growth and 83% margin.
Gaming remains AppLovin’s largest business, but consumer advertising provides more expansion potential. Management targets +30% long-term annual growth across both categories.
Ads Manager remains focused on mid-market brands. SMB adoption depends on better creative automation.
🔴Negative
Revenue missed est by 0.9%, due to weaker than expected model uplift during Q2.
Free cash flow margin fell 16.1 percentage points YoY to 44.9%, due to tax and interest-payment timing.
Q3 guidance appears soft relative to expectations, revenue growth is expected to slow.
Model-development timing - major risk. Research gains cannot be scheduled, creating quarterly growth volatility.
Higher R&D intensity increased R&D expense to 5.2% of revenue, up 170 basis points YoY, rising compute costs can pressure quarterly margins.
Solid quarter from AppLovin. APP shares fell -27% after the earnings release and closed with -15.8% after conference call.
For me, the biggest event was the closure of the SEC inquiry with no action.
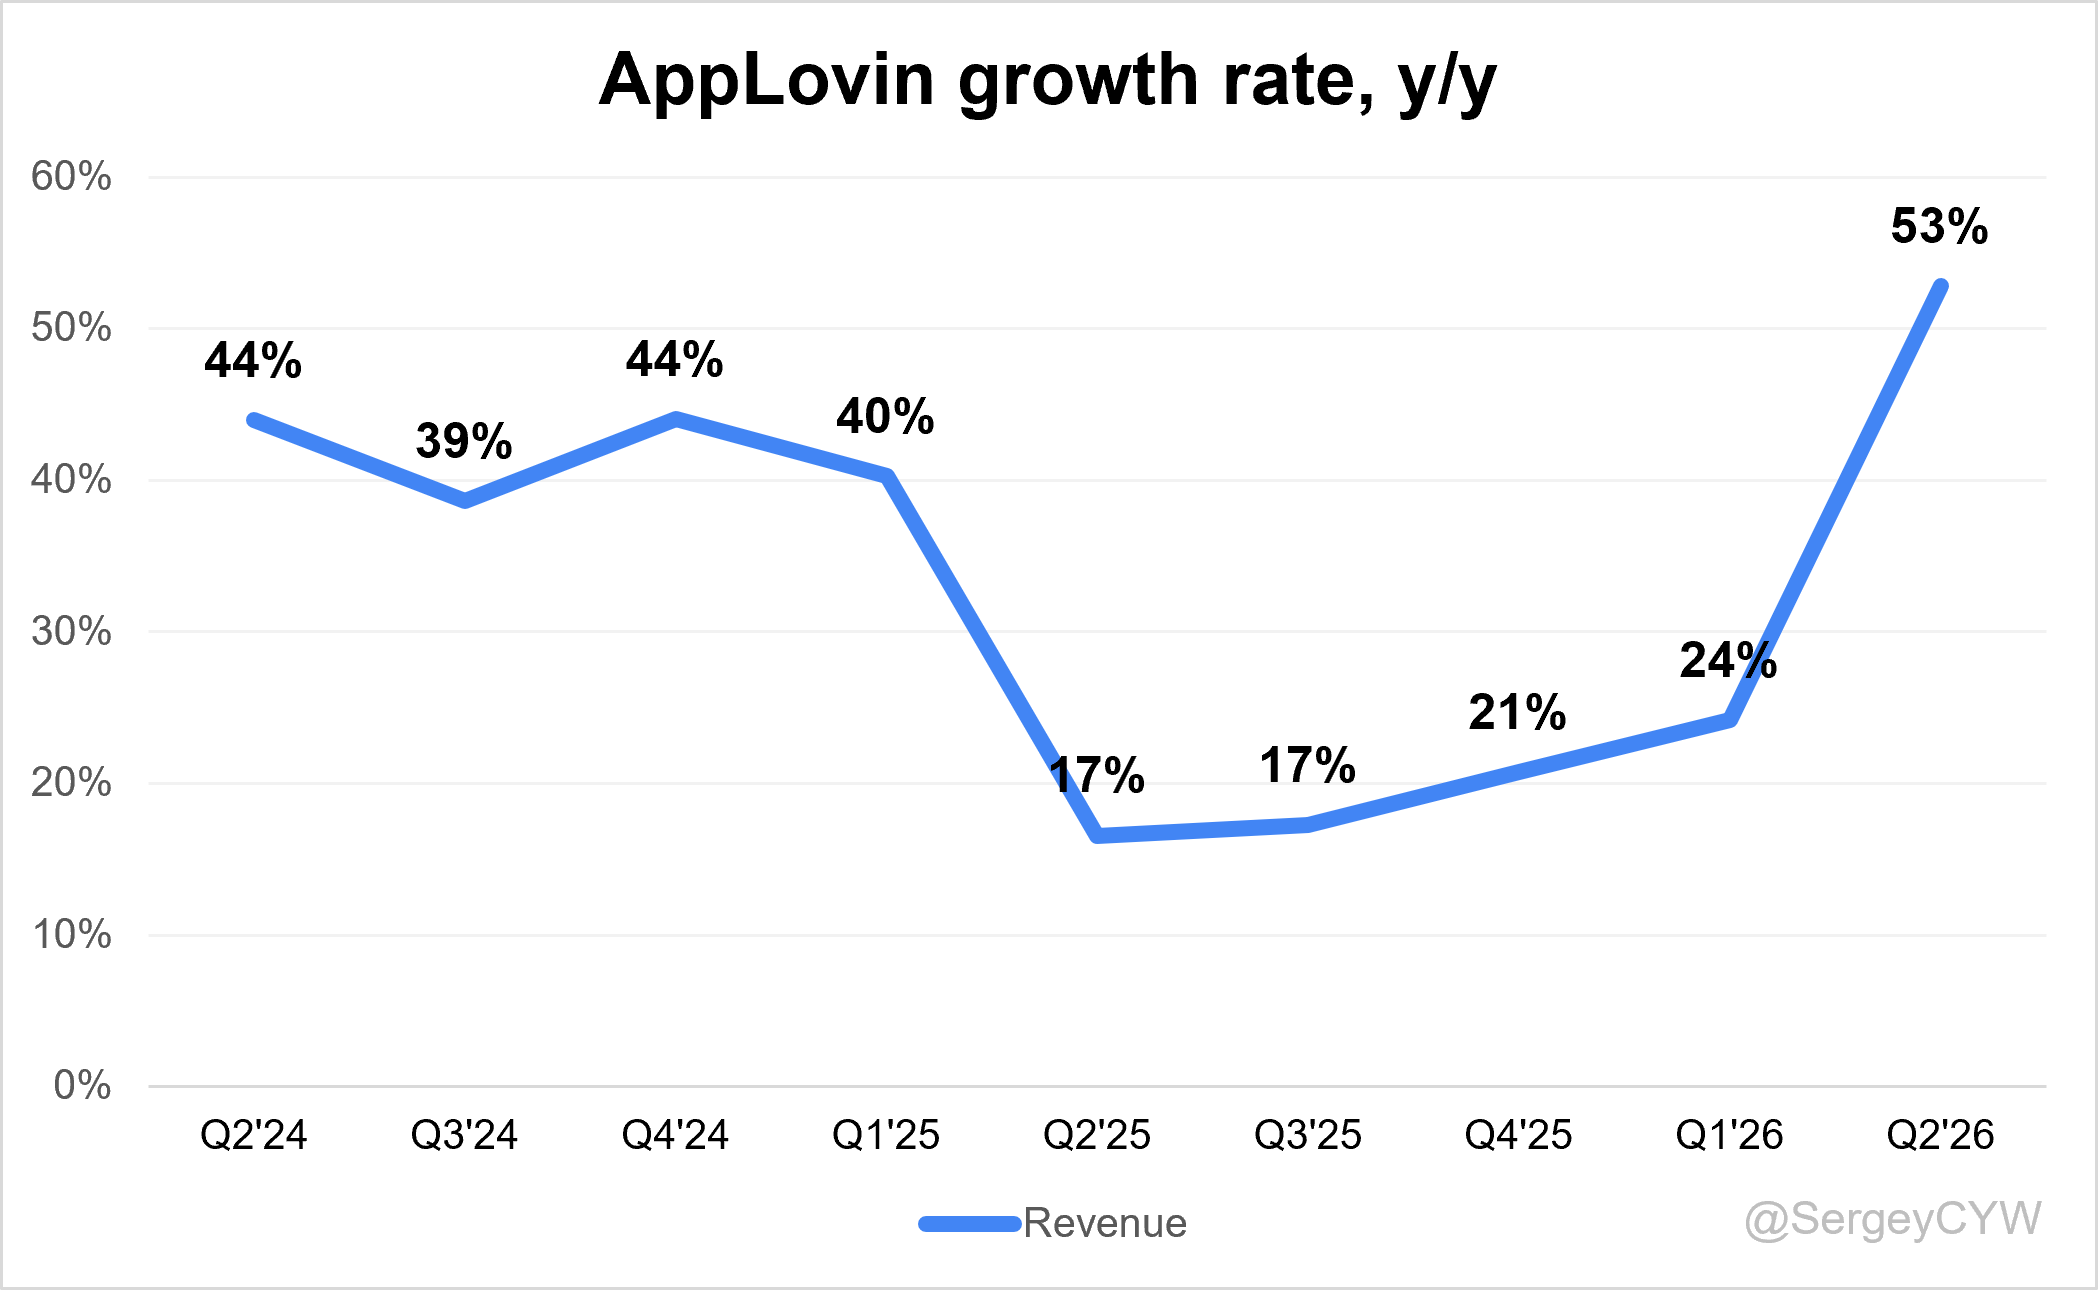
Revenue growth +52.8% YoY, down from +59% in Q1. Revenue was in line with management’s Q2 guidance. If AppLovin does not beat its Q3 outlook, growth will be around +48% YoY, represented further deceleration, but still a very high growth rate.
Q3 guidance in line with analyst estimates, which is not bad by itself. However, management noted that current model improvements are already included in guidance, so the outlook is not conservative.
Considering high revenue growth and strong profitability, shares trade at low multiples: EV/Sales 24.5x, and Forward P/E 29.0x. Market pricing reflects the risk created by weak predictability around model changes and future improvements, this uncertainty affects the stability of long-term revenue growth.
If AppLovin can sustain high revenue growth over the long term, the stock is undervalued and represents an excellent investment opportunity. If the company cannot maintain high growth, shares are probably fairly valued at current levels.
Gaming advertising remains AppLovin’s largest business, while slower Q2 growth was driven by model improvements impact.
To understand future growth dynamics, I focus on AppLovin MAX and AXON 2.0. Management highlights non-gaming apps as a priority for future growth.
During Q2, MAX publisher earnings grew at a double-digit rate QoQ, while AppLovin’s share of publisher waterfalls remained stable. AppLovin also opened its consumer platform to public access under AppLovin Ads Manager.
Next stage of growth, is Open Web, including e-commerce advertising solutions and AppLovin Exchange. An even longer-term opportunity is Connected TV, where AppLovin is integrating Wurl following its acquisition.
For me, APP remains a high-risk, high-reward position.
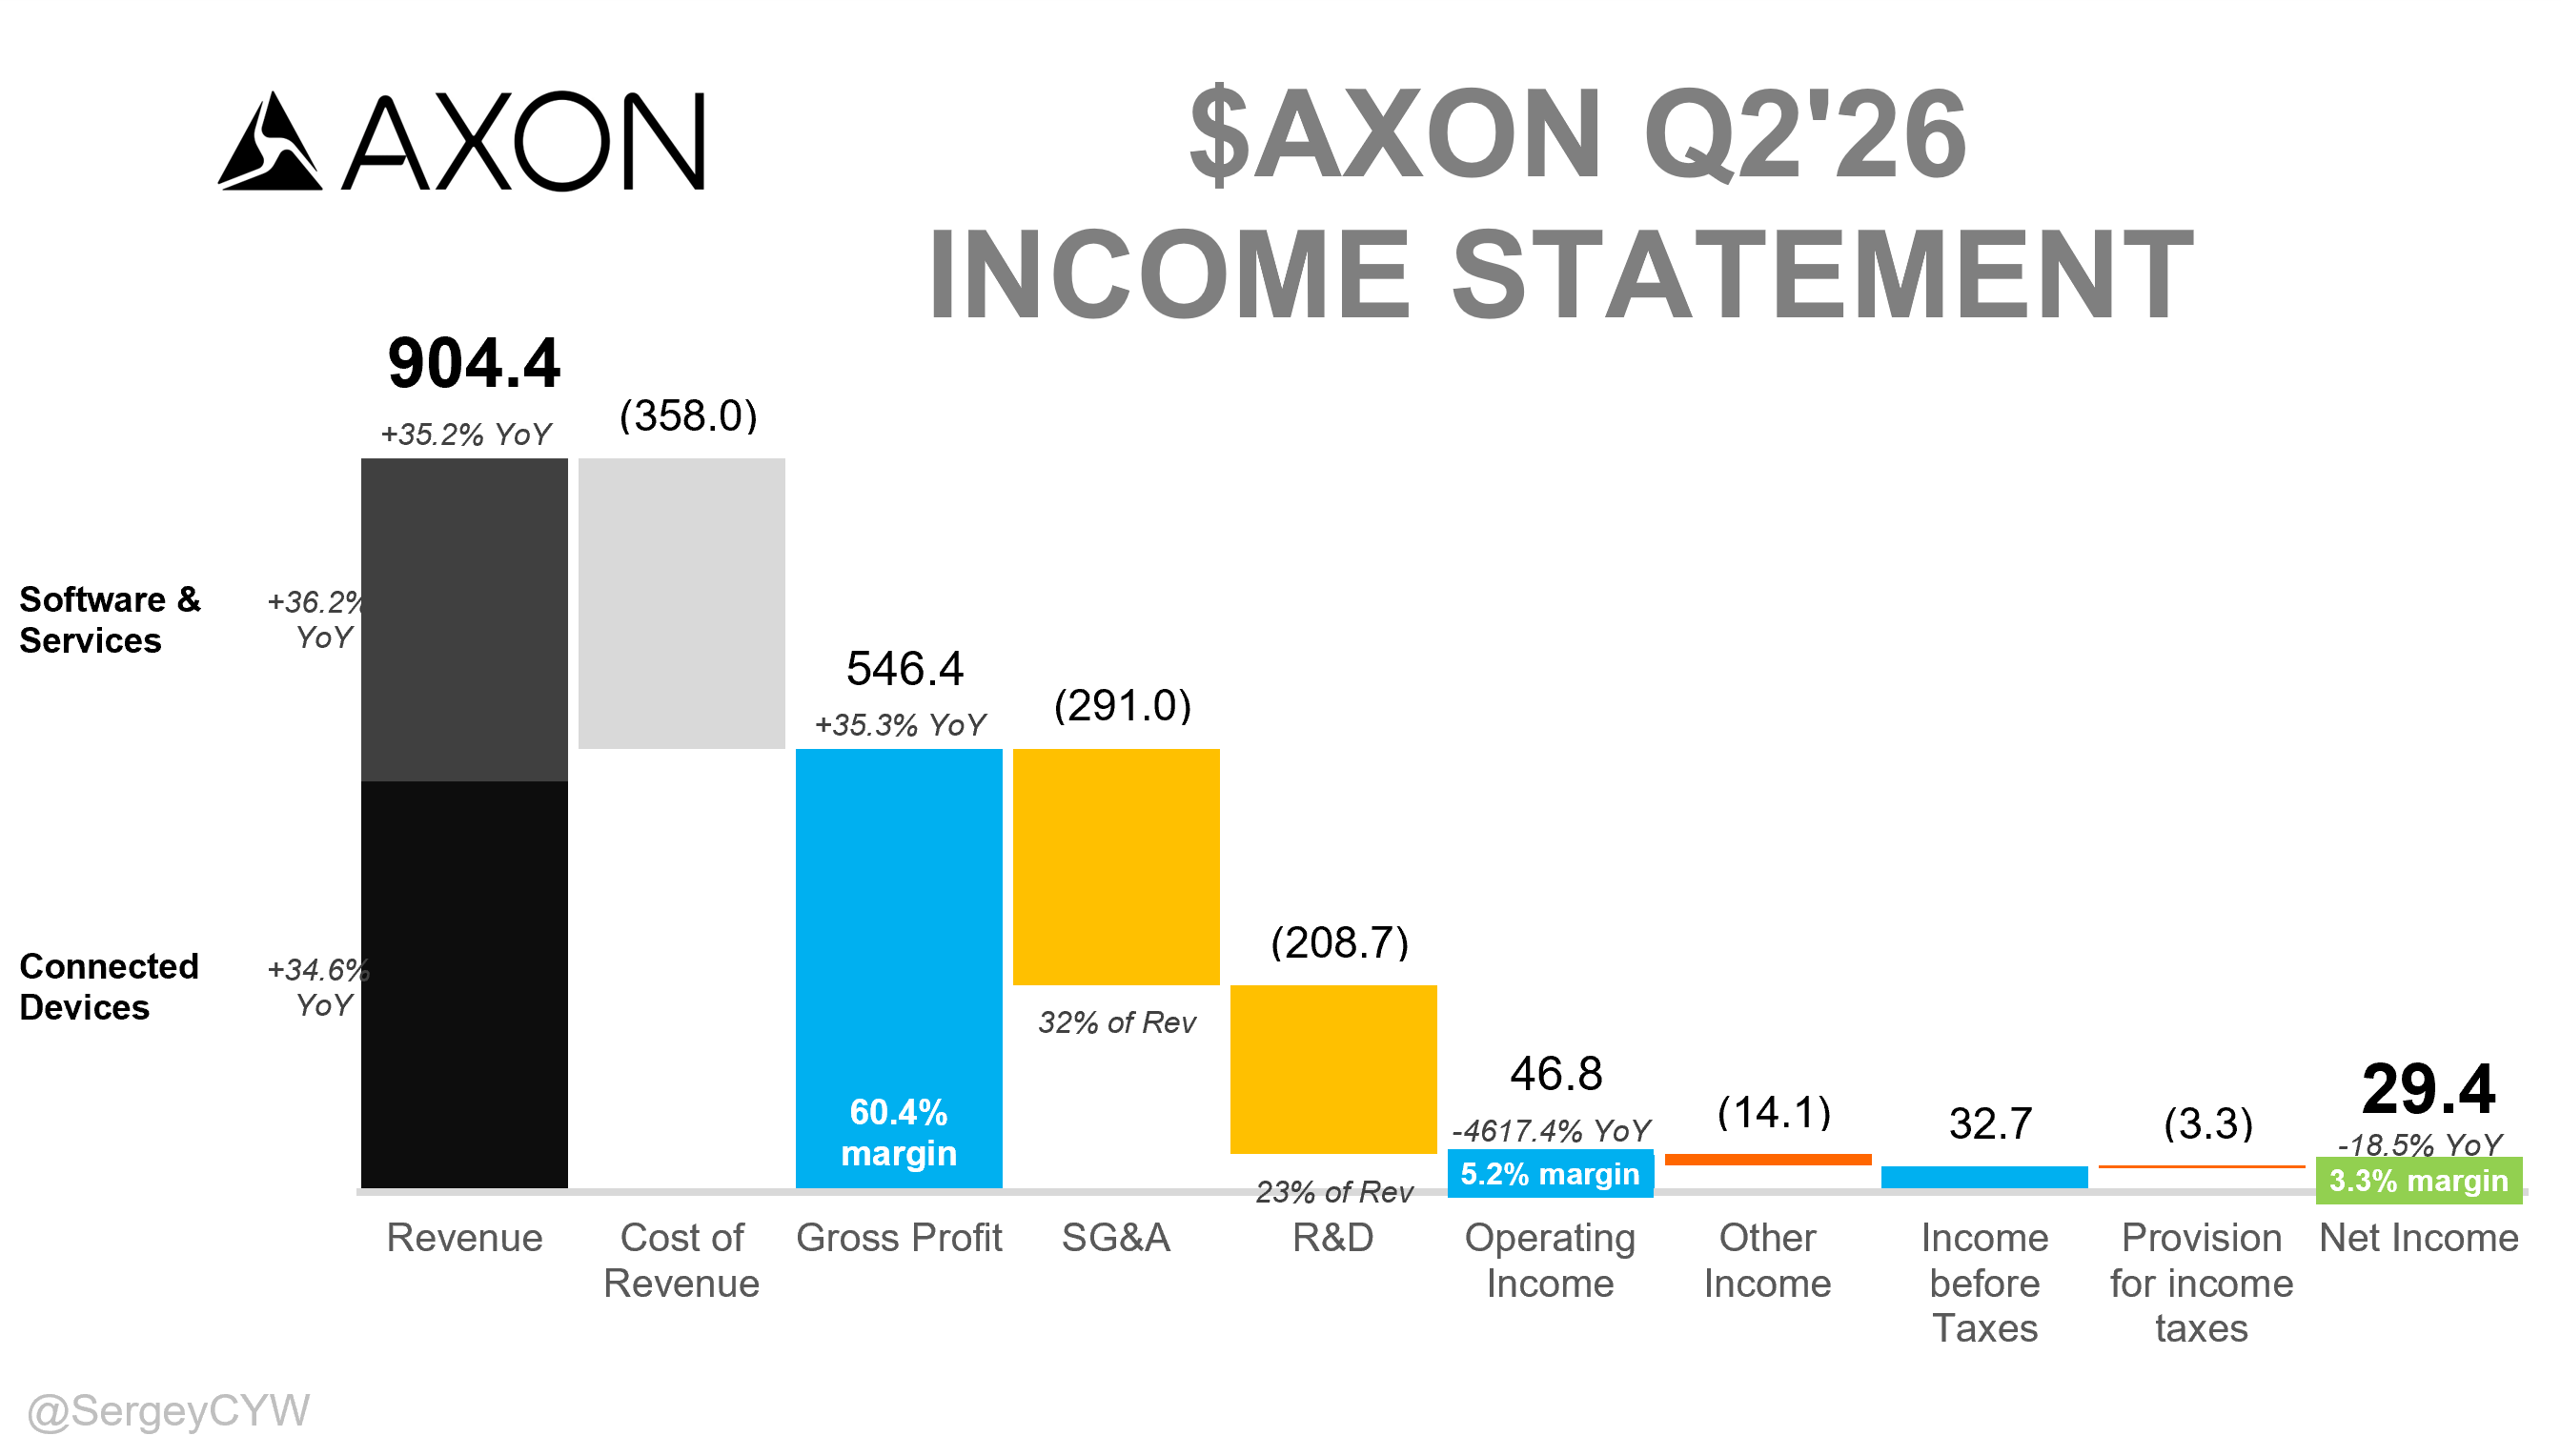
↗️$904M rev (+35.2% YoY, +12.0% QoQ) beat est by 3.2%
↗️GM (60.4%, +0.1 PPs YoY)
↘️GM* (62.9%, -0.3 PPs YoY)🟡
↗️Operating Margin (5.2%, +5.3 PPs YoY)
↗️FCF Margin (-0.1%, +17.0 PPs YoY)
↘️Net Margin (3.3%, -2.1 PPs YoY)🟡
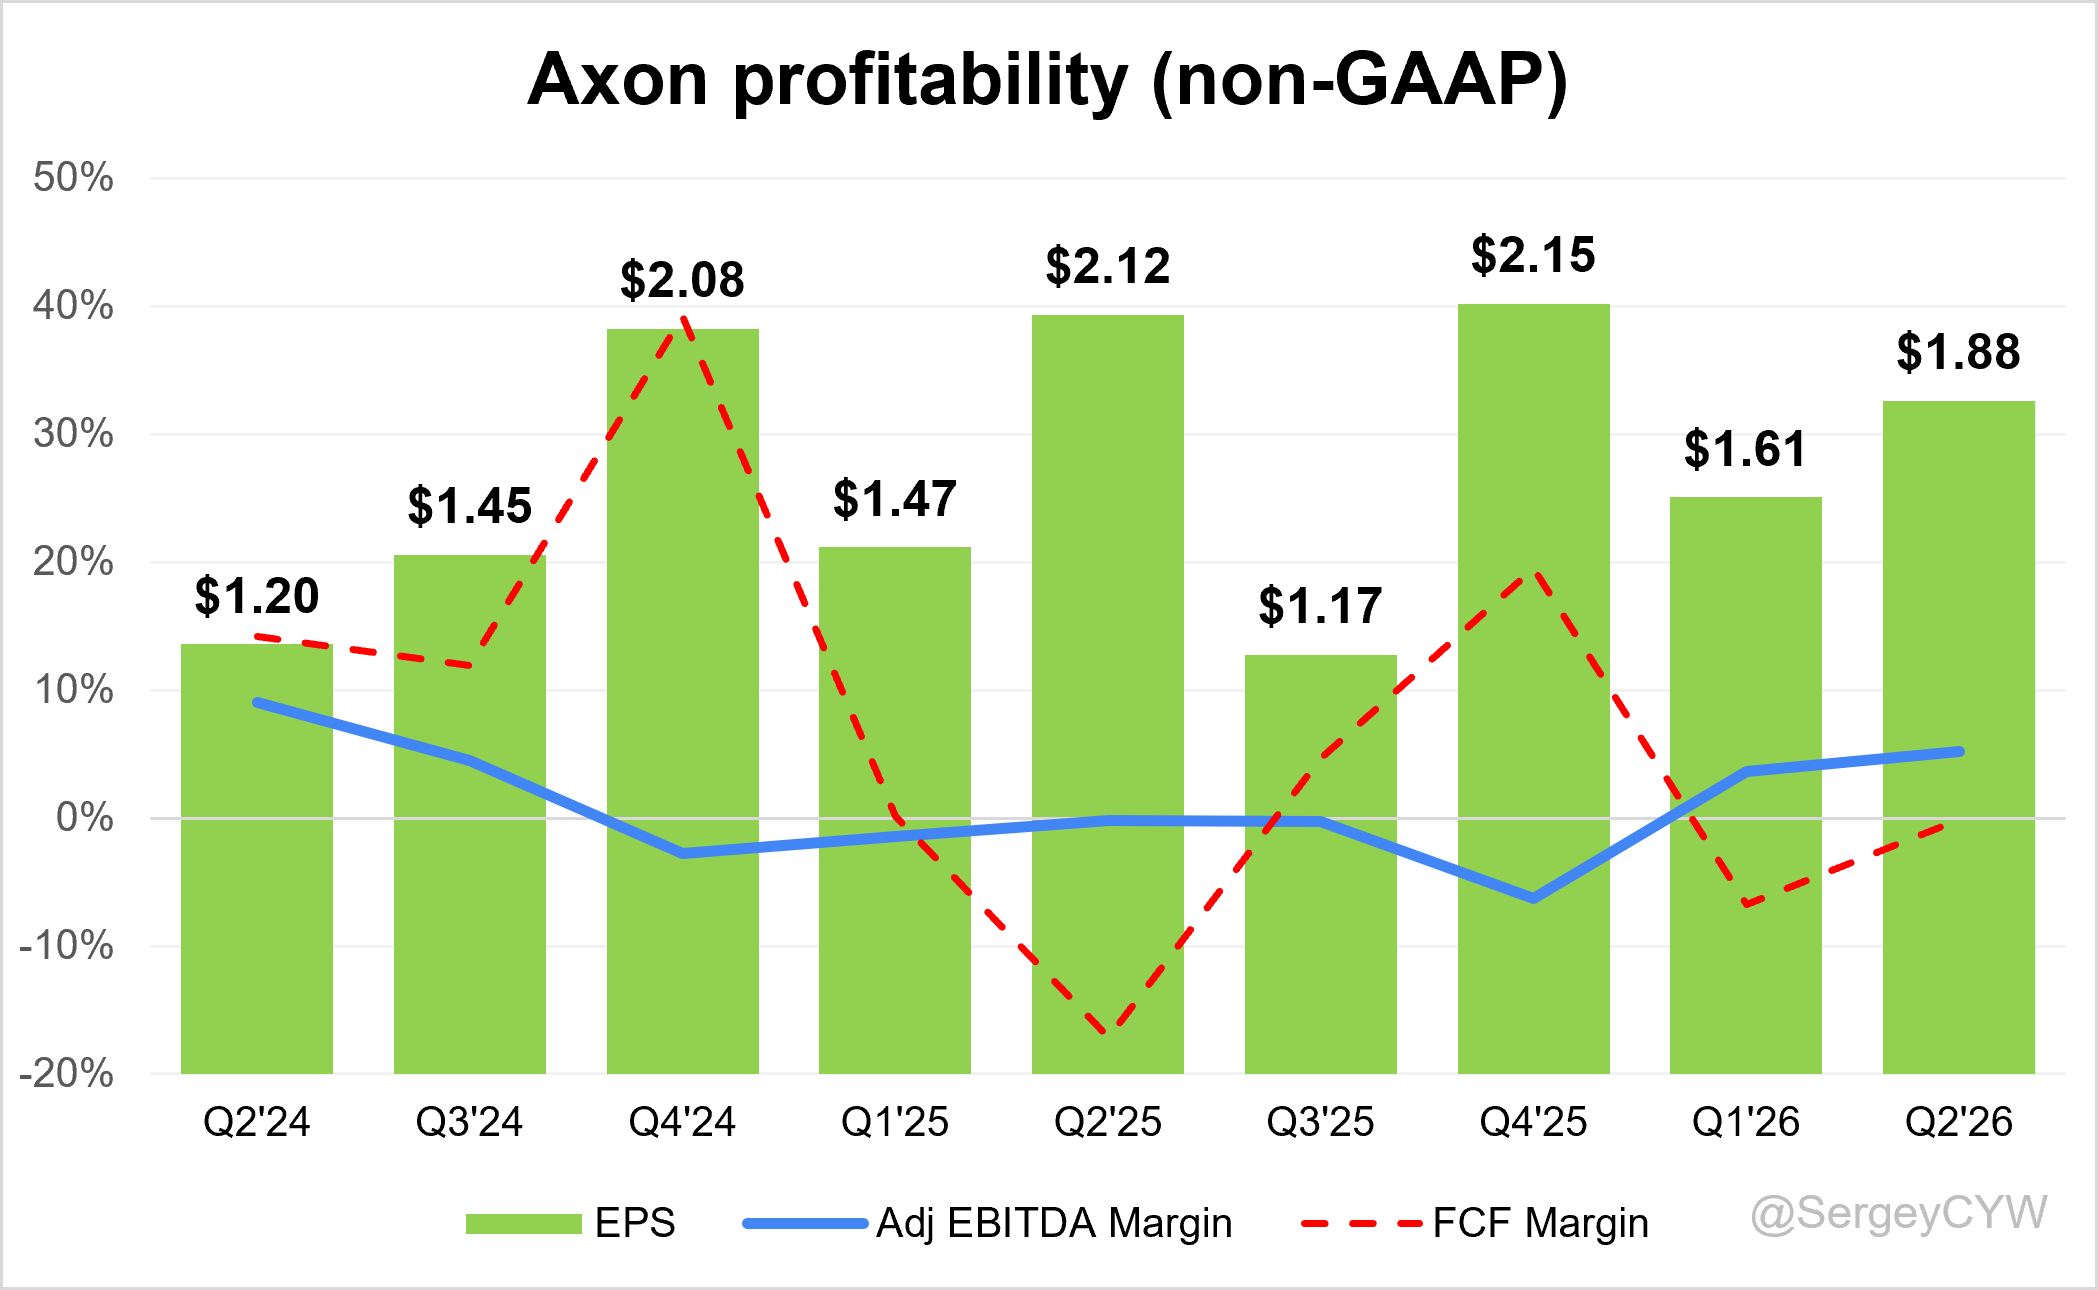
↗️EPS* $1.88 beat est by 2.2%
*non-GAAP
Revenue By Segments
Connected Devices
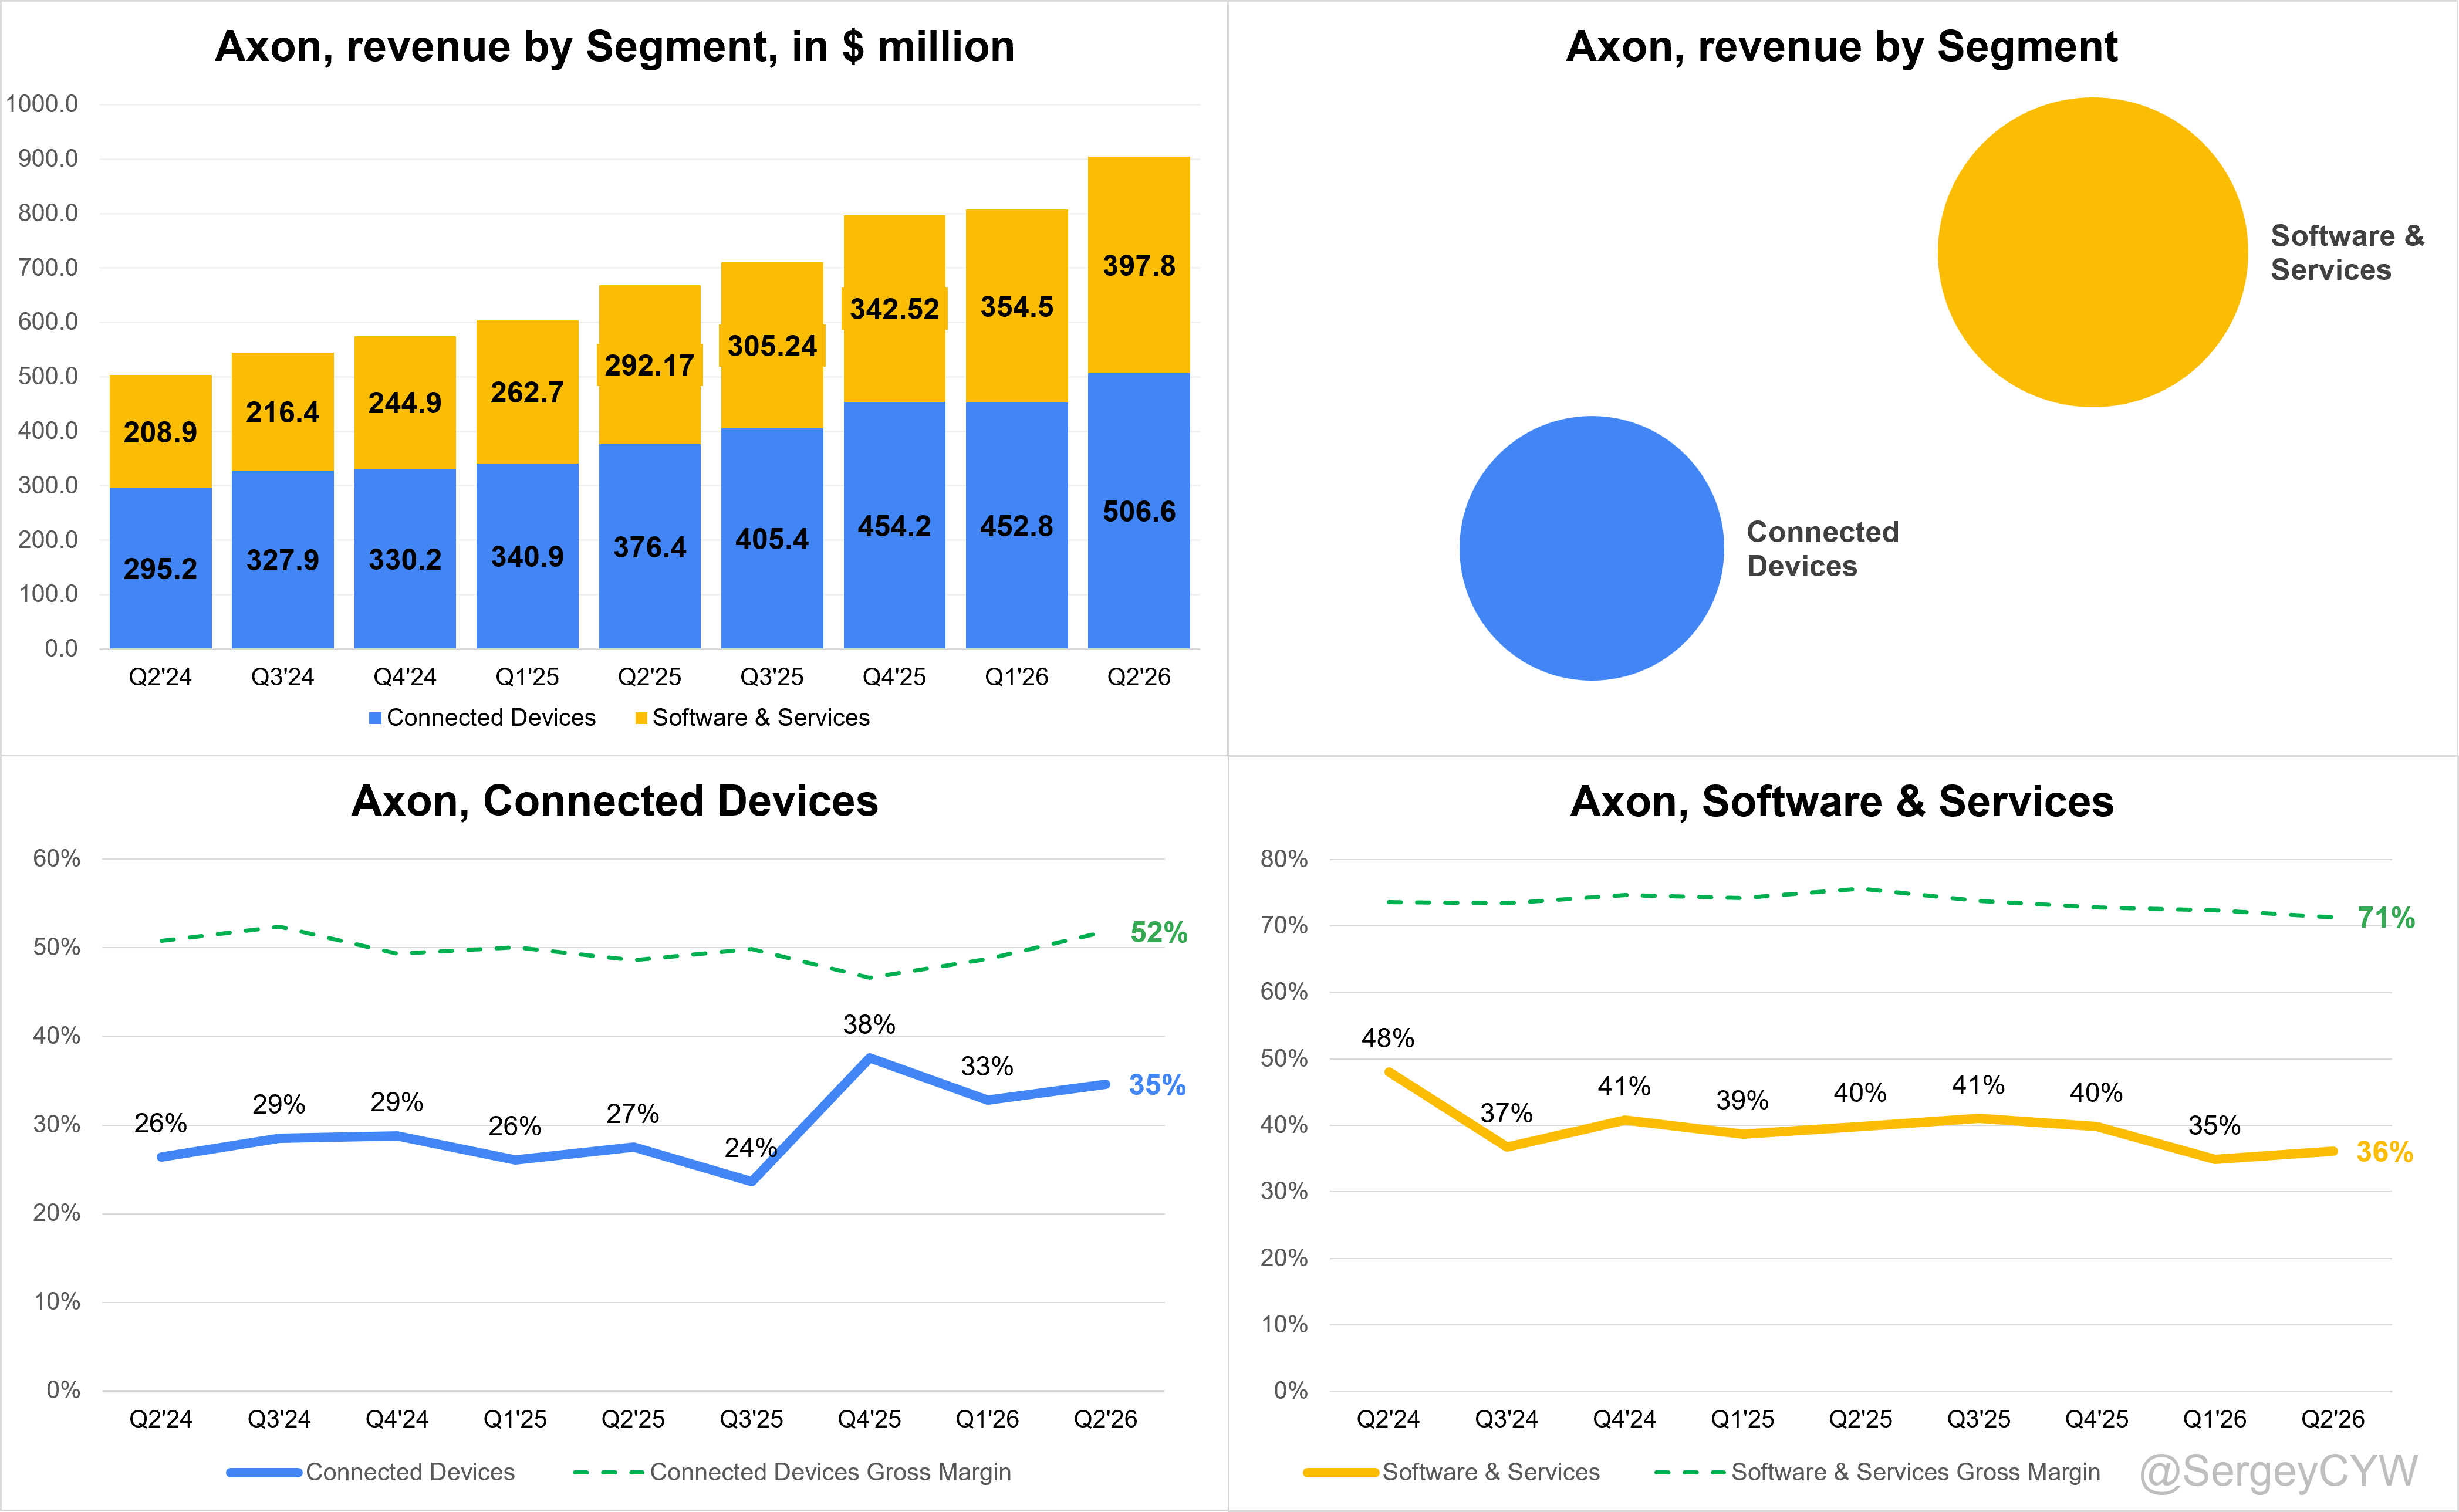
➡️$506.6M Connected Devices rev (+34.6% YoY)
↗️GM (51.9%, +3.3 PPs YoY)
Software & Services
↗️$397.8M Software & Services rev (+36.2% YoY)
↘️GM (71.3%, -4.3 PPs YoY)
Key Metrics
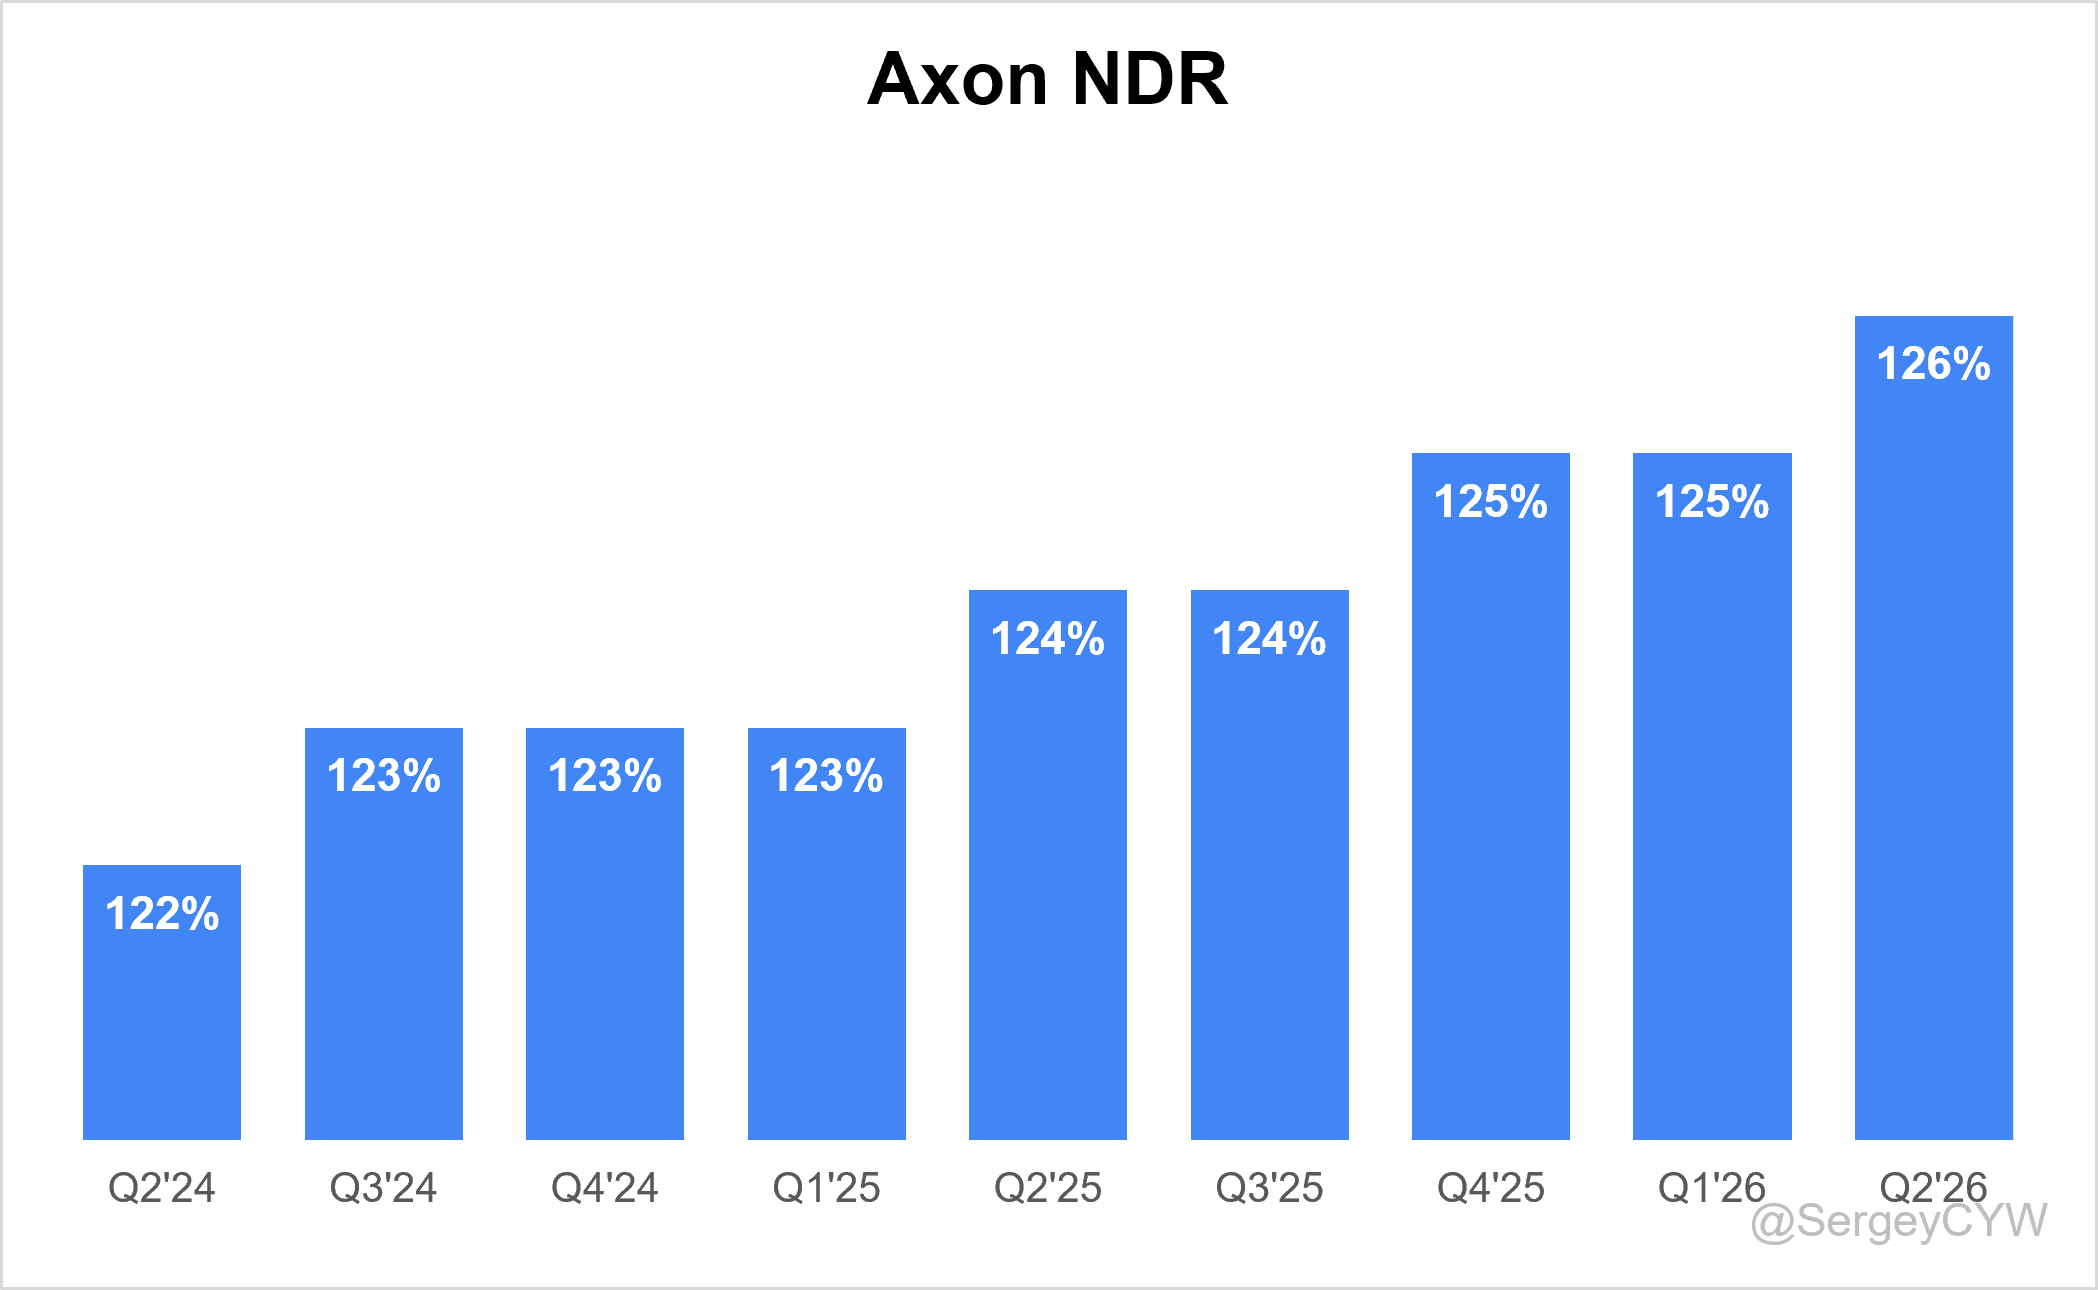
↗️NRR 126% (125% LQ)
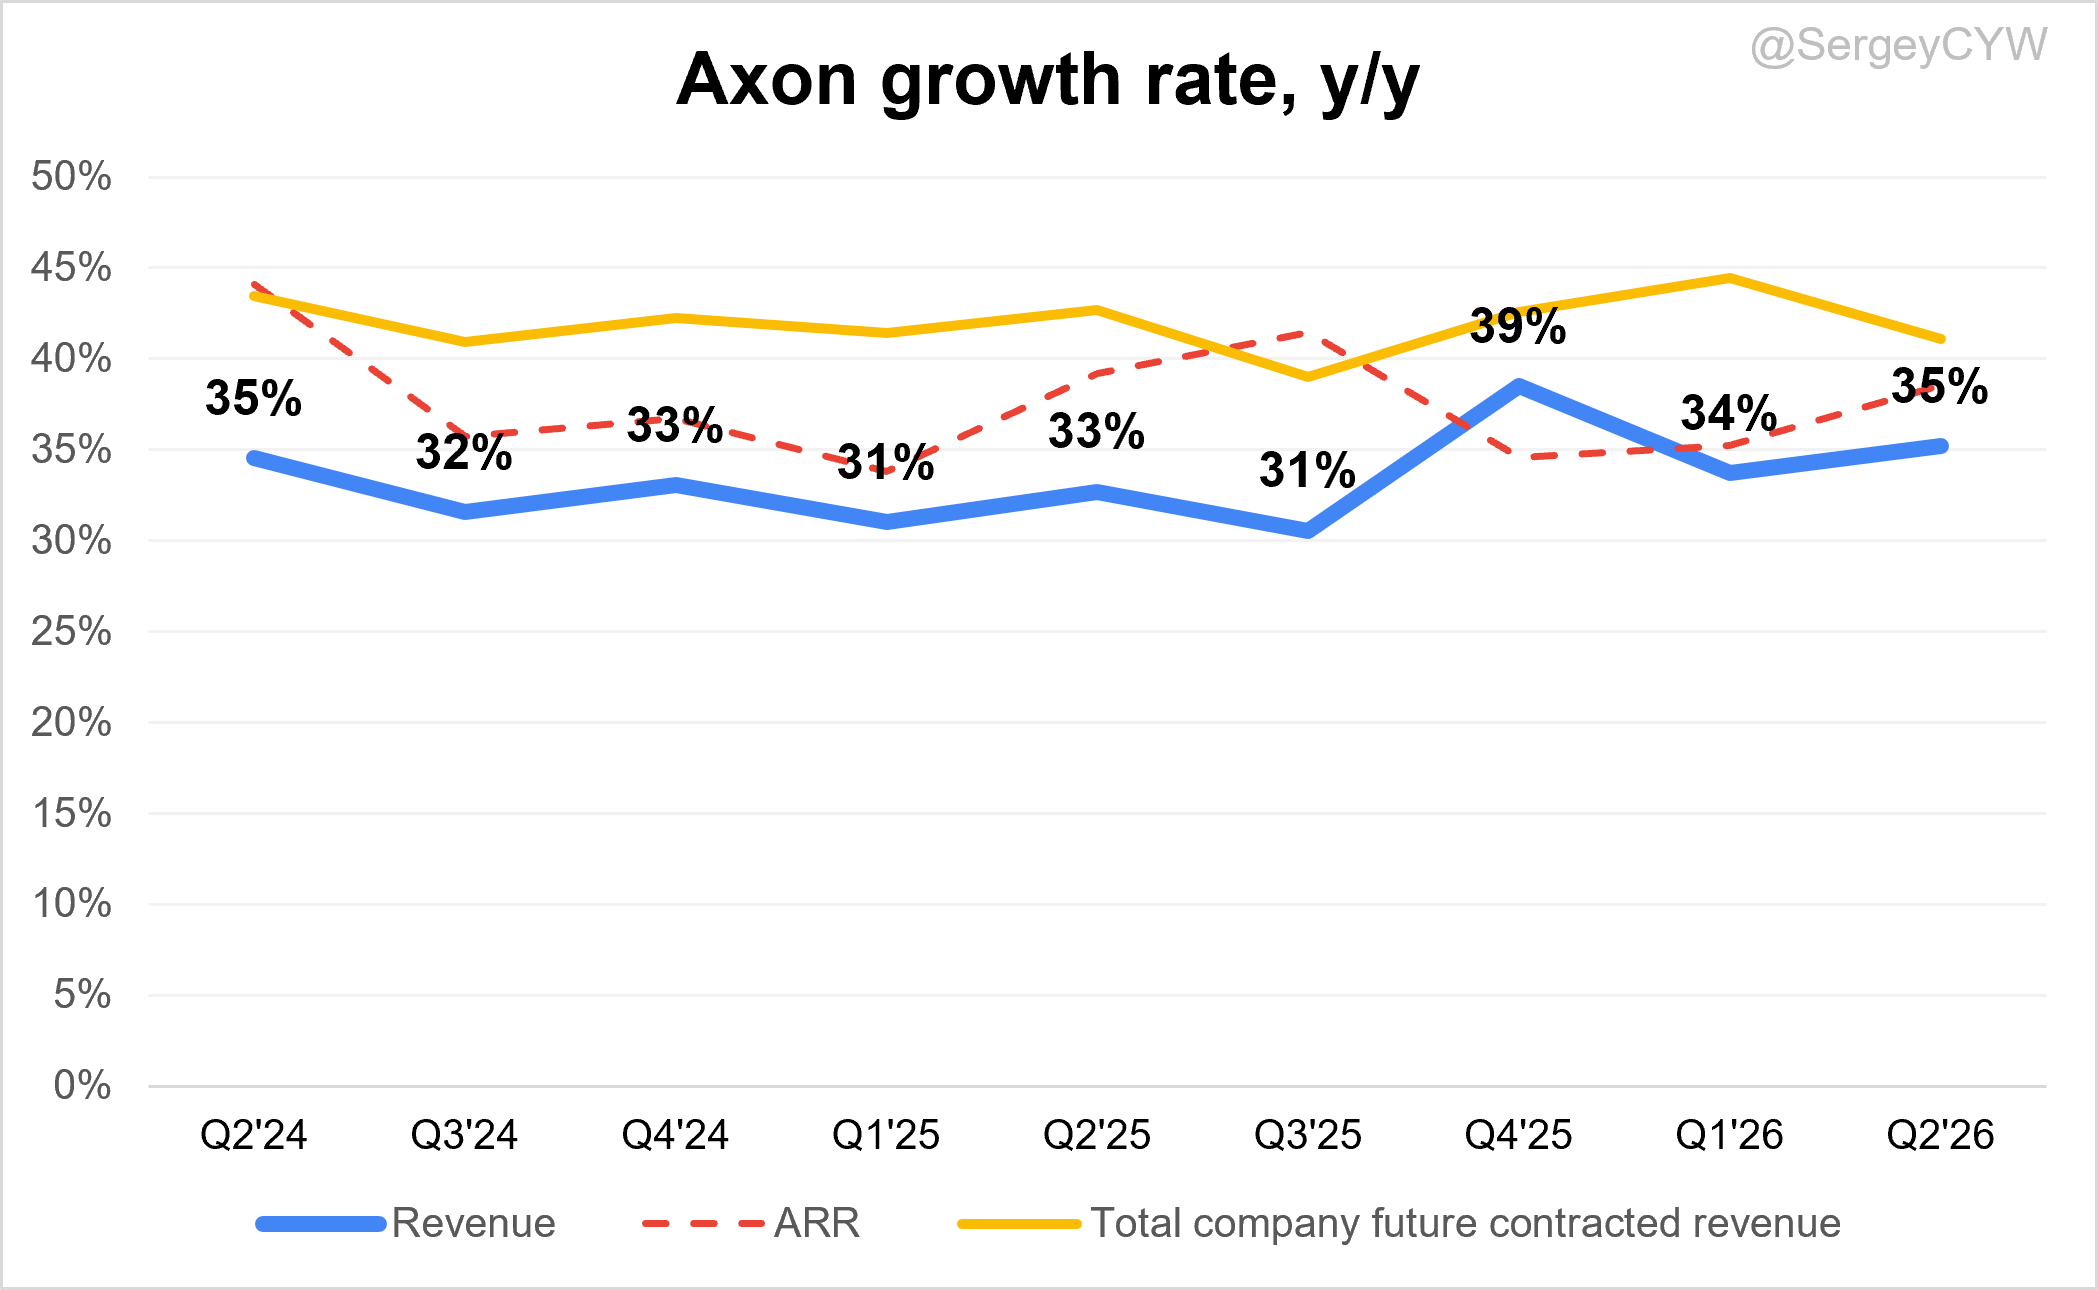
↗️Total company future contracted revenue $15.10B (+41.1% YoY)
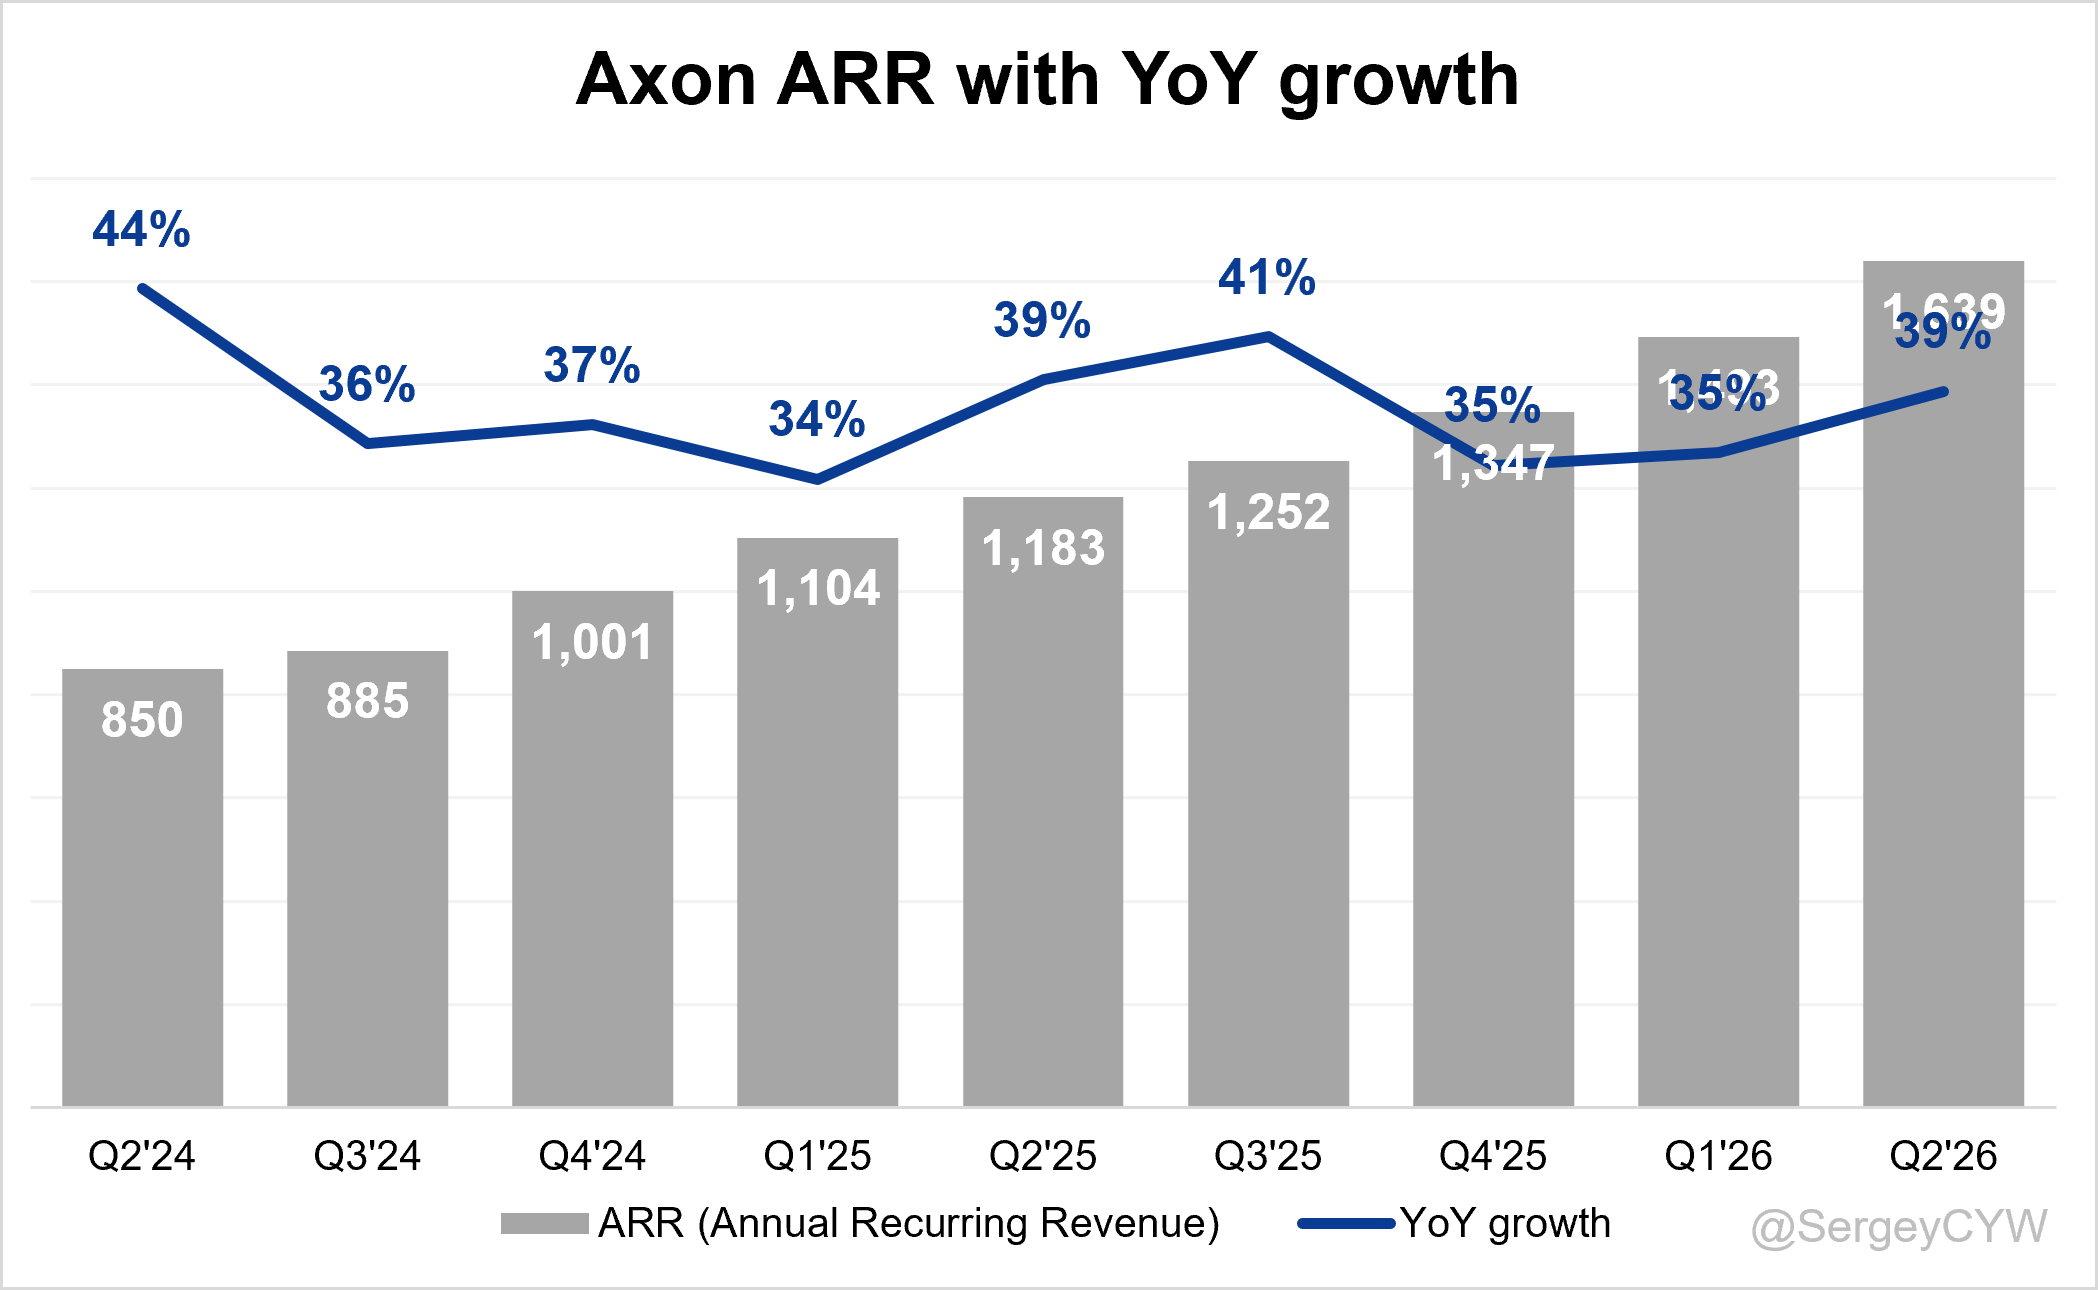
↗️ARR $1,639M (+38.5% YoY)
Operating expenses
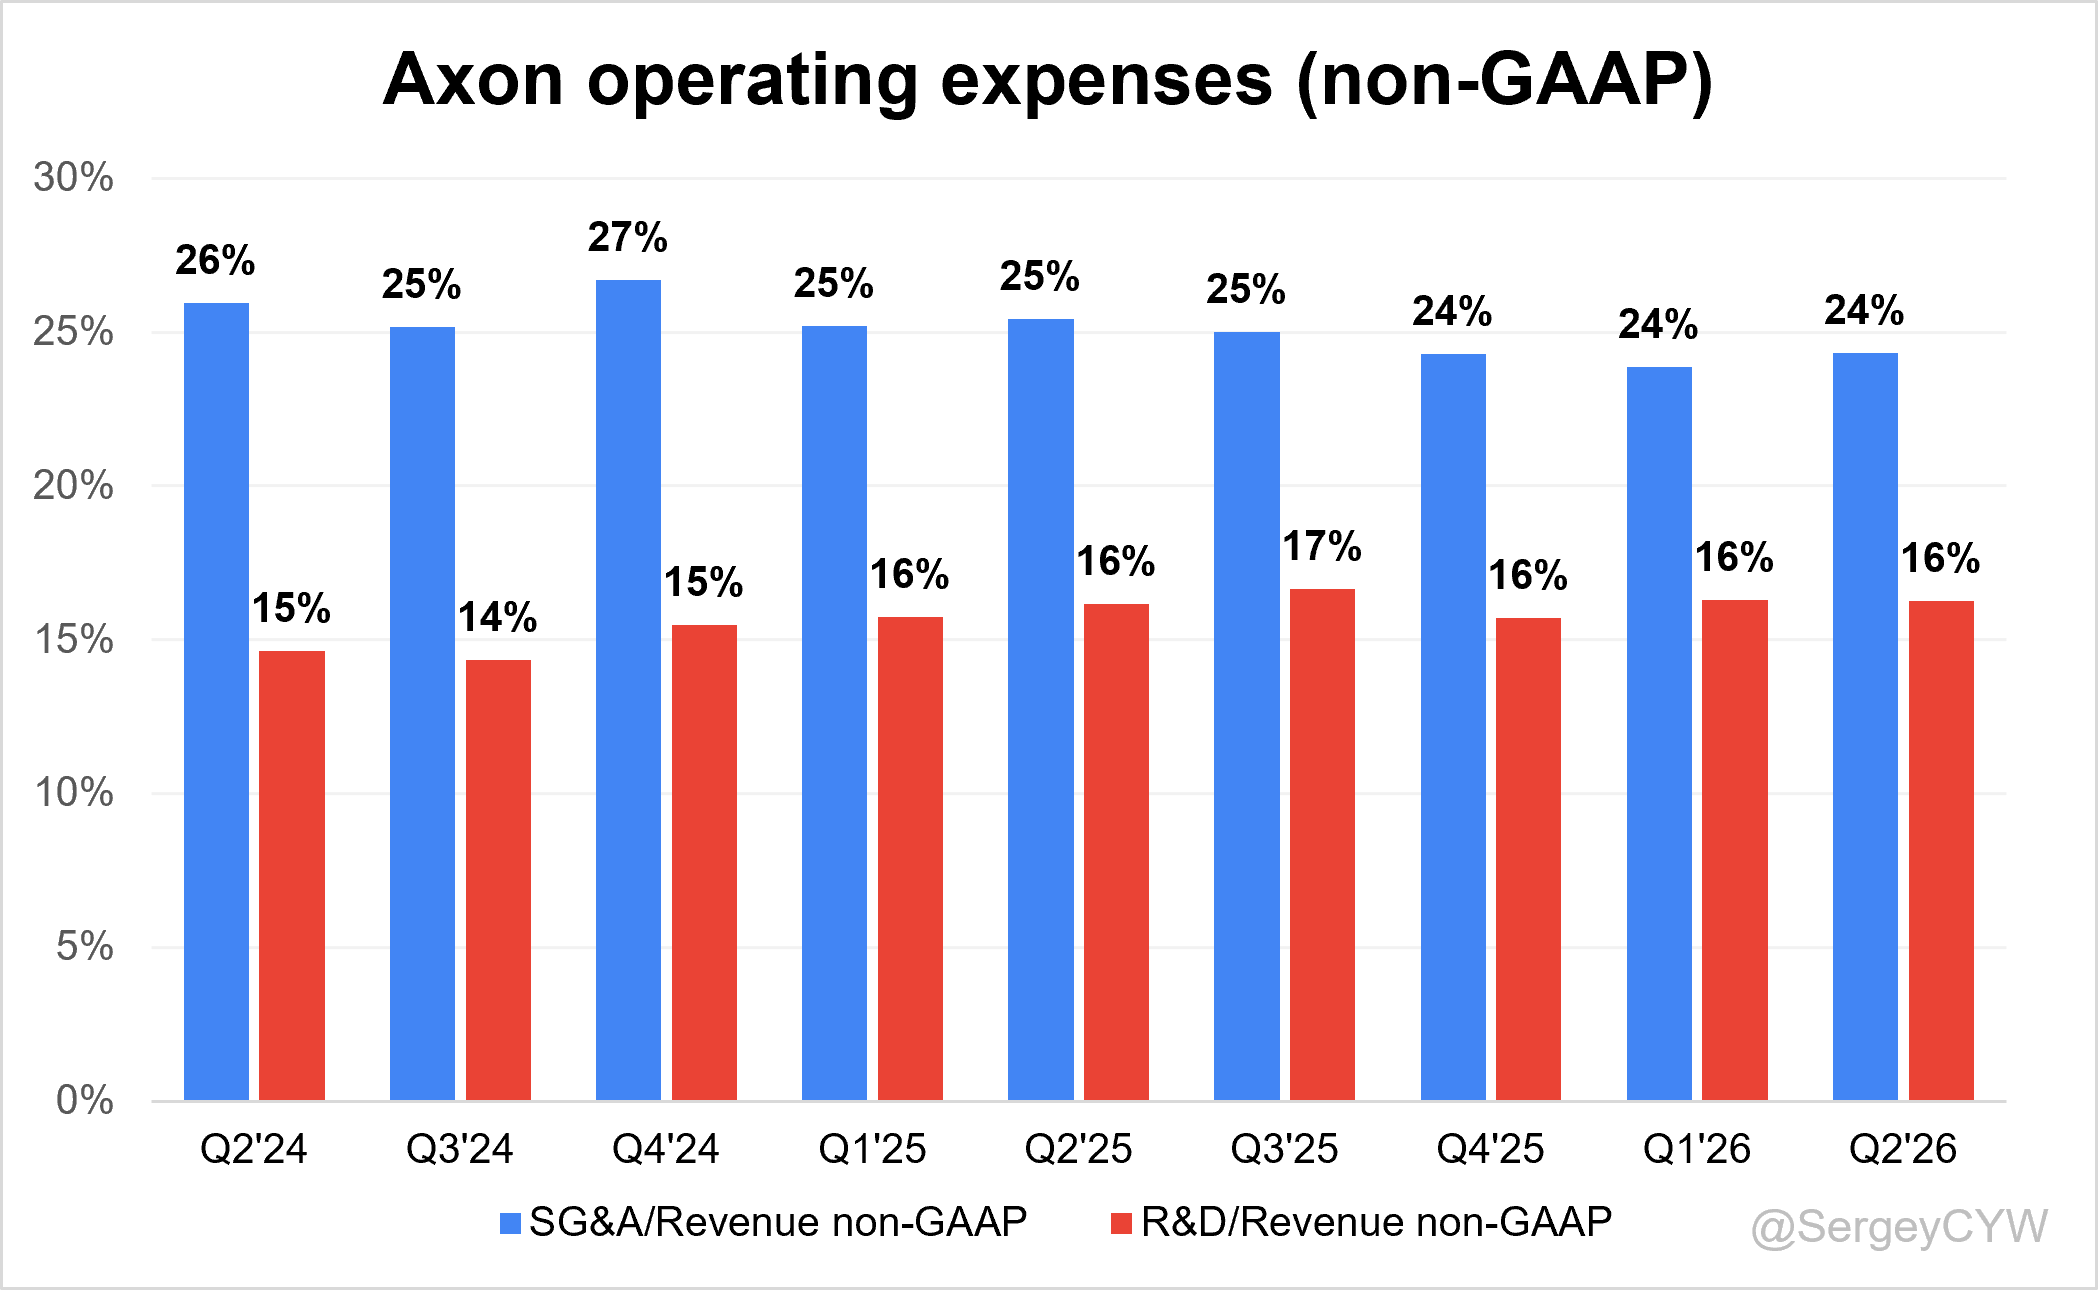
↘️SG&A*/Revenue 24.3% (-1.1 PPs YoY)
↗️R&D*/Revenue 16.3% (+0.1 PPs YoY)
Quarterly Performance Highlights
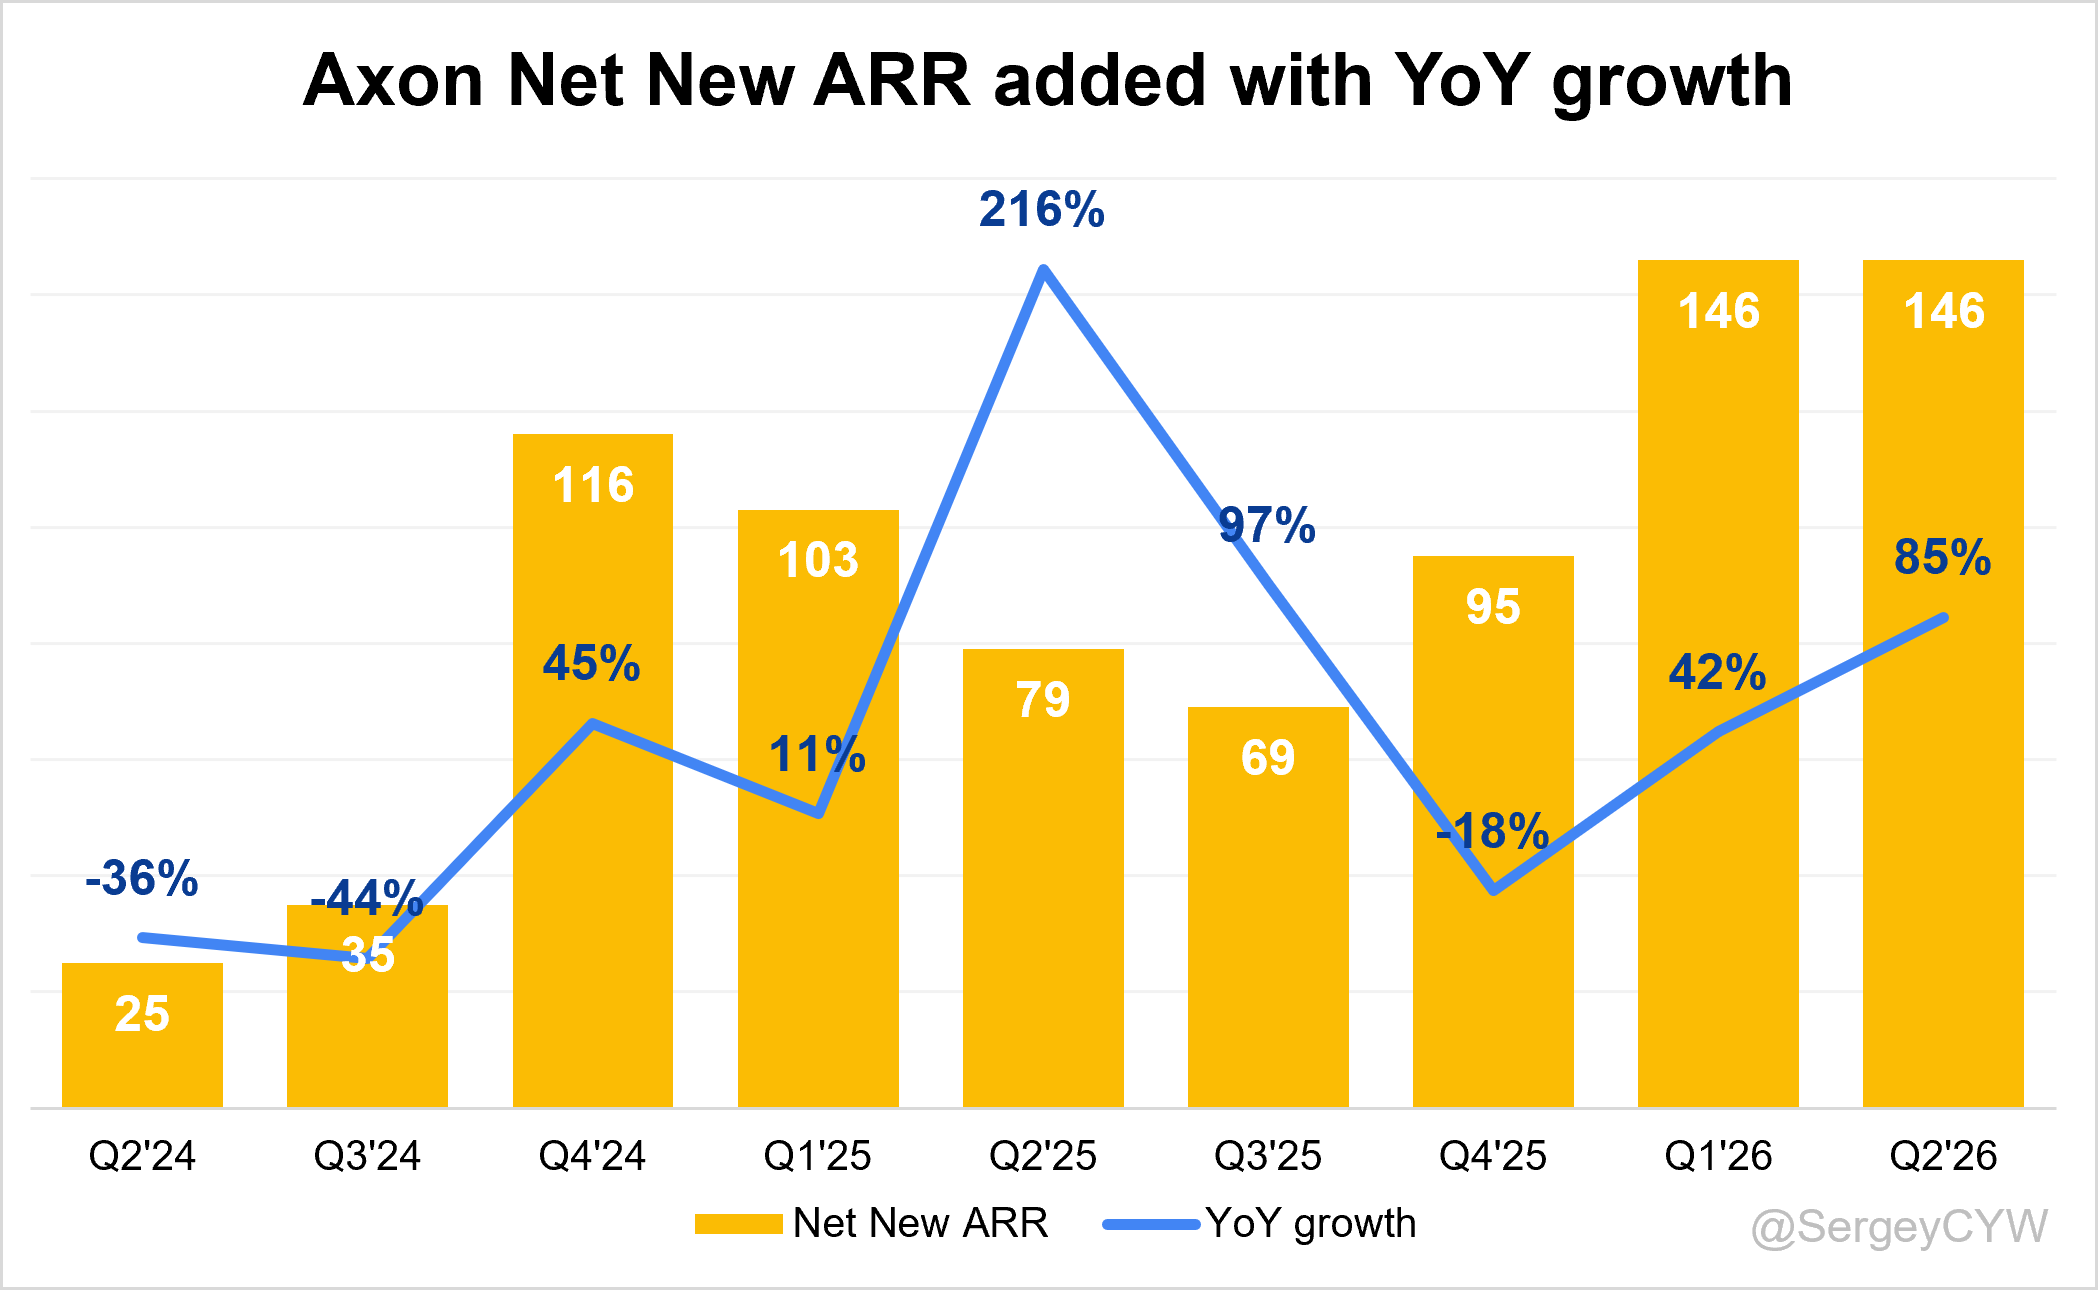
↗️Net New ARR $146M (+84.8% YoY)
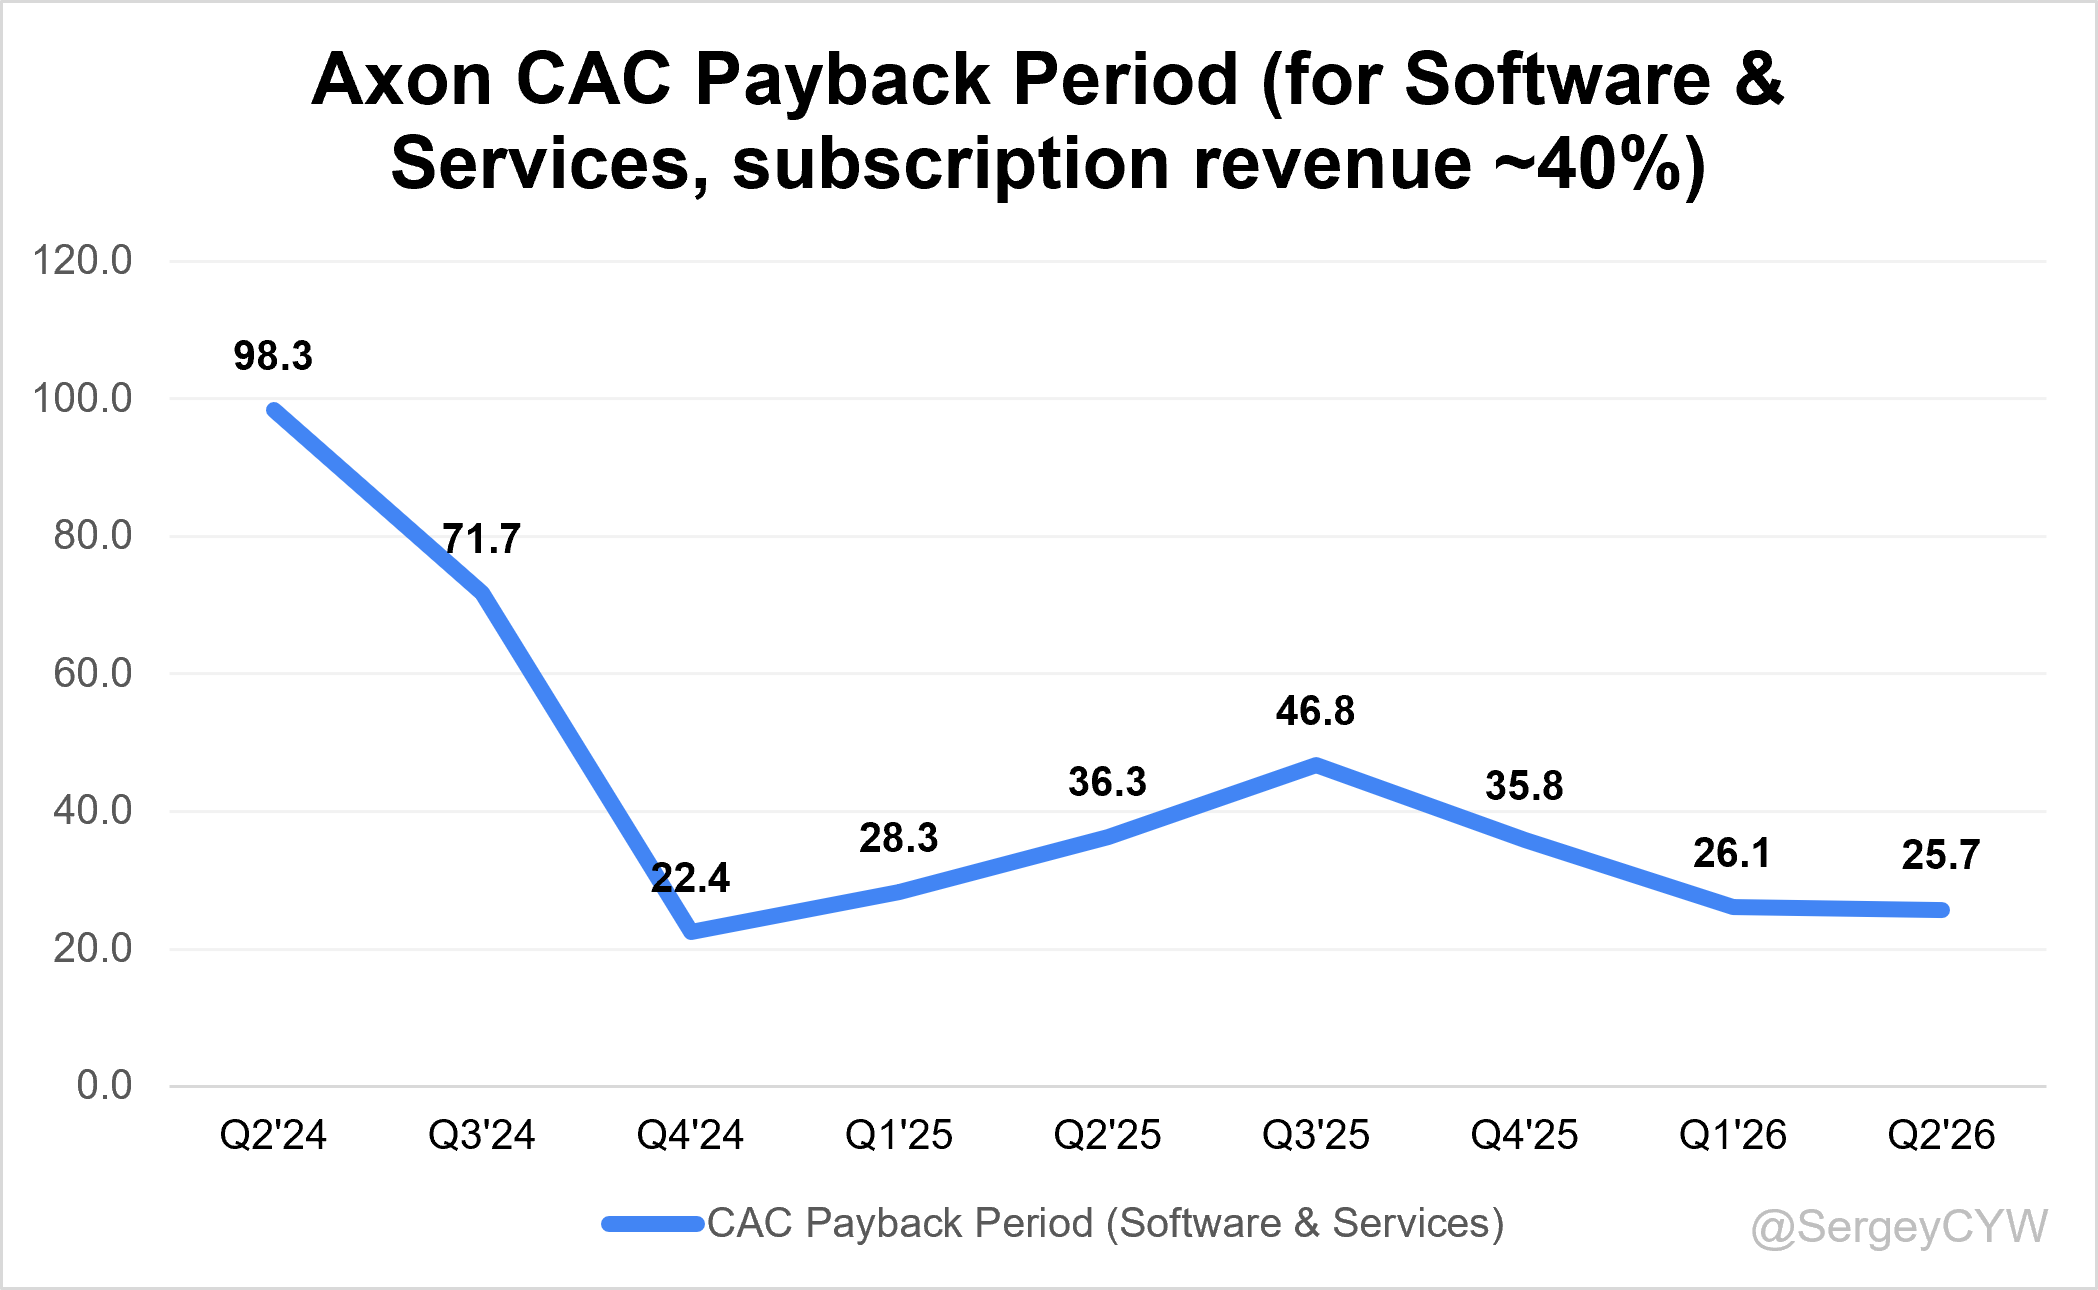
↘️CAC* Payback Period 25.7 Months (26.1 LQ)
Dilution
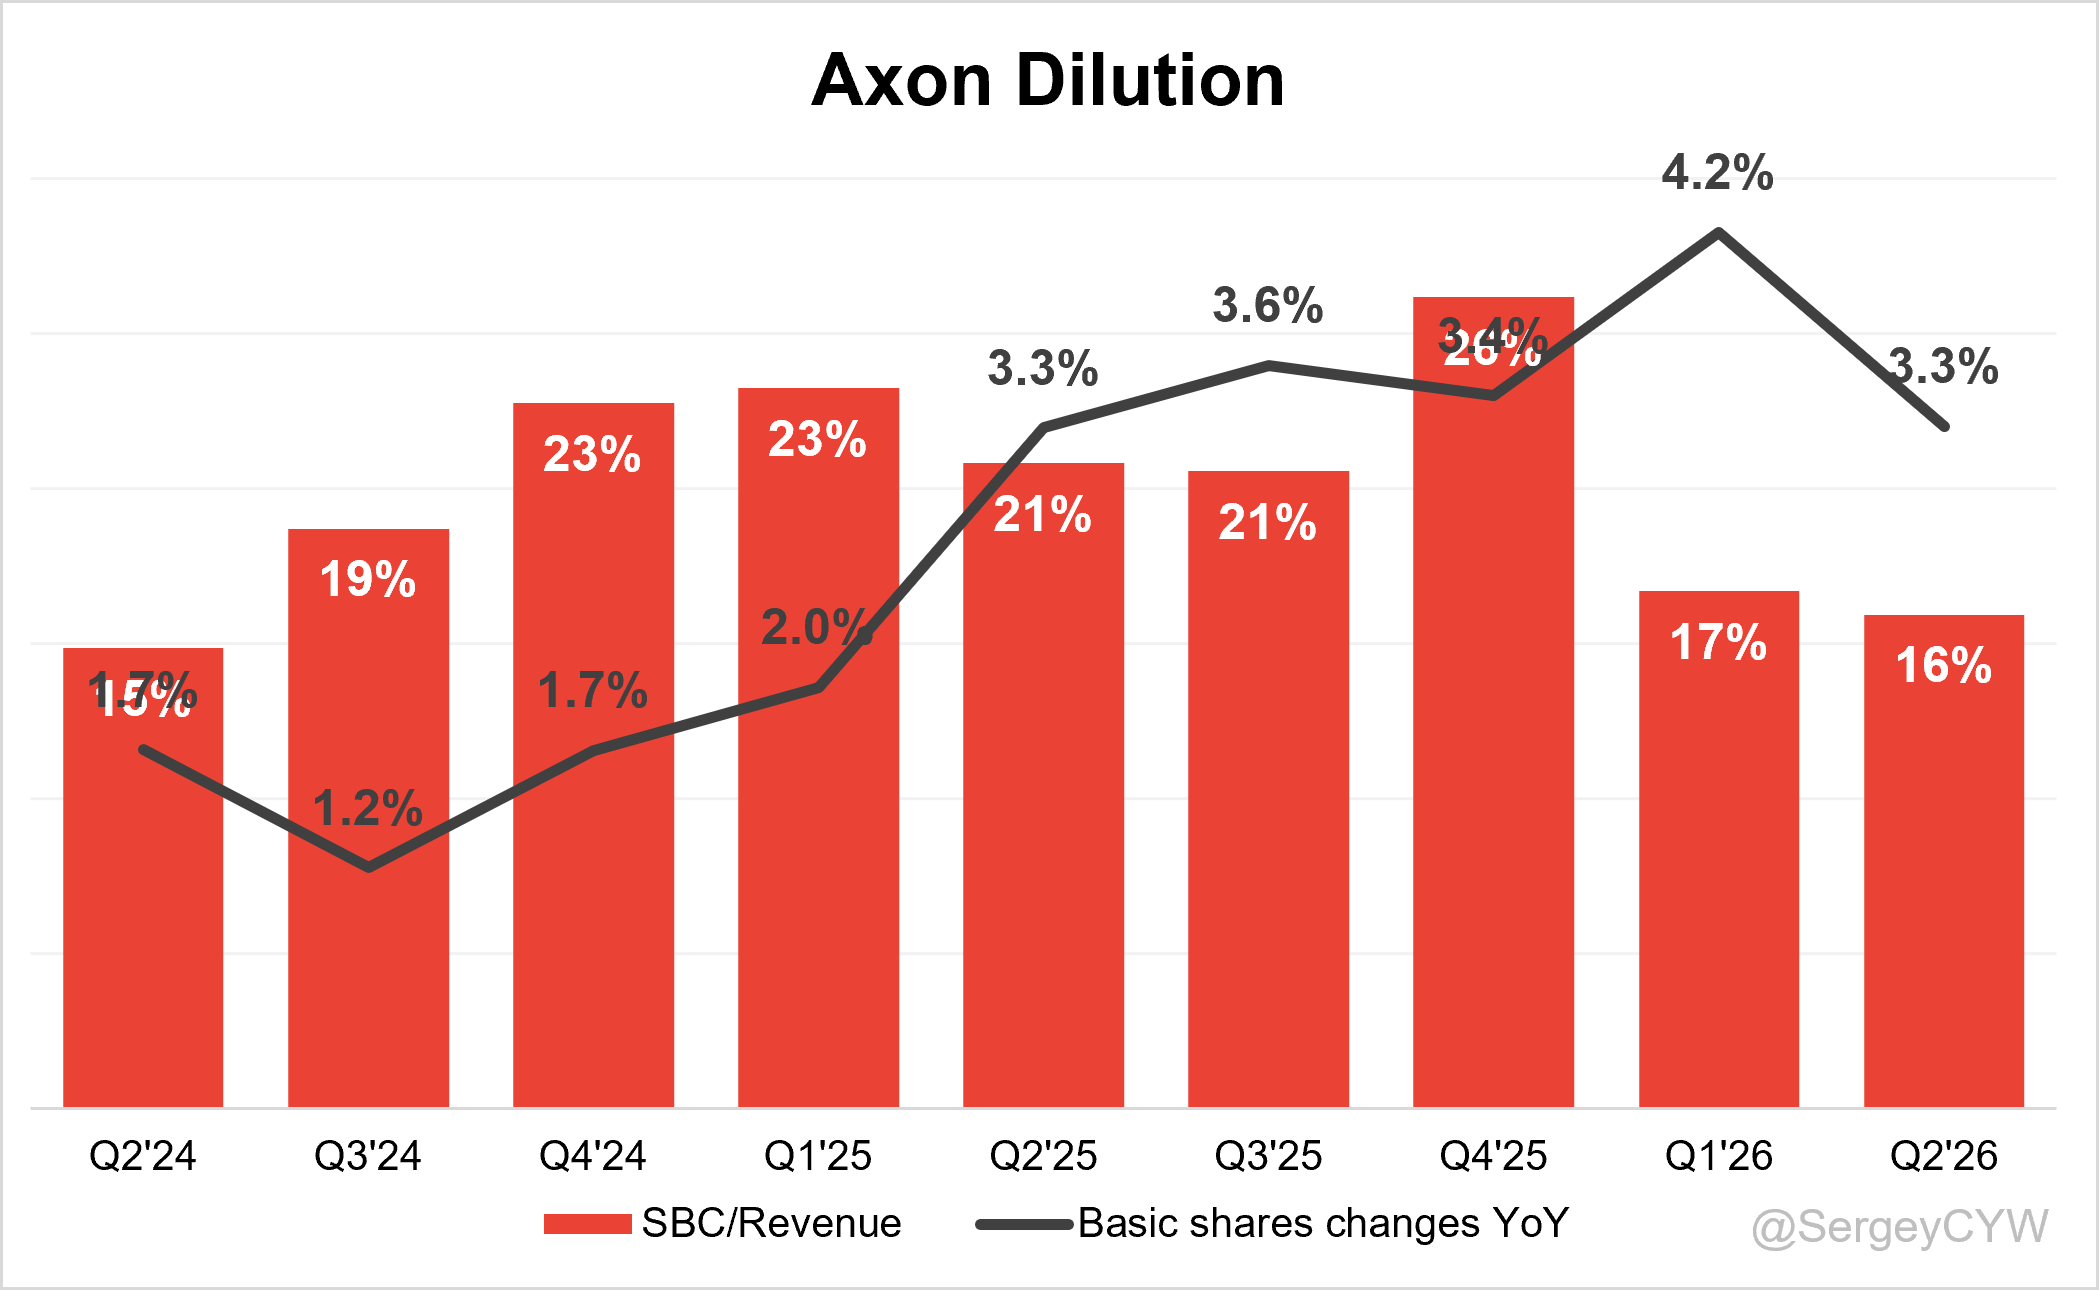
↘️SBC/rev 16%, -0.8 PPs QoQ
↘️Basic shares up 3.3% YoY, -0.94 PPs QoQ
↘️Diluted shares up 0.6% YoY, -0.6 PPs QoQ🟢
Guidance
↗️$3,670.0 - $3,725.0M FY guide (+33.0% YoY) raised by 1.5% beat est by 1.2%
🟢Positive
Revenue increased +35.2% YoY to $904 million, beat est by 3.2%. Adj EPS $1.88 beat est by 2.2%.
ARR grew +38.5% to $1.64 billion, and net new ARR increased +84.8% with addition $146M.
NRR improved to 126% from 125% last quarter.
Future contracted revenue rose +41.1% YoY to $15.1 billion, supporting strong long-term visibility.
Connected Devices revenue increased +34.6% to $506.6 million, with gross margin expanding 330 BPs to 51.9%.
Platform Solutions revenue rose +123% to $150 million. Dedrone exceeded $100M in quarterly revenue, and Outpost and Lightpost bookings reached $100M over twelve months.
AI Era Plan revenue grew +700% YoY. Newer software products outside Evidence generated more than one-third of software revenue and grew +70%.
International and enterprise bookings each increased 3x YoY, supported by AI, TASER 10, Body Mini, Dedrone, and larger platform deployments.
Full-year revenue guidance increased +1.5%, implying 33% growth and beat est by 1.2%.
🟡Neutral
Software and Services revenue increased +36.2% to $397.8Ь, but gross margin declined 430 BPs to 71.3% due to memory and scaling costs.
Adj gross margin reached 62.9%, down 30 basis points YoY, and improving 130 BPs sequentially from tariff refunds.
Net margin declined 210 basis points to 3.3%, while operating margin improved 530 basis points to 5.2%.
Free cash flow margin improved 1,700 BPs YoY but slightly negative at 0.1%. Full-year free cash flow guidance $450M.
Gross bookings grew +20% YoY, slower than nearly 50% growth a year earlier.
Diluted share count increased only 0.6% YoY, but basic shares rose 3.3%.
SBC at 16% of revenue, improving 80 BPs QoQ.
🔴Negative
Q3 adj EBITDA margin is expected to decline QoQ due to higher memory costs.
Dedrone and Platform Solutions with lower initial hardware margins.
Higher component costs, supply-chain complexity, long government procurement cycles, and large contract approval requirements - execution risks.
Counter-drone revenue volatile because deployments include large hardware shipments and state-level mitigation remains restricted by regulation.
Strong Q2 from AXON. Revenue growth accelerated to +35.2% YoY, beating estimates by 3.2%. ARR growth accelerated to +38.5%, while total company future contracted revenue increased +41.1%. Both metrics grew faster than revenue, suggesting further acceleration ahead. Net new ARR reached a quarterly record, in line with Q1, and increased +85% YoY. Retention improved to 126%, showing existing customers continue expanding spending and helping maintain revenue growth at a high level. Management significantly raised full-year guidance by 1.5%.
Axon has two main segments, Connected Devices and Software & Services. Both showed accelerating growth in Q2. Connected Devices revenue growth accelerated to +34.6%.
Main Connected Devices growth drivers were Dedrone, TASER 10, and Axon Body 4. Body-camera shipments are expected to increase 20% to 30% QoQ in Q3, driven by Axon Body 4 and TASER 10. Demand for TASER 10 remains strong, with Axon now booking more units than total lifetime bookings for TASER 7. Connected Devices also includes Platform Solutions, where revenue increased +123%. Platform Solutions includes Axon Fleet, VR, and Dedrone. Dedrone is growing rapidly and exceeded $100 million in quarterly revenue.
Software & Services revenue growth also accelerated to +36.2%. Software & Services makes Axon’s business more sticky.
Evidence remains the foundation of Axon’s software platform. In Q2, management highlighted that newer categories grew +70% YoY and now generate approximately one-third of software platform revenue. These categories include real-time operations, Records, Axon 911, AI applications, and counter-drone software. AI Era Plan revenue grew +700% YoY, making it Axon’s fastest-growing software product. Axon is successfully integrating AI, while management positions AI as an enhancement to human judgment rather than a replacement for humans.
GAAP gross margin and operating margin improved both YoY and QoQ.
Non-GAAP gross margin reached 62.93%, slightly below 63.22% a year ago due to higher memory costs, and above 61.55% in the previous quarter because of tariff refunds, but no tariff refunds are expected in Q3.
FCF was negative due to pressure from inventory investments, but management continues to expect $450M in FY free cash flow and maintained its outlook. For Q3 non-GAAP EBITDA, management expects continued pressure from higher memory costs, followed by a recovery in Q4.
International growth strong, International bookings increased 3x YoY, driven by several large agreements with customers outside the U.S.
Previously elevated SBC/Revenue continues to decline. In Q2, SBC represented 16% of revenue, an acceptable level for a company growing revenue 30%+ YoY. Investor dilution is also normalizing, with weighted-average basic shares increasing decline to +3.3%.
Thank you for reading!
Follow me for more frequent updates on X/Twitter and Threads, and on LinkedIn. For visual infographics, check out Instagram, and for portfolio changes, follow me on SavvyTrader.
Disclaimer: This earnings review is for informational purposes only and does not constitute financial, investment, or trading advice.
Comments
Nothing yet. Say the first thing.
Sign in to join the conversation.