
So in my last post I highlighted the value of an IUL wrapper that reduces the drag of both volatility and taxes in constructing a portfolio—namely that it can provide higher risk-adjusted returns over the long-term for people in high tax brackets.
And the longer you plan on investing, the more value the wrapper has.
But in order to obtain this long-term value you first have to absorb the upfront cost of acquiring it.
The idea is similar to the thought process one should do when considering a Roth conversion. For those who don’t know what a Roth conversion is, it’s a financial strategy that involves replacing a tax-deferred wrapper with a tax-free wrapper. But in order to replace one wrapper for the other, I need to pay more taxes today than I otherwise would have.
Should I pay more in taxes now so that I can get tax-free growth going forward?
In some cases clients may be in a 12% tax bracket now, but might be in a 32% or 35% tax bracket in the future with Required Minimum Distributions (RMDs).
So it can make sense to do a Roth conversion and pay as much as 24% in taxes now to avoid the 32%+ tax rate in the future if I have a long enough investment horizon to make up the difference.
In other words, I am actively choosing to pay more in taxes now in order to reduce my tax-liabilities in the future.
This is the equivalent of a front-end sales load to acquire this tax-free Roth IRA wrapper that I can use for the rest of my life.
I am losing money now, so that I make more money over my lifetime.
But in order for the conversion to work in my favor, I need to invest long-enough for the tax-free compounding to make sense.
If I pay 24% taxes now when I could have only paid 12%, but then only use the tax-free Roth account for 2 years before taking out my money, then doing a Roth conversion isn’t going to make any sense. I could have just stayed in the 12% bracket this whole time.
It’s not fair to evaluate the cost of the wrapper based either solely on the upfront cost of it or a poor financial decision on my part.
If I’m prone to not sticking to long-term financial plans I shouldn’t even be considering this.
The value of the Roth conversion strategy is dependent on me sticking to the long-term plan because I understand the value of avoiding the 32%+ tax-bracket in the future—as well as any future tax increases that may occur between now and the 20 to 30 years until I pass away (i.e. the Roth conversion strategy also is a hedge against future tax increases).
The same mentality applies to using the IUL wrapper.
The value comes from the potential for higher yields and the reduction in taxes and volatility that the wrapper offers and the improvement of the IUL over using bonds as a risk-reduction strategy.
But how do we evaluate the cost?
This is where a lot of clients and advisors let their biases against the product overwhelm any sense of rational thought.
Do some IUL products have horribly high expenses and low crediting rates that make the cost excessively high?
Absolutely.
But if you listen to clients and advisors who have gotten burned by these products, that’s all you hear about.
Are there some products on the market that have incredibly low expenses and uncapped strategies that make them incredibly compelling—especially in contrast to taxable bonds that clients in high tax brackets would be investing in otherwise?
Absolutely.
In this post I’m going to break one of these products down—and help you understand how to evaluate the costs of an insurance product so that the next time you are evaluating one as part of your wealth management/retirement planning strategies you know what to look for.
The Drag of Taxation vs IUL Expenses
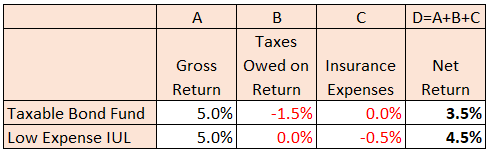
The high level idea when we look at how to evaluate the true cost of an IUL is to compare two measures:
1) The Gross Crediting Rate;
2) The Net Crediting Rate after Expenses
The gross crediting rate is the amount of interest that’s credited to the IUL policy before expenses.
The net crediting rate is the net amount of interest that’s credited to the IUL policy after the expenses.
So in order to evaluate this we first need a gross crediting rate assumption.
For the sake of our analysis we’ll assume the gross crediting rate is 5%. In the modeling from our last post the chance of the long-term gross crediting rate being 5% or under was less than 20%. However, the point of choosing a gross crediting rate for the purpose of this post is to assess the cost of the vehicle—not the potentially higher returns the IUL can offer.
Also it’s important to note that the IUL should be seen as an alternative to investing directly in taxable bonds. And the current yield on investment grade bonds is roughly around 5% at the moment.
So 5% as a gross crediting rate is a solid starting point.
Table 1 below shows the impact of investing $150k/year over 5 years into an IUL policy on a 50 year old woman with a life expectancy of 90.
The table below breaks down the first 11 years and then every 10th year until age 100.
Table 1: IUL Policy Illustration Breakdown
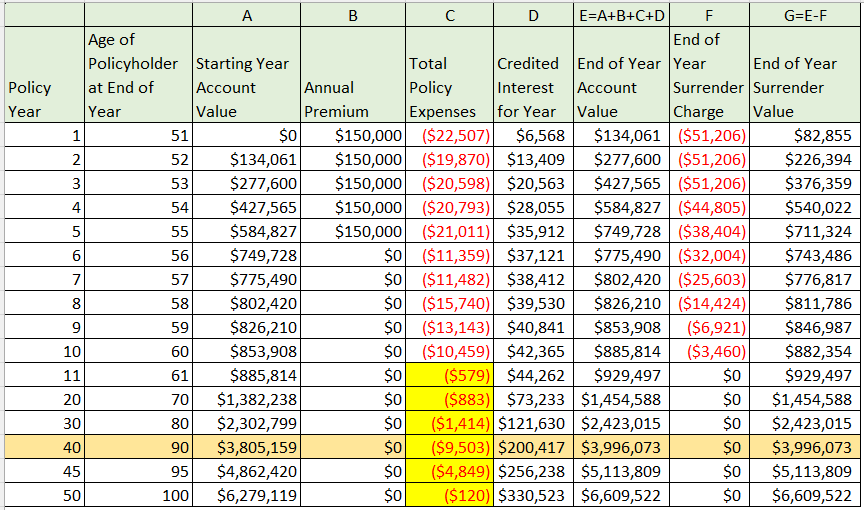
The above table shows the $150k per year being paid into the policy for the first 5 years (Column B) with no premiums afterwards. The yearly policy expenses can be shown in Column C while the Interest credited in the year is shown in Column D. Remember that the gross crediting rate for the policy is 5%--which assumes that the uncapped S&P500 price return does about 7.5% per year.
Note that the actual crediting strategy is a 2 year S&P500 price return crediting strategy with a 525 basis point spread. So if the S&P500 price return does 15.50% every 2 years then 10.25% is credited to the policy. If we break this down on a yearly basis this is equivalent to a 7.5% gross S&P500 price return per year and a 5.00% yearly crediting rate to the policy.
The surrender charge in Column F is applied if the policyholder cancels the policy. As a result, someone who cancels the policy will get the value in Column G (the surrender value) instead of the account value in Column E.
This surrender value concept is an important point I’ll bring up later.
I’ve also highlighted a couple important cells. The first are the policy expenses on the policy from years 11 forward highlighted in yellow. The next is the life expectancy at age 90.
What I want you to pay particular importance to are how high the policy expenses are in years 1-10—particularly in years 1-5 when the client is paying premiums into the policy.
Analogously, look how low the policy expenses are in years 11 onwards. So even though the account values are increasing steadily, the policy expenses are actually going down.
So while the policy is heavily frontloaded, the policy expenses in years 11 onwards are almost negligible in relation to the extremely high account values. We’ll see this in more detail in the next table.
So the people who are getting hurt with this financial product are people who purchase the policy and then cancel it in the early years when the expenses are high. These policyowners never get to benefit from the extremely low expenses in the later years.
Even worse, they are hit with the surrender charge during the first 10 years on their way out.
But the policyowners who keep the policy for the long run are benefitting from this as we’ll see in the next section.
For those math geeks like myself who want to download the full excel spreadsheet and see all the years for yourselves, see the full break down of charges for every single year by downloading the spreadsheet below:
A better way to understand the drag of policy expenses (or taxes for that matter) is to look at the gross crediting rate and compare that to the net crediting rate after expenses. The difference between these two is the expense ratio for the year. Unlike an ETF or a mutual fund, the expense ratio for an IUL policy is not constant in every year. As we saw in Table 1, it’s high in the early years and low in the later years.
We can also compare the expense ratio and net crediting rate to the compound IRR on the policy. That way we can see the effect of the cumulative expenses to that point and time on the policyowner’s return.
In other words, of the 5% gross crediting rate how much is the client actually keeping after expenses?
The table below helps us understand all of those questions.
I’ve highlighted the row of policyowner’s life expectancy (age 90) in orange.
Table 2: Understanding the Expense Ratios of an IUL
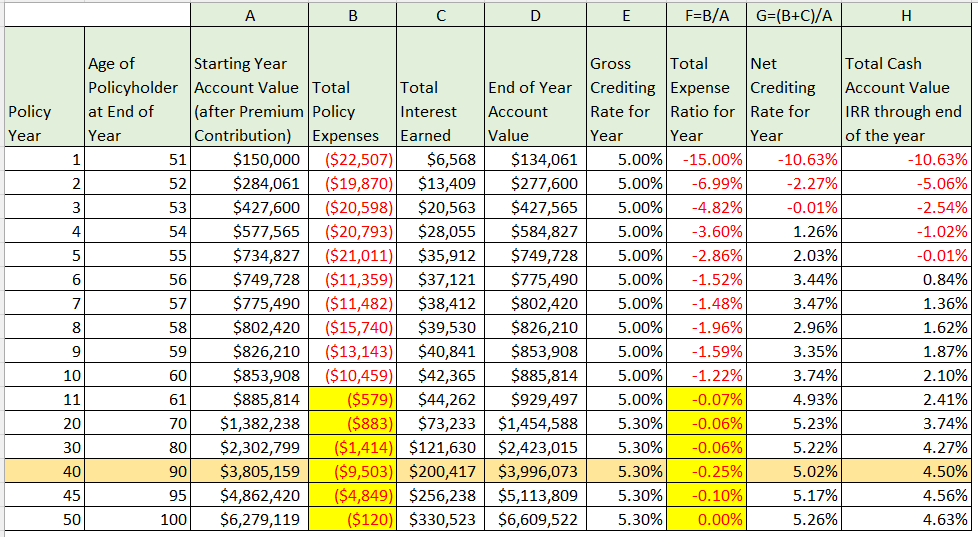
The table above adds a couple of important columns to Table 1:
The Gross Crediting Rate for the Year (Column E):
This is the gross amount of the uncapped S&P500 price return with a 525 basis point spread that is credited to the policy. This is assumed to be 5% as previously mentioned.
The Total Expense Ratio for the Year (Column F):
This is the total expenses for the year (Column B) divided by the starting year account value (A). It gives us an idea of how much the expenses are dragging down the return.
The Net Crediting Rate for the Year (Column G):
This is the credited interest for the year (Column C) plus the total expenses for the year (divided by the starting year account value (A). It gives us an idea of how much the expenses are dragging down the return of the policy for the given year.
The Total Cash Account Value IRR Through the End of the Year (Column H):
While Columns E through G give us an idea of the effect of expenses on that particular year, they don’t give us an understanding of the drag of the policy expenses on the return for all years up through that year. The total end of year IRR metric (Column H) on the other hand gives us an idea of our compounded return through the end of the year.
There are a couple of note while things to note here:
1) The high expense ratio in the early years hurts the client’s early year IRRs (Column H), but the low expense ratio in the later years more than makes up for it
Due to the high expense ratios in the early years (Column F), the client doesn’t even start to break even on the policy until year 6. However, we can see that starting in year 11 the client is earning a net 4.93%+(Column G) which is 99.3% of the gross return of 5%. This is because the policy expenses at this point are basically negligible. These low expense ratios in years 11+ then start to dramatically increase that account value IRRs (Column H). At the life expectancy of the client (age 90) the client has earned a 4.5% IRR on a 5% gross crediting rate—that’s 90% of the return which means only 10% was lost to policy expenses.
2) Ultimately, having a high expense ratio in the early years and a low policy expense ratio benefits policyholders who keep the policy at the expense of people who cancel it early
Think about it this way. If you take a straight average of the expense ratio for all years on the policy it ends up being about 1% a year. However, as we talked about the policy is “front-loaded” so that it’s not a level 1% every year. In the first year it’s 15% and in years 11+ it’s under 0.10%. So the expense ratio is high for a few early years when the client has little invested but is extremely low when the client has a lot invested in the policy for a significantly longer period of time. If you’re a policyowner, you should make this trade every time over taking a level expense ratio every year of the policy. The net effect of structuring the policy this way means that the IRR to life expectancy for the client is 4.50% of the 5.00% gross crediting rate.
The only people who are hurt of course are the people who cancel the policy early when the expense ratio is 1%-15% per year and never get to years 11+ when the expense ratio is around 0.07%-0.1%.
And the sad truth of the matter is that 50% of policyowners will cancel these policies in the first 10 years.
3) In the later years of the policy the insurance company is giving the remaining policyowners a bonus due to the large number of people who canceled the policy in the early years
Note that the gross crediting rate increases in year 20 from 5.00% to 5.30%. This is not because we assumed the S&P500 price return increased. Rather this is because the carrier is giving a 0.30% automatic bonus ON TOP of whatever is credited to the policy due to the S&P500 price return. And this is only possible because around year 16 about 60% of the people who purchased the policy have canceled it. So the carrier has built up a large reserve from people who purchased the policy and then canceled it in the early years when the policy was heavily front-loaded.
Think of it this way: Let’s assume 100 people pay $1,000 each for a life insurance policy. The life insurance company then purchases $100,000 worth of bonds earning 5%. So at the end of the year there is a $105,000 worth of bonds that would be equally distributed amongst the 100 people. But let’s assume that 40 people cancel their policy before the end of the year and only get their $1,000 back and none of the interest. That means there is now $65,000 to be spread amongst 60 people. The math here works out that each of these 60 people get $1,083. Which means instead of the 5% interest they were expecting to get, they now get an 8.3% return as a result of the 40 people who canceled the policy and walked away with only their principal back and none of the interest. In other words, the 60 people received a 3.3% bonus interest credited to them because of the 40 people who walked away with just the money they put in. The interest that would have gone to them is being distributed to the 60 policyowners who kept their policies. I’ve spoken about this redistribution of benefits a number of times on this substack (including here and here).
A lot of financial advisors hate IUL products. While there are legitimate complaints here, some of which I’ll be covering below, I have yet to meet an advisor who criticizes IUL products who actually understands how to use it as a financial planning tool. If they did, they’d understand that the right IUL solution for a client in a high tax bracket will be a mathematically better retirement planning and wealth accumulation solution than the one-size-fits-all stock-bond portfolio they use for all their clients. The problem here is that it’s an advisor’s job to manage the client’s risk exposure and because they don’t know how to manage the risks when it comes an IUL policy they presume it has no value and don’t use it for their wealthier clients.
So I’m going to start with the legitimate complaints here and then jump into the biases.
Legitimate complaint: The large commissions on IUL policies lead agents to sell expensive products to clients who are not a good fit for the product and who don’t understand them.
This is perhaps the biggest issue with IULs. The large upfront commission incentivizes agents to sell the products to the wrong people.
Who are the wrong people you ask?
Well they fit into one of the following categories:
1) Are in a low tax bracket: If you’re total marginal tax-rate (fed and state) is less than 32%, this isn’t the product for you. A tax-free wrapper benefits those in the highest tax-brackets.
2) Aren’t committed to saving as part of a retirement plan: Remember that this is a retirement strategy. You’re saving while in a high tax-bracket so that your savings compound tax-free and then you can take it out in retirement thereby getting the benefit of both tax-savings and compounding. If you’re not committed to a retirement plan that involves saving for 15+ years before withdrawing your money this isn’t for you. Too often people purchase these policies and then either immediately need liquidity or can’t contribute anymore to the plan. Both of these choices make the IUL look bad when it’s really the policyowner’s behavior that’s to blame. It’s no different than saying you’re going to contribute $5,000 a year to a retirement plan every year, but then in year 4 you pull out half your money and stop contributing to the plan anymore and then are shocked when you retire that you don’t have as much money as your advisor said you would have if you contributed $5,000 a year for 10 years.
3) Don’t believe in fixed income: This is primarily a fixed income play. People who invest in fixed income do so because they want more safety with their investments but pay for that safety in the form of heavy taxation. The reason you use a tax-free wrapper like IUL is you want access to an investment grade fixed income portfolio with protections against interest rate risk and taxation while also having safe access to options that allow you the ability to access part of the upside in long-term investment strategies you believe in.
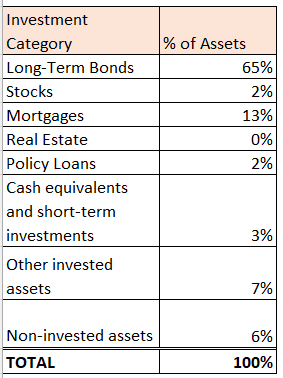
When you give money to an IUL company the bulk of your assets (~95% or so) are invested in their general account portfolio which primarily consists of long-term investment grade bonds and other fixed income investments as shown in the table below(Source: ACLI Factbook):
Table 3: Long-Term Fixed Income/Bond Portfolio of an Insurance Company
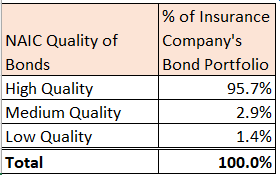
And the quality of those bond investments are also extremely high given that the insurance company has to rely on them to pay claims (Source ACLI Factbook):
Table 4: NAIC Quality of Insurance Company’s Bonds
Legitimate complaint: IUL Company’s have gimmicky indices
A lot of IUL company’s have “proprietary” indices or investment strategies with high participation rates (200%+) that when back-tested have extremely high returns especially when compared to the S&P500.
Will these returns be equally high going forward?
Possibly. But back-tested results don’t ensure high future returns.
But people who invest in these indices to try and “juice” their returns are missing the whole point of using the IUL product to begin with.
The point of the low volatility tax-free wrapper isn’t for you to find a new investment strategy to gamble your money on.
It's to do what you already do—investing in the S&P500 and investment grade bonds—in a more tax-efficient and lower volatility manner.
That’s what the IUL wrapper provides.
Risking the value of the wrapper on a new investment strategy defeats the purpose of using the wrapper.
You have to be able to separate your desire for higher investment returns from your broader financial, investment, and retirement planning.
You can gamble on returns with another vehicle.
Or just allocate a small portion of your IUL strategy to an index you like and use the rest of it as part of a larger financial and retirement plan.
IUL Biases
So now let’s tackle a number of the IUL biases.
1. All IULs have high expenses because of high commissions: Well I just proved this one wrong in this post. Sure, some products have extremely high expense ratios in all years. You shouldn’t be buying those. But some, like the one I showed, only have high expense ratios in the early years with the expense ratios in the later years being negligible. And it’s not because the commission on this policy is low.
2. IUL Company’s can change the participation rates/caps on the S&P500 indices after you purchase the policy to screw you
A common fear from policyowners is that the IUL company will change the participation rates and caps on the S&P500 index. It is true that some smaller, less reputable companies have been known to maliciously offer clients a higher cap on their products to entice them to purchase the product knowing full well that they plan on dropping the caps in later years.
However, this is the outlier more than the norm.
The caps change more often than not due to market conditions (low interest rates and high market volatility raise the cost of options which force the insurance company to lower their caps).
So when you see caps on products from large established insurance companies change, it’s not because they’re doing some form of bait and switch. Market conditions have changed which force the insurance companies to adapt.
But it’s also important to understand how these forces counteract each other. So yes, when interest rates drop the caps drop.
But guess what also happens when interest rates drop?
The stock market tends to do well.
This is why the Fed tries to lower interest rates from time to time to stimulate economic growth in the short-term.
So in other words, even though the caps are dropping as interest rates do, the short-term economic performance also gets a boost. So yes the caps are dropping, but you also have a higher chance of hitting that lower cap.
The converse is also true. Higher interest rates means the cost of acquiring the options are cheaper so the caps are higher. But higher interest rates also stifle short-term economic performance.
So yes the caps are higher, but you will have a lower chance of actually hitting the caps.
So what’s better? Having an 80% chance of hitting a 6% cap or a 10% chance of hitting a 9% cap?
This inverse relationship between caps and economic performance is a good thing.
It’s exactly why you purchased the product---to minimize volatility and serve as a buffer against poor economic performance.
No matter which direction interest rates move, the product is serving as a buffer.
So just because caps are high now because interest rates are high, doesn’t necessarily mean that’s a good thing.
Nor does caps being low in the future when interest rates are low mean that it’s a bad thing.
3. IUL companies will change the cost of insurance rates after you purchase the policy to screw you
When I talk to advisors about IUL policies, I often hear them mention about how life insurance companies can raise the cost of insurance rates after they issue the policy. And while this part is true, as someone who has served as an expert witness on class action lawsuits against insurance companies that have raised COI rates unlawfully, here’s what I can tell you about COI rate increases:
a. Carriers can’t use low COI rates to entice policyowners to buy the policy and then raise COI rates after the fact. This is known as a “bait and switch.” COI carriers can’t purposefully try to price the policy cheaply to increase sales and then increase COI rates later when they realized they priced it too cheaply. This is against the law and carriers have lost these lawsuits when they were sued. I have served as an expert witness on some of these.
b. It takes as much as 10 years before the carrier increases COI rates. If a life insurance carrier has poor mortality experience, they are allowed to increase the cost of insurance rates going forward. However, this is not an immediate increase. The carrier has to first spend years looking at their past experience. If their past experience is poor, the first step isn’t to increase COI rates. It is to stop selling the product. They then look to see what appropriate COI increases on their in-force block should be and have these increases approved by state regulators. So it’s often ~10 years between when the product was initially sold to when COI rates are increased.
c. COI increases in the later years of policies with low expense ratios are immaterial if the policy is funded properly. As we saw in our analysis, the expense ratios in the later years of this product were about 0.07%. A COI increase can be as high as 40% to 60%. Let’s assume a COI increase is 60%. That means a 60% increase would raise the expense ratio from 0.07% to 0.11%. This is negligible. With a low expense product, a large COI increase only matters if you haven’t funded the policy properly and made sure to have the lowest death benefit possible. People who haven’t done this face large costs due to the fact that they didn’t understand the importance of structuring this product properly as part of their retirement plan.
Investing in anything is a cost. It requires time, energy, and money upfront. These things are taken from you at the beginning. But the reason we invest in anything is because we believe the long-term returns will be worth the short-term upfront costs.
This is why people shift the portfolio away from higher-earning equities and towards lower-earning bonds as they near retirement to begin with.
They know that they are giving up short-term return by doing so, but they also know that reducing risk and volatility in their portfolio as they near retirement helps increase their chances of meeting their retirement goals over the long-run.
The IUL is no different.
You are giving up early year returns and paying high upfront costs in order to achieve higher long-term returns and extremely low later year expenses.
Are you able to identify the right product and stick to a long-term retirement and financial plan?
If so, then the tax savings on investing in a bond portfolio combined with the reduced volatility and low later year expenses more than make up for the short-term costs here.
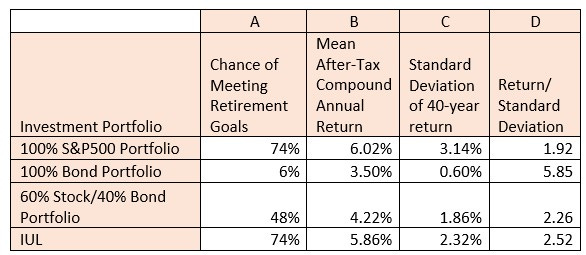
Because the alternative is to invest in bonds directly with no interest rate, volatility protection, and upside participation all so you can pay taxes that are higher than the expenses you would pay if you used a tax-free volatility wrapper that accomplishes this more efficiently.
Table 5: After-Tax Risk-Adjusted Returns of IUL vs Direct Equity or Bond Investing
About the Author
Rajiv Rebello is the Principal and Chief Actuary of Colva Insurance Services and Guaranteed Annuity Experts. He helps HNW clients implement better after-tax, risk-adjusted wealth and estate solutions through the use of strategic planning and life insurance and annuity vehicles. He can be reached at rajiv.rebello@colvaservices.com.
You can also book a call directly with him here:
No posts
Comments
Nothing yet. Say the first thing.
Sign in to join the conversation.