

Authors: Tom Michelman, Vice President & Senior Director Distributed Energy Resources Practice Lead and Sahil Bakht, Principal Analyst
Reading Time: 10 minutes
This is the first in four-part series on Pennsylvania’s net metering rates that leverages the February 2021Hommrich Decision. The decision allows for renewable projects up to 3 MWAC (e.g., solar PV customer-generators) of the investor-owned utilities with only parasitic load to accumulate (i.e., bank) net metering credits and then on an annual basis cash-out those net metering credits based on the applicable price-to-compare rate. Subsequent posts will cover PECO, FirstEnergy, and finally a comparison of the driving factors of each utility’s historic net metering rate variability and outlook. As we go, we will update our Pennsylvania net metering rate forecasts, which we had placed on hold while we and the industry digested the structural changes in Pennsylvania net metering project compensation.
In conversations and other postings, we have noted some industry confusion over the PPL net metering approved settlement in Docket R-2025-3057164 (the PPL distribution rate case. See Settlement Opinion and Order of June 4, 20261); particularly regarding the components of the net metering rate: including what they are, what they are comprised of, and what the ultimate drivers of the rates are. It is easy to get confused because the Pennsylvania utilities use similar but substantively different methods to set their price-to-compare (PTC2) rates which are used directly to compute net metering compensation.
Importantly larger per the Settlement Opinion and Order PPL net metering projects (i.e., over 100 kWAC) will be compensated under:
The Generation Supply Charge-2 (GSC-2) rider rate3 for default service (a/k/a provider of last resort, or POLR service) most commonly applicable to large commercial and industrial customers for their entire existence; or
If they are included in the140 MW cap, the projects will be grandfathered into the GSC-1 rate for 10 years and then transition to be compensated under the GSC-2 rider rate for the remainder of the project’s operating life. Virtually all projects were eligible to be compensated under the GSC-1 rate applicable to small commercial customers prior to the Docket R-2025-3057164 decision.
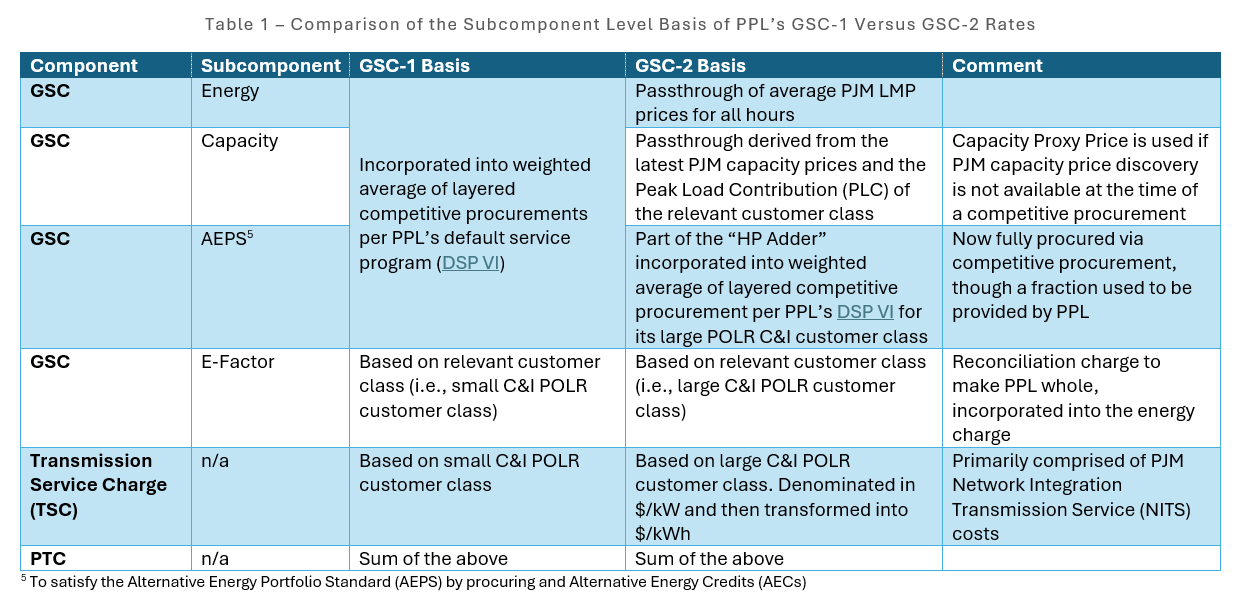
This begs the question of how the compensation for PPL’s net metering projects compares under rates GSC-1 versus GSC-2. Part of the answer can be found by reviewing the Settlement along with examples on PPL’s Price to Compare Historical Rates page. A summary of the important components4 that comprise the relevant PTC rate is provided in the table below. The two important takeaways are as follows:
While the GSC-1 rider rate and the GSC-2 rider rate have the same cost components, the energy, capacity, and E-factor and transmission service charge components are derived differently for each rider rate.
The largest structural difference is that the energy, capacity and AEPS portions of the GSC-1 rider rate are competitively procured as a fixed rate bundle versus only the AEPS costs being competitively procured for the GSC-2 rider rate with both hourly PJM locational marginal prices and PJM capacity costs incorporated into the GSC-2 rider rate as passthroughs.
Which begs the additional question, how do the two rider rates compare in terms of magnitude? We start answering that question in the next section.
The GSC-1 rider rate is set through November 2026. Conversely all but the PJM Locational Marginal Price (LMP - which is generally the largest or second largest component) component of the GSC-2 rider rate is known through November 2026. Thus, a fair comparison where the values of all components are known is for the June 2025 through May 2026 period, which algin with the two more recent six-month intervals of PTC rates. See chart below.
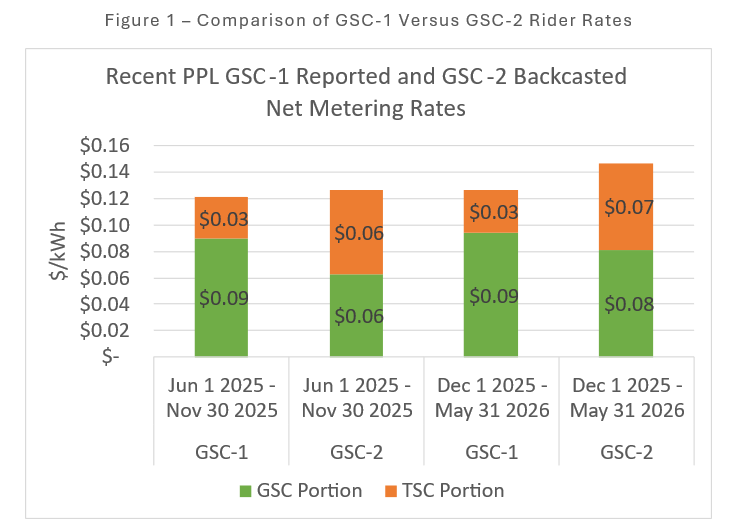
As noted in the table above, the GSC component is primarily comprised of generation, capacity, AEPS, E-Factor (reconciliation) costs, with administrative costs, line losses and gross receipt taxes. The transmission component is primarily comprised of NITS costs, net metering costs, its own reconciliation charge, and gross receipts taxes. The sources of the GSC-1 components are found on the PPL website: See PTC June 1, 2025 – November 30, 2025, and PTC December 1, 2025 – May 31, 2026, where the row labeled “GS1 G1D (Small Gen Svc)” is the rate class used by PPL DER projects. Going forward front of the meter renewable projects up to 3 MWAC will typically be compensated to the rate class that corresponds to row “MP1 (LP4 >=100 kw) (Real Time Pricing)” which includes:
The GSC (Generation Supply Charge), based on real-time PJM LMP pricing, and which PPL describes in its footnote 2 as “(2) The Real Time Price (RTP) includes the PJM real time hourly price with a correction for losses based on customer voltage level, the customer specific capacity value, administrative charges, over/under collection amounts from the previous period determined by the Company’s monthly reconciliation process and applicable GRT” or in other words the GSC components provided in the table above.
TSC (Transmission Service Charge), which is denominated in $/kW. For net metering compensation the $/kW rate must be transformed into a $/kWh rate, which we have done as part of our GSC-2 backcast.
With that context a couple of things should jump out to the reader (it jumped out for us).
Our backcast of the GSC-2 rider rate is higher than the GSC-1 rider rate for both periods.
Related, while the GSC component is lower for the GSC-2 rider rate as compared to GSC-1 rider rate (which is no surprise as we expect real time passthrough of wholesale LMPs to be typically lower than fixed retail rates for energy over the same period), the TSC component is substantially higher for GSC-2 rider rates as compared to GSC-1 rider rates for the same period.
So, what’s going on with the TSC component?
Those high backcasted TSC rates of $0.06-$0.07/kWh are driven by several factors.
Per the Settlement agreement, the TSC rate is computed as per PPL’s TSC filings. The June-November 2025 TSC filing can be found here. Go to page 3, the “Large Commercial & Industrial – Primary” column. Divide Line 7 (“Total Amount to be Recovered”) by Line 8 (“Projected Total Retail KWH Sales to Customers”) and then multiply by Line 12 (“Gross Receipts Tax”) and presto chango the result is $0.06376/kWh. Yes, over 6 cents/kWh as part of the GSC-2 net metering credit rate. So, what’s going on with that?
Peeling back another layer of the onion look at line 5 “Net Over(Under) Collection Amount”. You can see that it is approximately 1/3 of the total of Line 7. Or in other words, over 2 cents/kWh of the TSC rate comes from a reconciliation charge component. A reconciliation charge of any magnitude is not something we recommend you bank on unless you can show it is systematically biased to produce such a result.
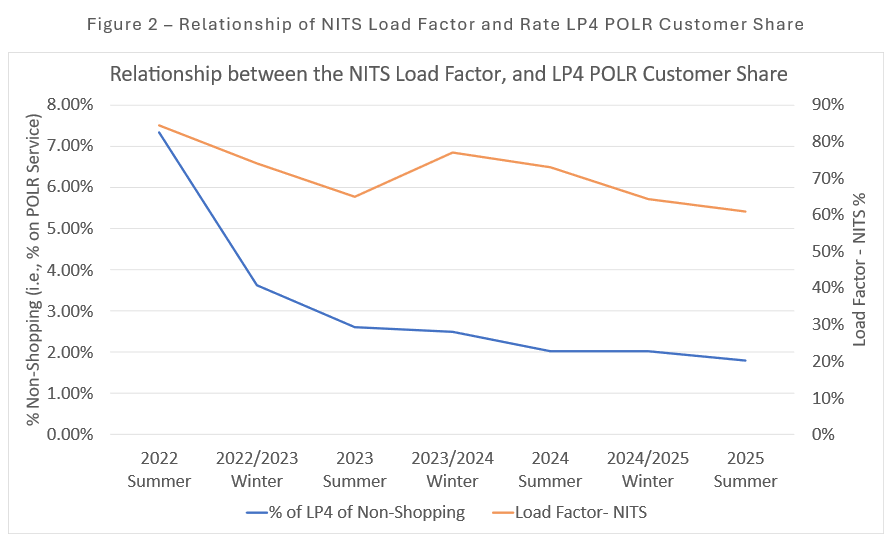
Finally peeling back the onion one last layer for this posting (yes, there are even more layers after this one), the relationship between billing demand (Line 9) and kWh consumption (Line 8) can be characterized by its load factor; that is the kWh consumption for a period – e.g. 8760 hours of a year divided by maximum peak consumption for the same period times the number of hours for that period. The peakier the consumption, the lower the load factor, the flatter the consumption, the higher the load factor. All things being equal, the higher the load factor, the lower the $/kW (and $/kWh) TSC rate, and vice versa. So, we investigated if we could see trends in the NITS related load factor for the large C&I POLR customer class, and indeed we did. The percentage of rate class LP4 (the rate class which is typically the basis of net metering credits for 3MWAC net metering solar projects) load non-shopping (i.e., customers on POLR service) peaked when natural gas and electricity peaked during the summer of 2022 (a partial result of Russia’s invasion of Ukraine). Per the graph below, as the percentage of POLR rate LP4 load left POLR and returned to electric generation suppliers (EGSs, i.e., retail competitive supplier), the load factor for the remaining POLR customers generally declined. Thus, all things being equal (e.g., the same PJM NITS rates assigned to PPL in $/MW-Year), the lower the load factor, the higher the TSC rates.
In additional analysis not provided here, we did peel back the onion several more layers to show how the NITS costs assigned to PPL as a whole are impacted as the NITS load factor varies, and how this variation ultimately (again) impacts the $/kWh TSC rate which are part and parcel of those PPL GSC-2 net metering rates (which you certainly care about if you have made it through these dense prose 😊).
We hope we cleared up some confusion on how PPL’s net metering rates are derived. Not surprisingly, we have provided this post to impress you with our command of the drivers of PPL’s net metering rates, and ultimately and hopefully purchase some of our, Sustainable Energy Advantage’s (SEA’s), analysis and forecasting services.
If you go to the SEA Store, you will find offers for four out-of-date Pennsylvania Price-to-Compare analyses and forecasts, which provide a similar level of detailed analysis. These include:
PA West Penn Power – Distributed Solar Revenue Streams Analysis & Forecast Price-to-Compare (December 2024)
PA Penelec – Distributed Solar Revenue Streams Analysis & Forecast Price-to-Compare (July 2025)
PA Met-Ed – Distributed Solar Revenue Streams Analysis & Forecast Price to Compare (January 2025)
PA PECO – Distributed Solar Revenue Streams Analysis & Forecast Price-to-Compare (January 2025)
You will note that we never productized a PPL analysis and curve. The primary reason for our hesitation was that we could never get clarity from PPL on how the $/kW transmission charges were transmuted into a $/kWh net metering credit for those select, but important rate classes. With the information we were able to glean from the Settlement documents, that transmutation has been cleared up as summarized above, and we will now offer a PPL analysis and forecast.
We paused creating/updating other Pennsylvania forecasts until the market had absorbed OBBBA and the dust had settled (or mostly settled) on the PPL and First Energy cases that have impacted net metering rates. Now that this has occurred, again we will be updating and posting our analyses and forecasts on the SEA Store over the coming weeks.
But even before that, we will be updating our Ameren-IL and ComEd-IL analysis and price curves, hopefully within the next week.
If you would like to be notified when our new/updated DER analysis and forecasts are available, or if you would like an analysis of another market (hint, hint – looking at you Maryland and New Jersey) or just to chat please contact us, we will be glad to keep in touch. Finally, we will be attending RE+ Mid-Atlantic on August 11-12 if you want to meet in person in Philadelphia.
Tom Michelman, Vice President & Senior Director Distributed Energy Resources Practice Lead
Contact: tmichelman@seadvantage.com | O: 508-665-5854 C: 978-580-6190
Calendly Booking pages: 15-minute (or less) call, 30-minute call, 45-minute call, or 60-minute call
Sahil Bakht, Principal Analyst
Contact: sbakht@seadvantage.com | O: 508-665-5854 C: 781-332-2475
Footnotes
Note as of August 2026, the Settlement Order is being contested by the Customer-Generator Coalition (CGC); we assume for this post that the Order will stand unchanged.
Named “Price-to-Compare” as it is the default service / provider of last resort rate a retail electric customer uses to compare against offers from a competitive retail Electric Generation Supplier (EGS).
GSC = Generation Supply Charge and is a rider (optional) rate and GSC-1 and GSC-2 are available to specific rate classes. A typical rate class for a 3MWAC customer-generator project is Rate LP-4 (Large General Service – 12 kV). Details (you don’t want to go into unless you must) are found here on PPL’s tariff page. Further a project could technically net meter and not choose to be under GSC-1 nor GSC-2 which are default service / provider of last resort options for generation service. That is a net metering project technically could take generation service from an EGS, but for a host of reasons, which we will not go into here, this option is impracticable.
Does not include adjustment for line losses, gross receipt taxes, State Tax Adjustment Surcharge (STAS), administrative charge.
Comments
Nothing yet. Say the first thing.
Sign in to join the conversation.