
Don’t take my word for it; try it yourself.
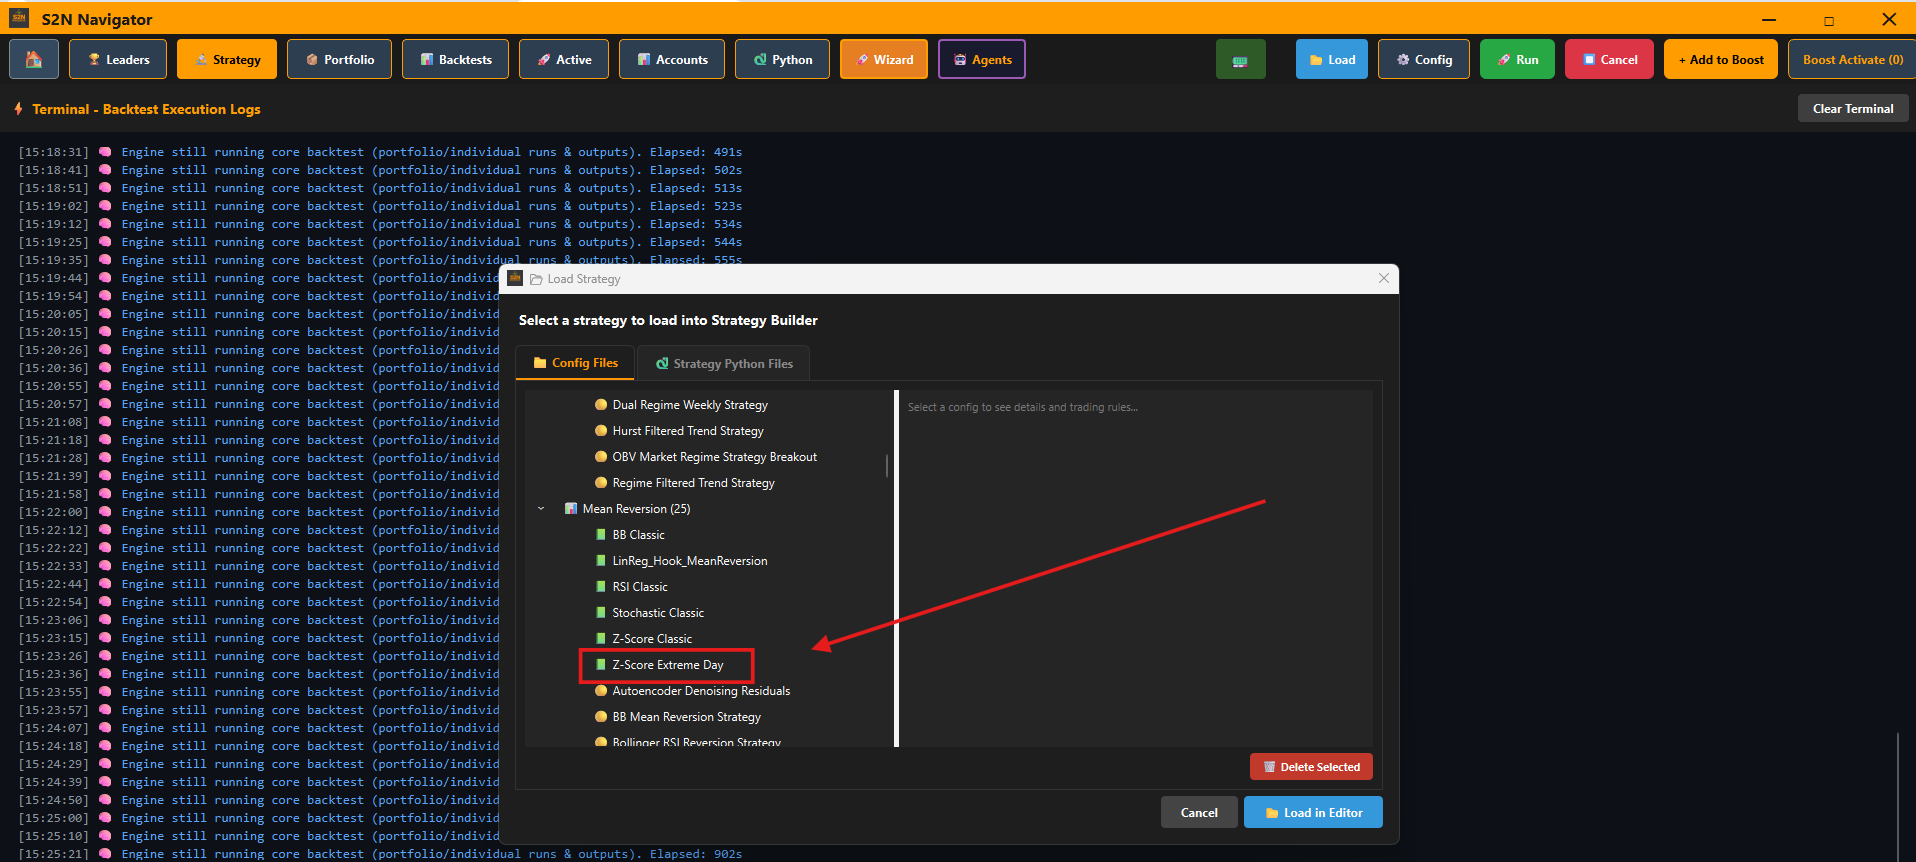
I wanted to check out a strategy that I call Z-Score Extreme Day from my catalogue of 100+ strategies.
A Z-score measures how many standard deviations a data point sits from the mean of its dataset, but the way I apply it matters as much as the metric itself.
I use a 2-year warm-up period to establish an initial mean, then look for a 4-sigma move to trigger a signal, holding the resulting long or short position for 30 days. If you are wondering how rare a 4-sigma event is, it is the equivalent of a random coin toss landing on heads 14 times in a row or the equivalent of happening 1 in 15,787 days, assuming a normal distribution. In other words, it doesn’t happen often.
What makes this approach different is the lookback window. Rather than fixing it at 2 years and rolling it forward, I let it expand continuously from the starting point in this case, 1970. The mean is never discarded; it just keeps accumulating. Every new data point joins the full history.
This is deliberate. I’m allergic to throwing away data. The more observations you include, the closer you get to capturing how something actually behaves across full market cycles. And since most of history is, in some form, history repeating itself, an expanding window is my philosophical stance.
I applied this rule across my futures database of 68 symbols. There are a few subtle rules in the minimums so that the strategy is not applied across too small a sample size in breadth and depth. Nothing complex; I just don’t want to challenge your concentration unnecessarily.
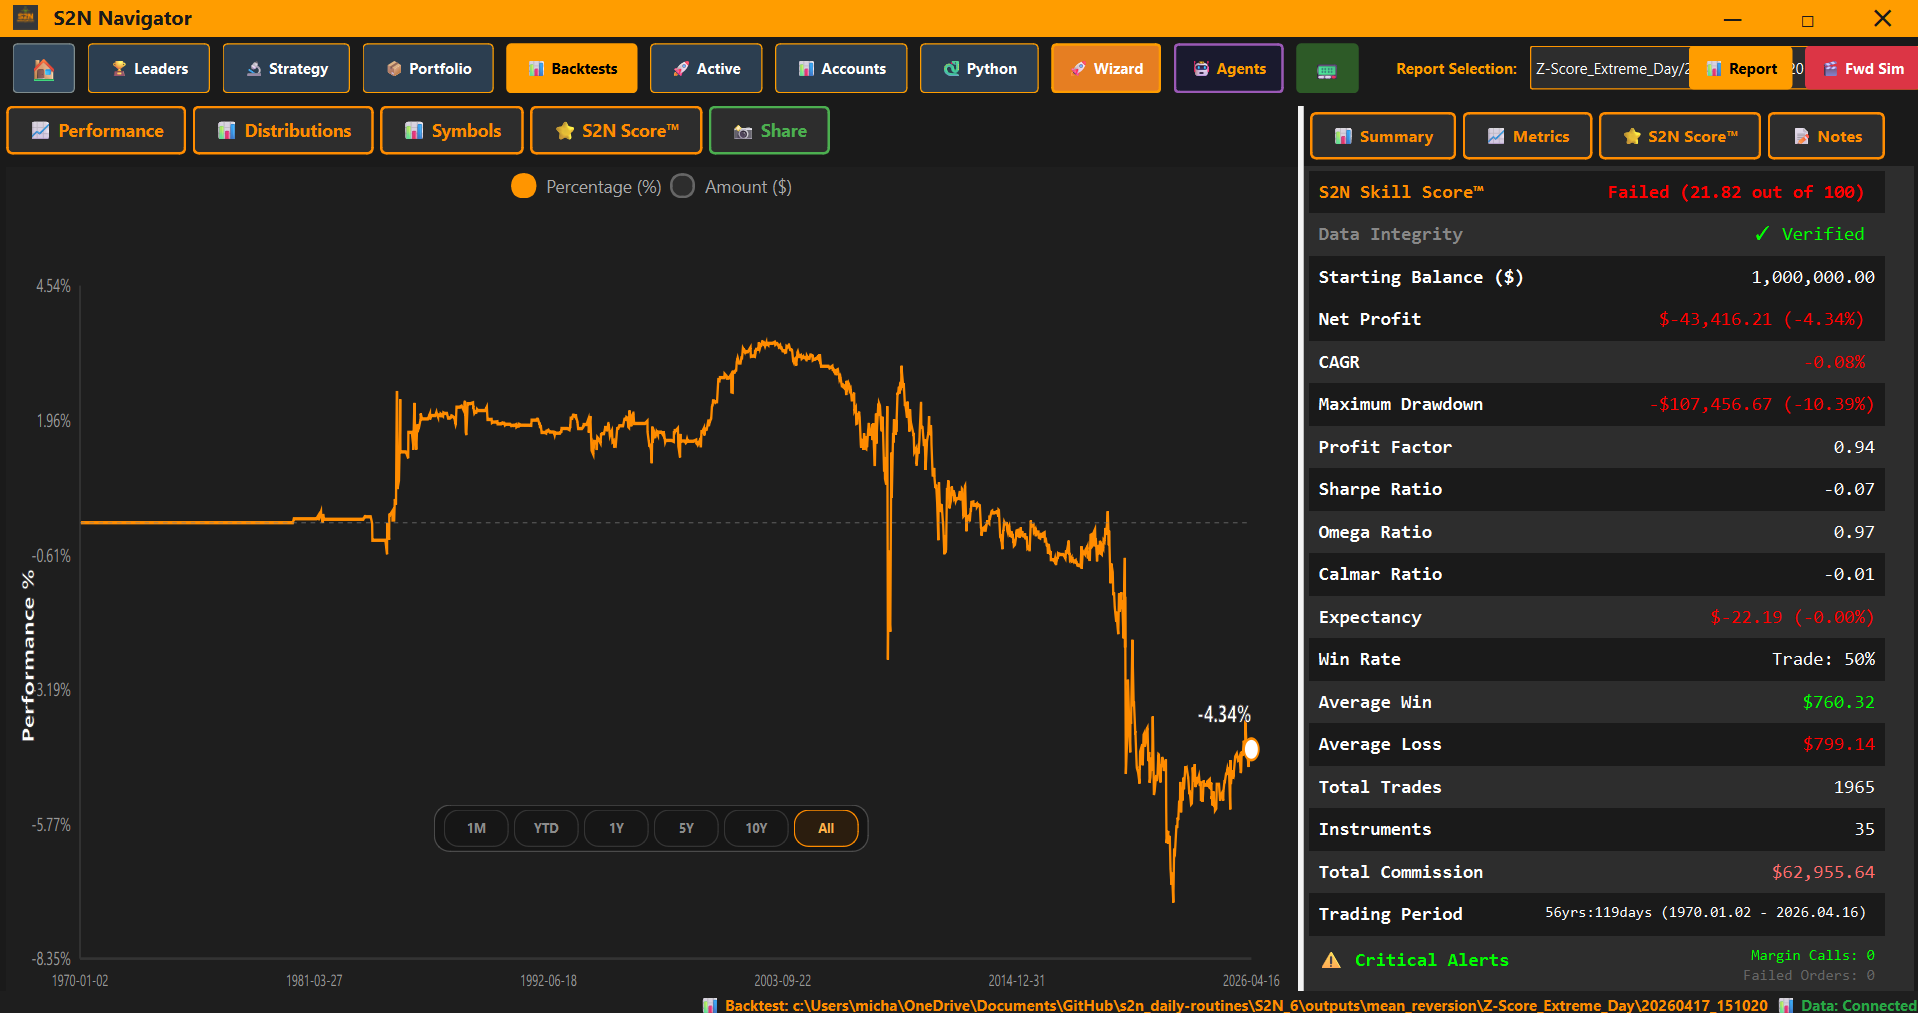
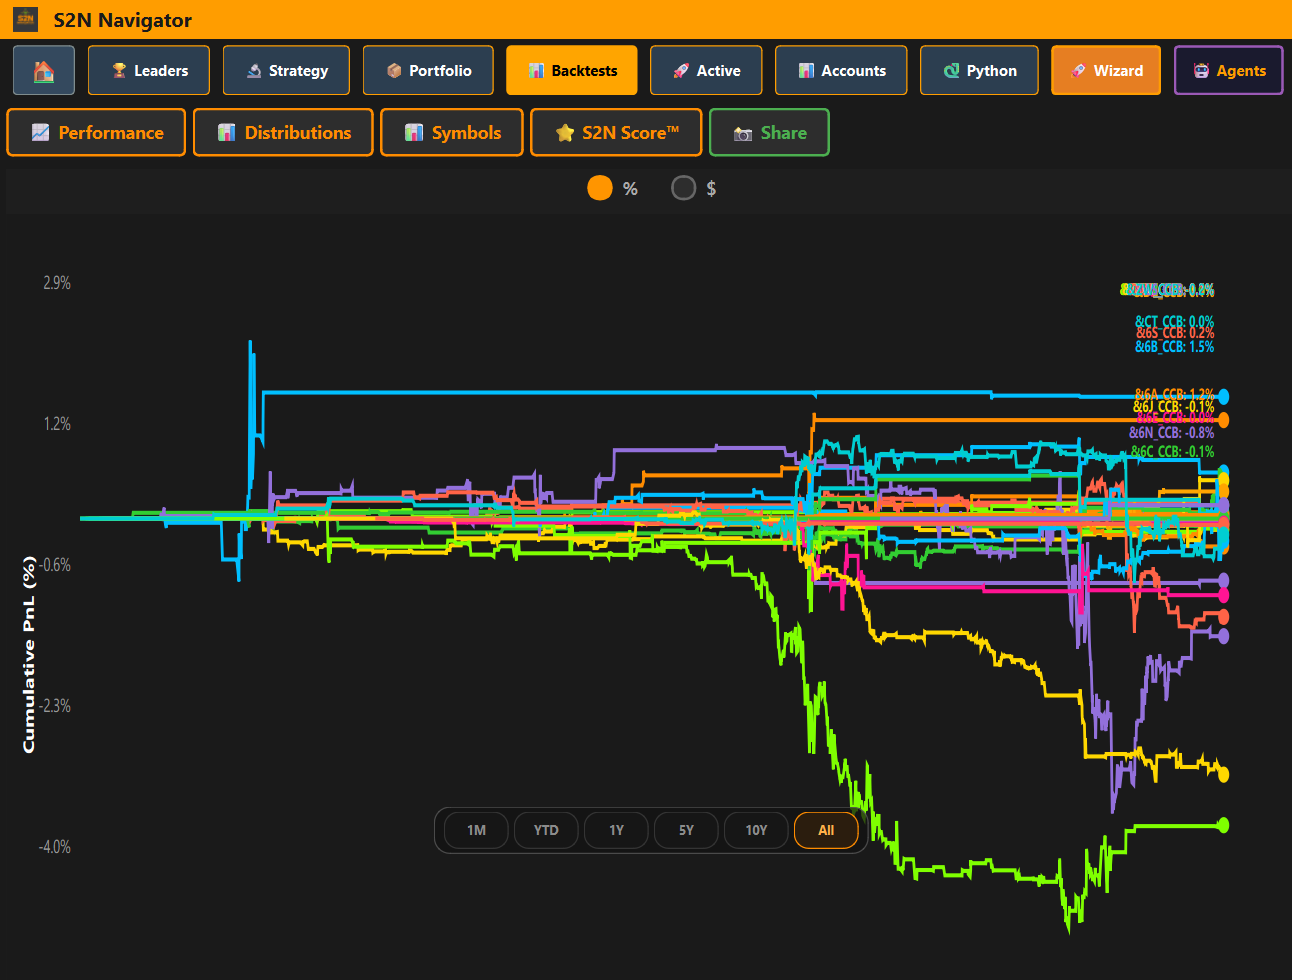
There were 1,965 in-and-out trades (982 signals) across 35 instruments. This is the power of using a broad universe. It really captures the outliers. You can see that there were 3 or 4 symbols that really cost the portfolio.
I have used equal-weighted allocations. If you are tempted to run this again without those symbols causing problems, you are making a fatal backtesting mistake. The Navigator framework will penalise you if you do that, but it cannot protect you completely.
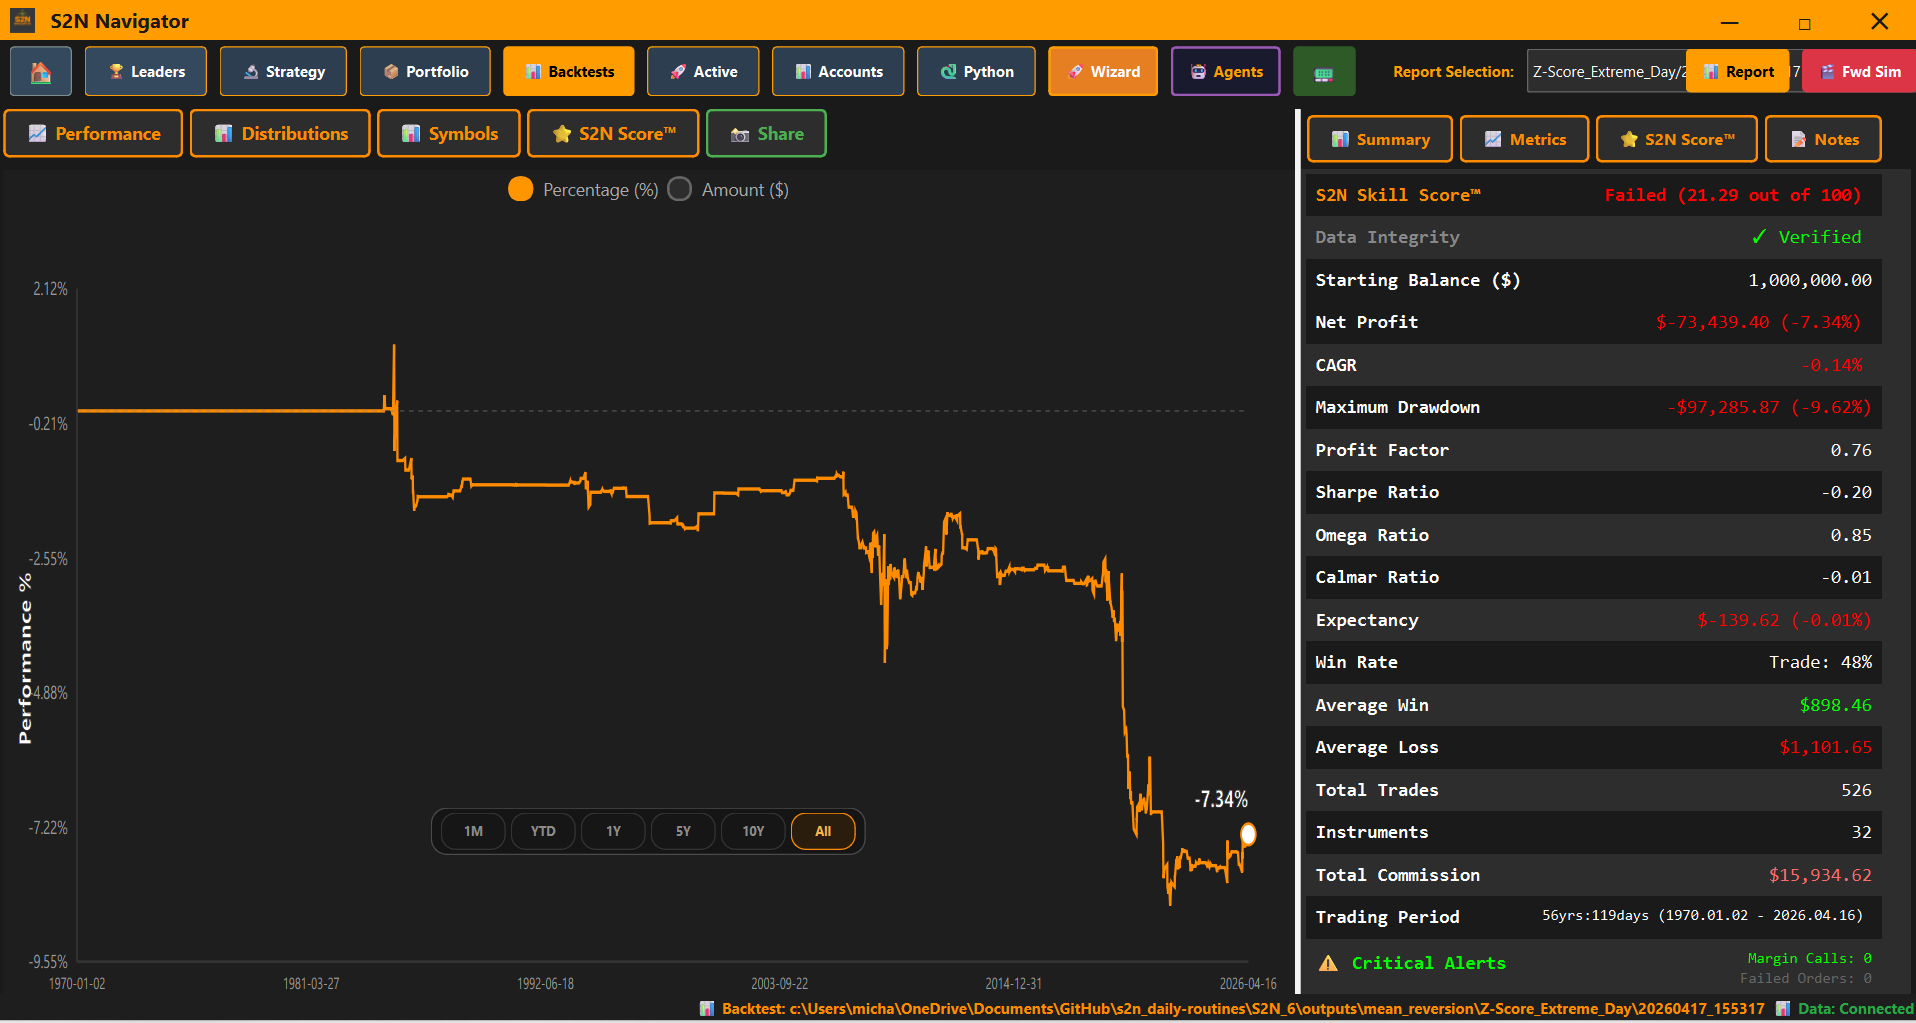
I cannot just let this go; I am running one more version this time with a 6-sigma threshold. That is the equivalent of once every 1.38 million years, if you believe the textbooks. Spoiler: markets don't read textbooks
It should be pretty obvious now that financial markets are not normally distributed, as you can see there have been 263 signals (526 round trips).
Things just got worse.
This is what a profitable symbol the S&P 500 emini future looks like.
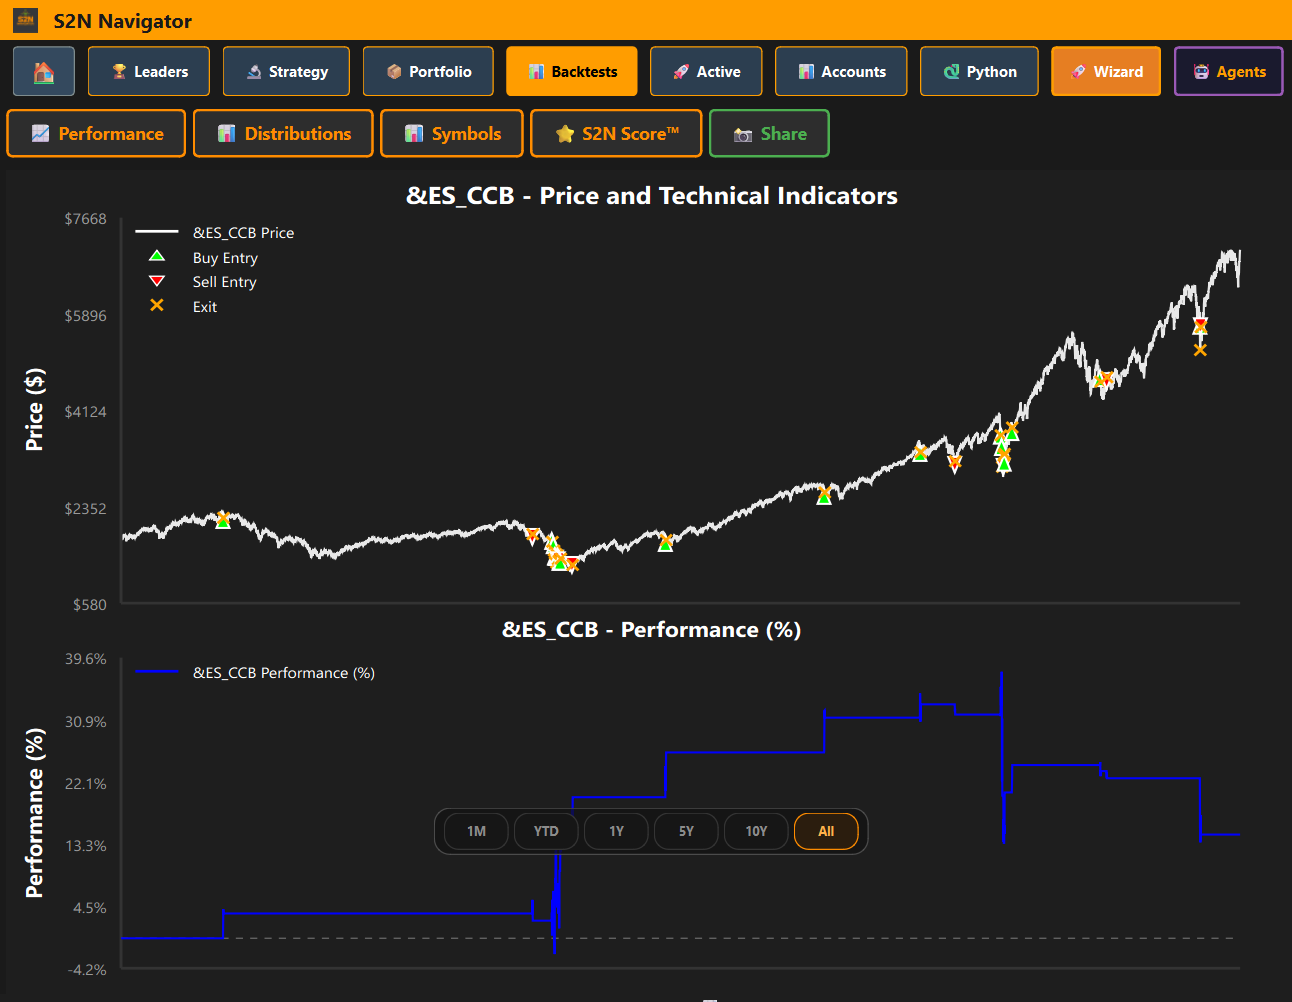
This is how the wheat future looks.
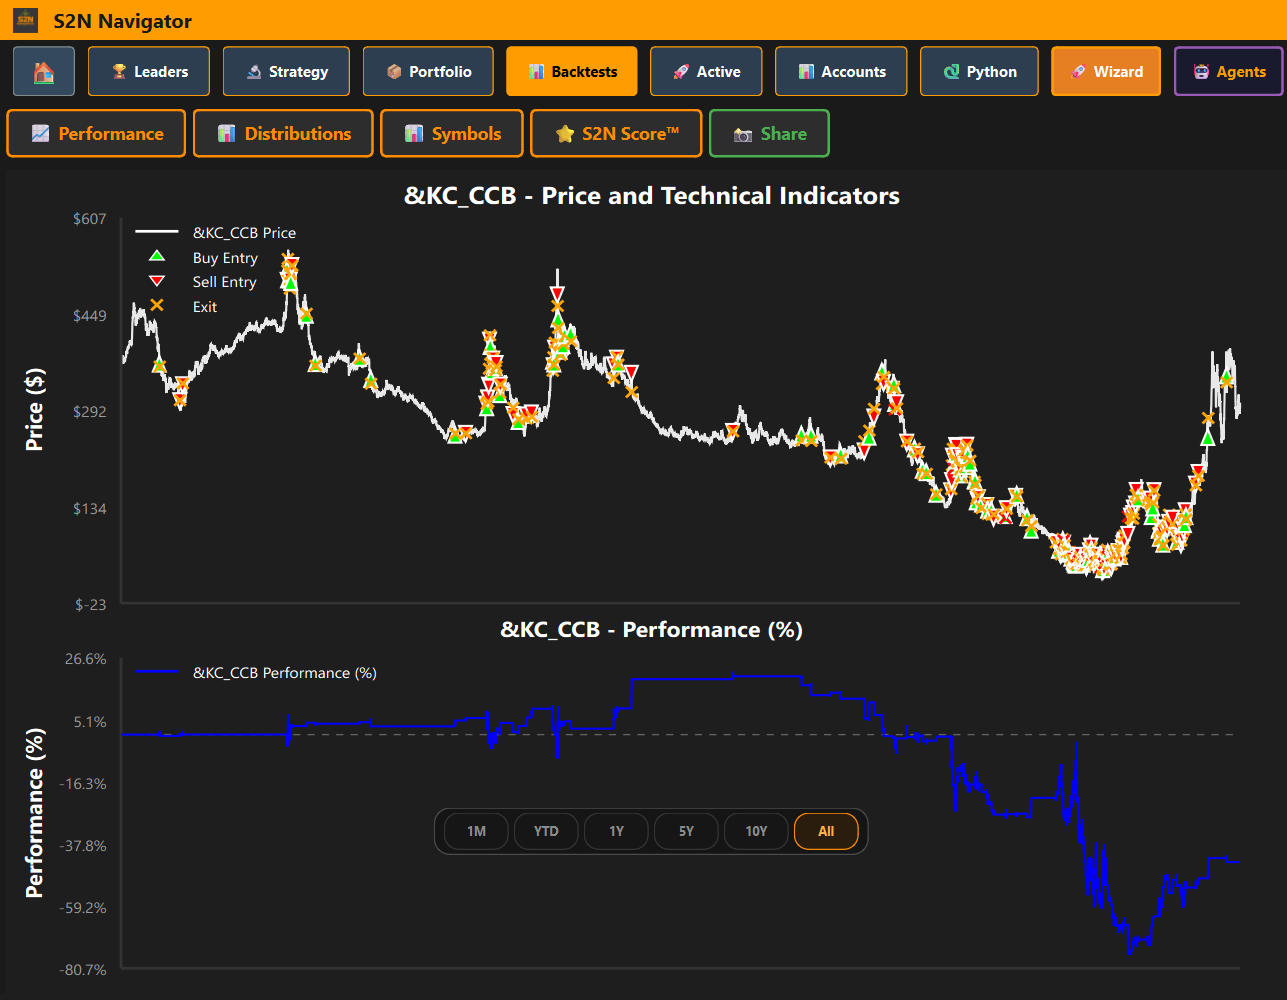
This kind of extreme move trading is not profitable in its current form. I see a small clue in the above charts that might be a reason why the future KC back-adjusted future is triggering way more signals than the stock index future. It relates to the anomalies with futures chains that can go negative in price.
I am out of time. I am not done here. However, this is pretty damning for mean reversion in its current form.
Don’t take my word for it; try it yourself.
No posts
Comments
Nothing yet. Say the first thing.
Sign in to join the conversation.